

This is a preprint.
Estimating the Cumulative Incidence of COVID-19 in the United States Using Four Complementary Approaches
- PMID: 32587997
- PMCID: PMC7310656
- DOI: 10.1101/2020.04.18.20070821
Estimating the Cumulative Incidence of COVID-19 in the United States Using Four Complementary Approaches
Update in
-
Estimating the cumulative incidence of COVID-19 in the United States using influenza surveillance, virologic testing, and mortality data: Four complementary approaches.PLoS Comput Biol. 2021 Jun 17;17(6):e1008994. doi: 10.1371/journal.pcbi.1008994. eCollection 2021 Jun. PLoS Comput Biol. 2021. PMID: 34138845 Free PMC article.
Abstract
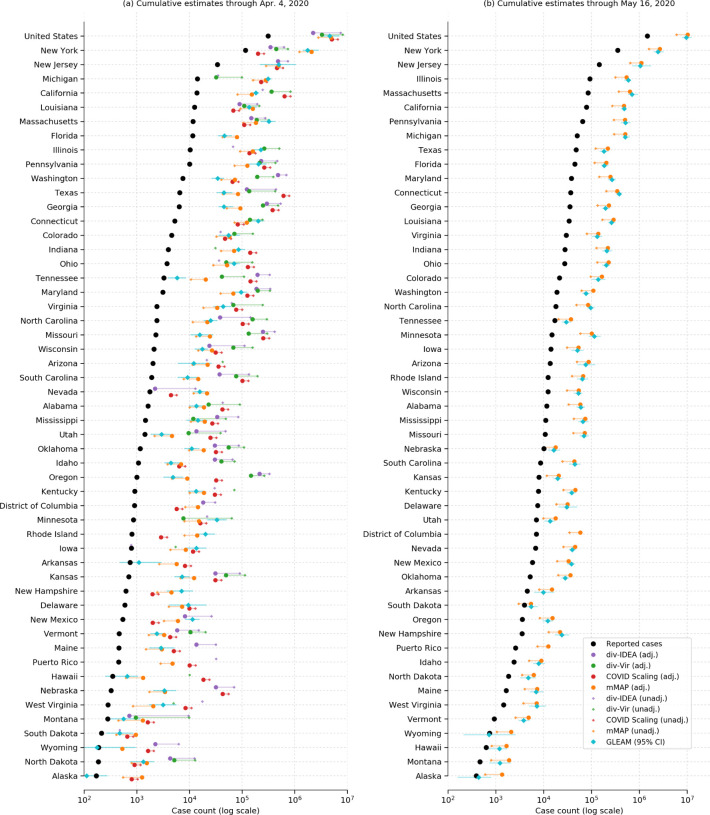
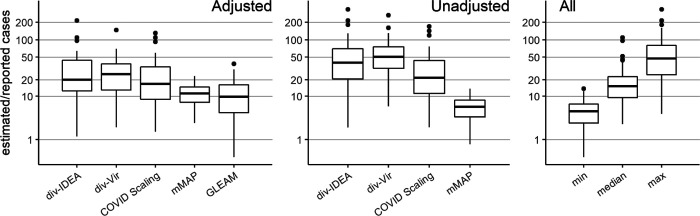
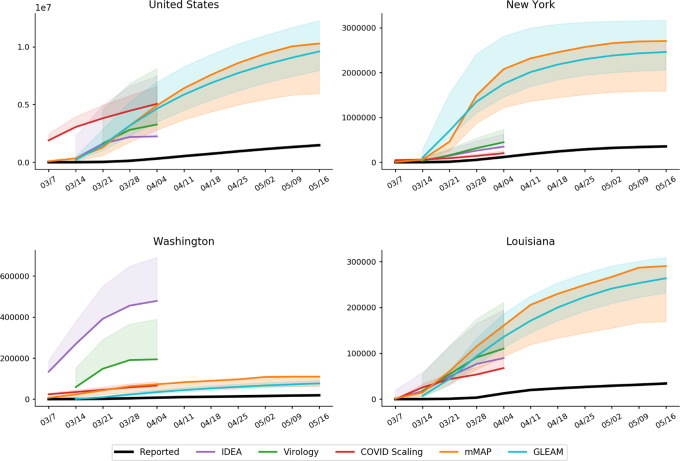
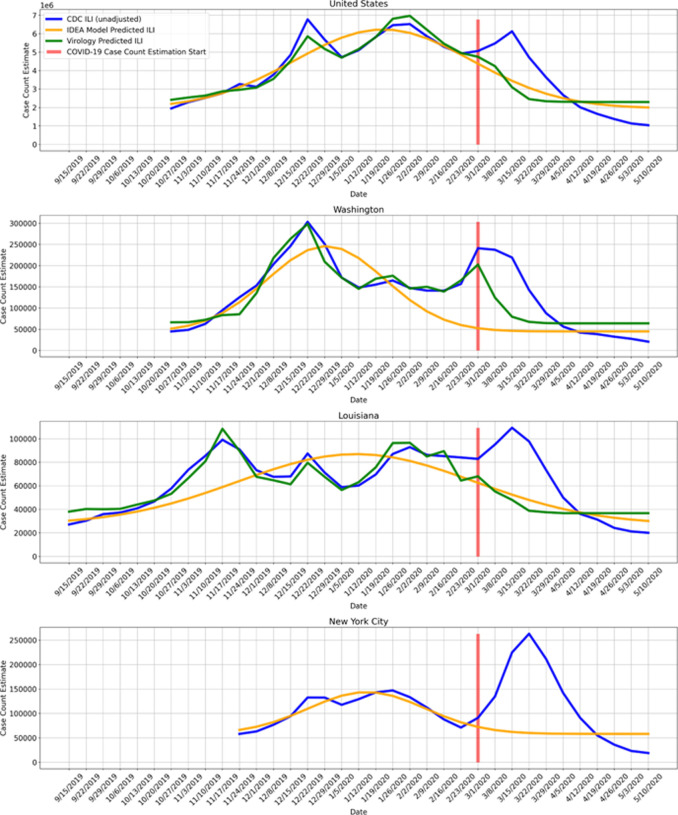
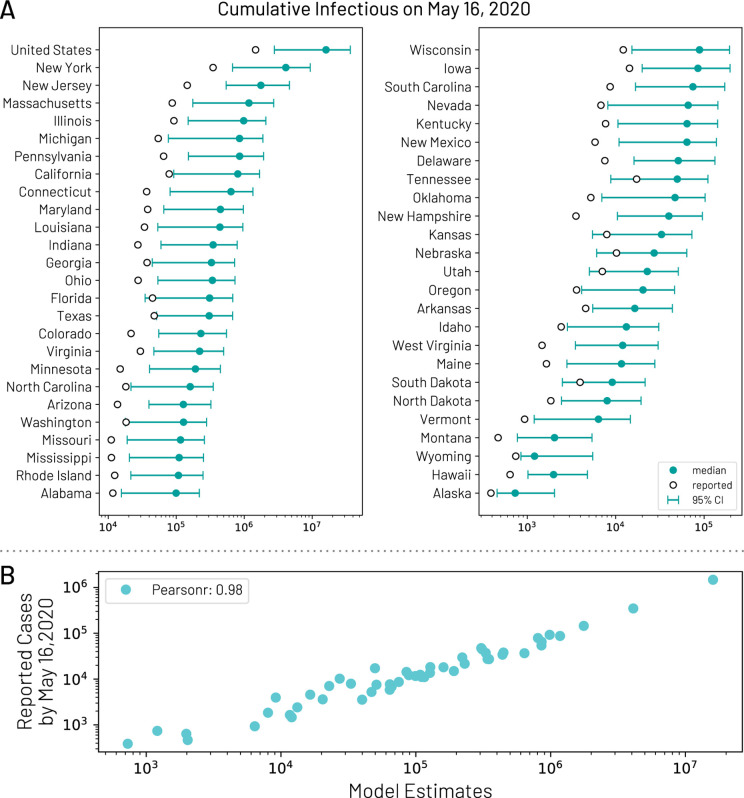
Effectively designing and evaluating public health responses to the ongoing COVID-19 pandemic requires accurate estimation of the prevalence of COVID-19 across the United States (US). Equipment shortages and varying testing capabilities have however hindered the useful-ness of the official reported positive COVID-19 case counts. We introduce four complementary approaches to estimate the cumulative incidence of symptomatic COVID-19 in each state in the US as well as Puerto Rico and the District of Columbia, using a combination of excess influenza-like illness reports, COVID-19 test statistics, COVID-19 mortality reports, and a spatially structured epidemic model. Instead of relying on the estimate from a single data source or method that may be biased, we provide multiple estimates, each relying on different assumptions and data sources. Across our four approaches emerges the consistent conclusion that on April 4, 2020, the estimated case count was 5 to 50 times higher than the official positive test counts across the different states. Nationally, our estimates of COVID-19 symptomatic cases as of April 4 have a likely range of 2.2 to 4.9 million, with possibly as many as 8.1 million cases, up to 26 times greater than the cumulative confirmed cases of about 311,000. Extending our method to May 16, 2020, we estimate that cumulative symptomatic incidence ranges from 6.0 to 10.3 million, as opposed to 1.5 million positive test counts. The proposed combination of approaches may prove useful in assessing the burden of COVID-19 during resurgences in the US and other countries with comparable surveillance systems.
Conflict of interest statement
Conflicts of Interest No conflicts of interest.
Figures
Similar articles
-
Estimating the cumulative incidence of COVID-19 in the United States using influenza surveillance, virologic testing, and mortality data: Four complementary approaches.PLoS Comput Biol. 2021 Jun 17;17(6):e1008994. doi: 10.1371/journal.pcbi.1008994. eCollection 2021 Jun. PLoS Comput Biol. 2021. PMID: 34138845 Free PMC article.
-
Assisted reproductive technology surveillance--United States, 2011.MMWR Surveill Summ. 2014 Nov 21;63(10):1-28. MMWR Surveill Summ. 2014. PMID: 25412164
-
Estimating COVID-19 Hospitalizations in the United States With Surveillance Data Using a Bayesian Hierarchical Model: Modeling Study.JMIR Public Health Surveill. 2022 Jun 2;8(6):e34296. doi: 10.2196/34296. JMIR Public Health Surveill. 2022. PMID: 35452402 Free PMC article.
-
Estimated Incidence of Coronavirus Disease 2019 (COVID-19) Illness and Hospitalization-United States, February-September 2020.Clin Infect Dis. 2021 Jun 15;72(12):e1010-e1017. doi: 10.1093/cid/ciaa1780. Clin Infect Dis. 2021. PMID: 33237993 Free PMC article.
-
Estimating Methods of the Undetected Infections in the COVID-19 Outbreak: A Systematic Review.Infect Disord Drug Targets. 2023;23(4):e240123213106. doi: 10.2174/1871526523666230124162103. Infect Disord Drug Targets. 2023. PMID: 36698234
Cited by
-
A novel comprehensive metric to assess effectiveness of COVID-19 testing: Inter-country comparison and association with geography, government, and policy response.PLoS One. 2021 Mar 5;16(3):e0248176. doi: 10.1371/journal.pone.0248176. eCollection 2021. PLoS One. 2021. PMID: 33667280 Free PMC article.
-
Social distancing to slow the US COVID-19 epidemic: Longitudinal pretest-posttest comparison group study.PLoS Med. 2020 Aug 11;17(8):e1003244. doi: 10.1371/journal.pmed.1003244. eCollection 2020 Aug. PLoS Med. 2020. PMID: 32780772 Free PMC article.
References
-
- World Health Organization. Report of the who-china joint mission on coronavirus disease 2019.
-
- Centers for Disease Control and Prevention. Locations with confirmed covid-19 cases.
-
- Lipsitch Marc and Santillana Mauricio. Enhancing situational awareness to prevent infectious disease outbreaks from becoming catastrophic. Global Catastrophic Biological Risks, pages 59–74, 2019. - PubMed
-
- Kaplan Sheila Fink Sheri Thomas Katie Shear Michael D., Goodnough Abby and Weiland Noah. The lost month: How a failure to test blinded the u.s. to covid-19.
-
- Manrai Arjun K. and Mandl Kenneth D.. Covid-19 testing: overcoming challenges in the next phase of the epidemic.
Publication types
Grants and funding
LinkOut - more resources
Full Text Sources
Miscellaneous