

Sex, Race, and Age Differences in Prevalence of Dementia in Medicare Claims and Survey Data
- PMID: 32588052
- PMCID: PMC7887731
- DOI: 10.1093/geronb/gbaa083
Sex, Race, and Age Differences in Prevalence of Dementia in Medicare Claims and Survey Data
Abstract
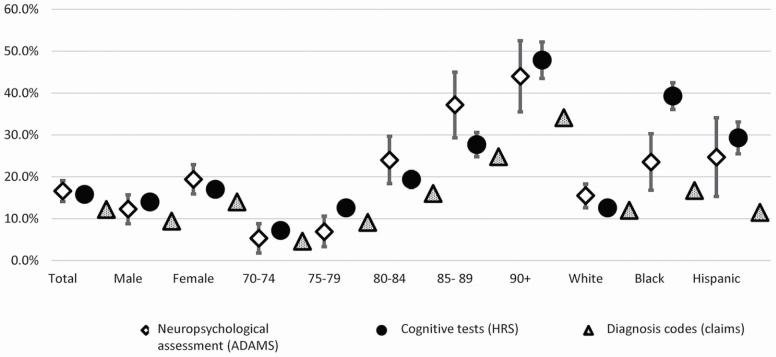
Objectives: This study provides the first comparison of trends in dementia prevalence in the U.S. population using 3 different dementia ascertainments/data sources: neuropsychological assessment, cognitive tests, and diagnosis codes from Medicare claims.
Methods: We used data from the nationally representative Health and Retirement Study and Aging, Demographics, and Memory Study, and a 20% random sample of Medicare beneficiaries. We compared dementia prevalence across the 3 sources by race, gender, and age. We estimated trends in dementia prevalence from 2006 to 2013 based on cognitive tests and diagnosis codes utilizing logistic regression.
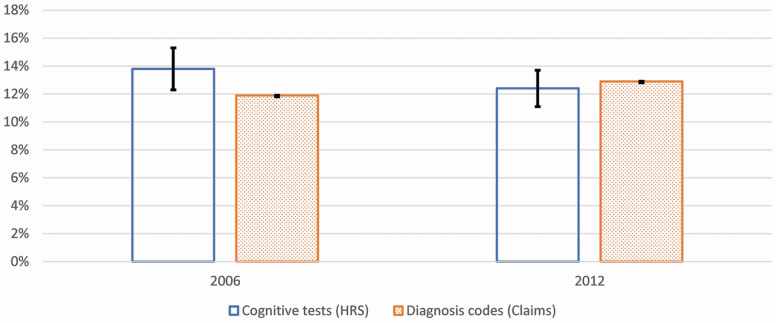
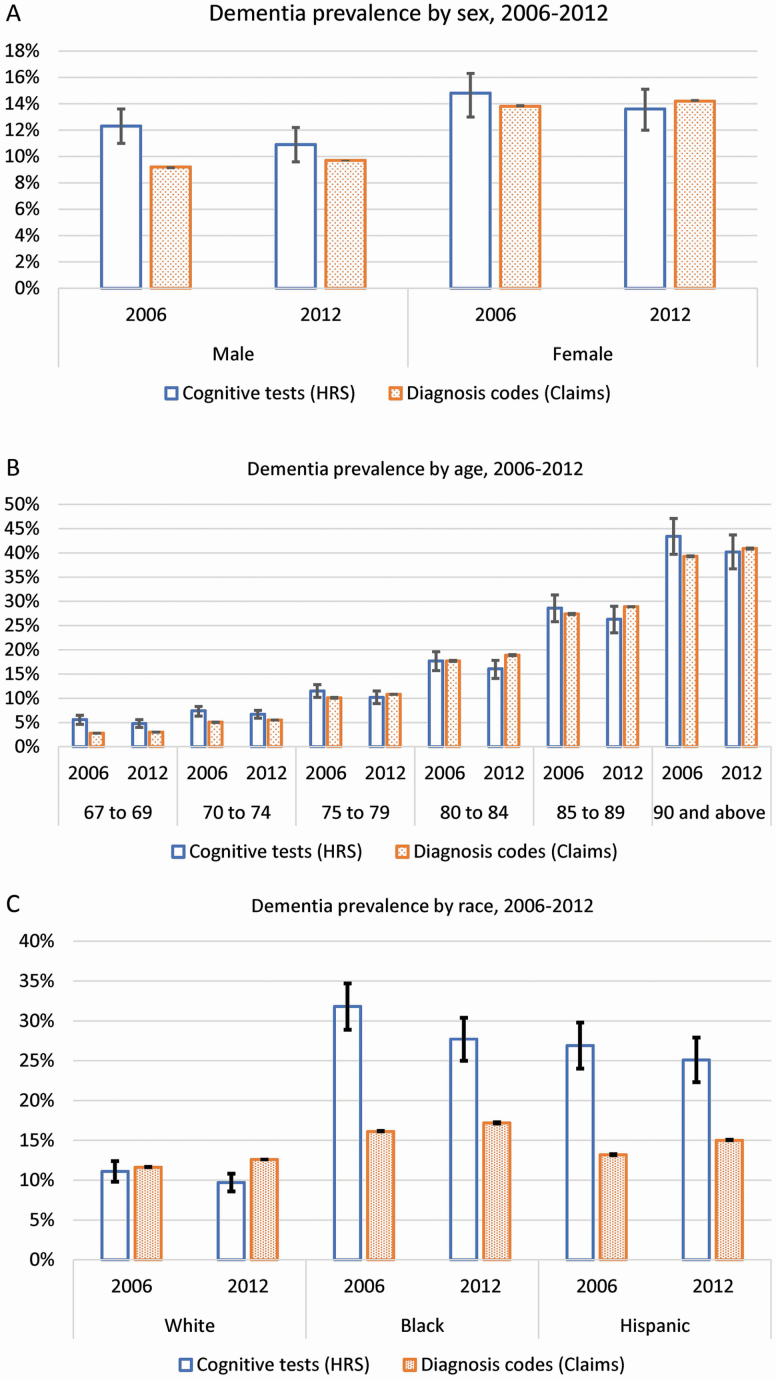
Results: Dementia prevalence among older adults aged 70 and older in 2004 was 16.6% (neuropsychological assessment), 15.8% (cognitive tests), and 12.2% (diagnosis codes). The difference between dementia prevalence based on cognitive tests and diagnosis codes diminished in 2012 (12.4% and 12.9%, respectively), driven by decreasing rates of cognitive test-based and increasing diagnosis codes-based dementia prevalence. This difference in dementia prevalence between the 2 sources by sex and for age groups 75-79 and 90 and older vanished over time. However, there remained substantial differences across measures in dementia prevalence among blacks and Hispanics (10.9 and 9.8 percentage points, respectively) in 2012.
Discussion: Our results imply that ascertainment of dementia through diagnosis may be improving over time, but gaps across measures among racial/ethnic minorities highlight the need for improved measurement of dementia prevalence in these populations.
Keywords: Cognitive tests; Diagnosis codes; Neuropsychological assessment; Racial/ethnic minorities; Trends.
© The Author(s) 2020. Published by Oxford University Press on behalf of The Gerontological Society of America. All rights reserved. For permissions, please e-mail: journals.permissions@oup.com.
Figures
References
-
- Amjad, H., Roth, D. L., Sheehan, O. C., Lyketsos, C. G., Wolff, J. L., & Samus, Q. M (2018). Underdiagnosis of dementia: An observational study of patterns in diagnosis and awareness in US older adults. Journal of General Internal Medicine, 33(7), 1131–1138. doi:10.1007/s11606-018-4377-y - DOI - PMC - PubMed
-
- Brandt, J., Spencer, M., & Folstein, M (1988). The telephone interview for cognitive status. Neuropsychiatry, Neuropsychology and Behavioral Neurology, 1(2), 111–117. https://journals.lww.com/cogbehavneurol/Abstract/1988/00120/The_Telephon...
Publication types
MeSH terms
Grants and funding
LinkOut - more resources
Full Text Sources
Medical
