

On some factors determining the pressure drop across tracheal tubes during high-frequency percussive ventilation: a flow-independent model
- PMID: 32588314
- PMCID: PMC7316425
- DOI: 10.1007/s10877-020-00548-1
On some factors determining the pressure drop across tracheal tubes during high-frequency percussive ventilation: a flow-independent model
Abstract
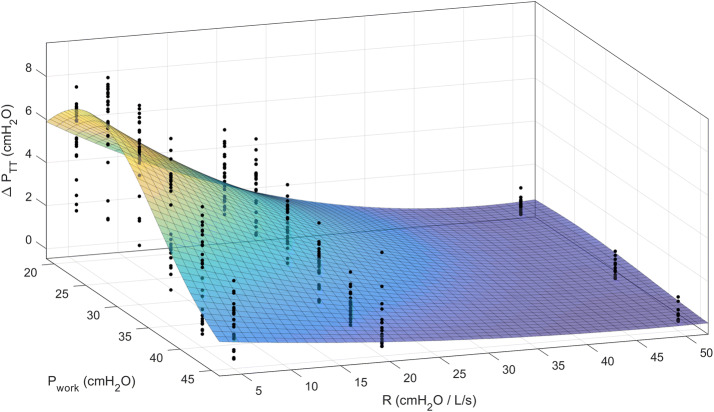
To provide an in vitro estimation of the pressure drop across tracheal tubes (ΔPTT) in the face of given pulsatile frequencies and peak pressures (Pwork) delivered by a high-frequency percussive ventilator (HFPV) applied to a lung model. Tracheal tubes (TT) 6.5, 7.5 and 8.0 were connected to a test lung simulating the respiratory system resistive (R = 5, 20, 50 cmH2O/L/s) and elastic (C = 10, 20, and 50 mL/cmH2O) loads. The model was ventilated by HFPV with a pulse inspiratory peak pressure (work pressure Pwork) augmented in 5-cmH2O steps from 20 to 45 cmH2O, yielding 6 diverse airflows. The percussive frequency (f) was set to 300, 500 and 700 cycles/min, respectively. Pressure (Paw and Ptr) and flow (V') measurements were performed for all 162 possible combinations of loads, frequencies, and work pressures for each TT size, thus yielding 486 determinations. For each respiratory cycle ΔPTT was calculated by subtracting each peak Ptr from its corresponding peak Paw. A non-linear model was constructed to assess the relationships between single parameters. Performance of the produced model was measured in terms of root mean square error (RMSE) and the coefficient of determination (r2). ΔPTT was predicted by Pwork (exponential Gaussian relationship), resistance (quadratic and linear terms), frequency (quadratic and linear terms) and tube diameter (linear term), but not by compliance. RMSE of the model on the testing dataset was 1.17 cmH2O, r2 was 0.79 and estimation error was lower than 1 cmH2O in 68% of cases. As a result, even without a flow value, the physician would be able to evaluate ΔPTT pressure. If the present results of our bench study could be clinically confirmed, the use of a nonconventional ventilatory strategy as HFPV, would be safer and easier.
Keywords: Biomedical modeling; Biomedical signal processing; High-frequency percussive ventilation; Respiratory mechanics; Tracheal tubes.
© 2020. Springer Nature B.V.
Conflict of interest statement
The authors declare that they have no conflict of interest.
Figures


Similar articles
-
In vitro estimation of pressure drop across tracheal tubes during high-frequency percussive ventilation.Physiol Meas. 2014 Feb;35(2):177-88. doi: 10.1088/0967-3334/35/2/177. Epub 2014 Jan 7. Physiol Meas. 2014. PMID: 24398394
-
Effects of mechanical load on flow, volume and pressure delivered by high-frequency percussive ventilation.Respir Physiol Neurobiol. 2004 Aug 20;142(1):81-91. doi: 10.1016/j.resp.2004.04.005. Respir Physiol Neurobiol. 2004. PMID: 15351306
-
Comparison of flow and gas washout characteristics between pressure control and high-frequency percussive ventilation using a test lung.Physiol Meas. 2018 Mar 15;39(3):035001. doi: 10.1088/1361-6579/aaaaa2. Physiol Meas. 2018. PMID: 29369819 Free PMC article.
-
Mechanical loads modulate tidal volume and lung washout during high-frequency percussive ventilation.Respir Physiol Neurobiol. 2006 Jan 25;150(1):44-51. doi: 10.1016/j.resp.2005.02.015. Respir Physiol Neurobiol. 2006. PMID: 16448933
-
Performance characteristics of high-frequency percussive ventilation under hyperbaric conditions.Undersea Hyperb Med. 2021 Second Quarter;48(2):157-168. doi: 10.22462/03.04.2021.6. Undersea Hyperb Med. 2021. PMID: 33975406
Cited by
-
Polymyxin B Peptide Hydrogel Coating: A Novel Approach to Prevent Ventilator-Associated Pneumonia.Int J Mol Sci. 2024 Sep 24;25(19):10269. doi: 10.3390/ijms251910269. Int J Mol Sci. 2024. PMID: 39408597 Free PMC article.
References
-
- Rocco PRM, Zin WA. Modelling the mechanical effects of tracheal tubes in normal subjects. Eur J Physiol. 1995;8:121–6. - PubMed
MeSH terms
LinkOut - more resources
Full Text Sources
Research Materials
