. 2020 Oct;91(5):598-604.
doi: 10.1080/17453674.2020.1783484. Epub 2020 Jun 26.

Time trends in pediatric fractures in a Swedish city from 1950 to 2016

Affiliations

Time trends in pediatric fractures in a Swedish city from 1950 to 2016

Erika Bergman et al. Acta Orthop. 2020 Oct.

Abstract

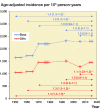
Background and purpose - As previous studies indicate time trends in pediatric fracture incidence, we followed the incidence in a Swedish city between 1950 and 2016.Patients and methods - Malmö city, Sweden had 322,574 inhabitants in 2015. We used diagnosis registry, charts, and radiographs of the only city hospital to classify fractures in individuals < 16 years in 2014-2016, and compared these with data from 1950-2006. We used joinpoint regression to analyze time trends and present results as mean annual percentage changes (APC). Differences between periods are described as incident rate ratios (IRR). To describe uncertainty, 95% confidence intervals (CI) are used.Results - During 2014-2016 the pediatric fracture incidence was 1,786 per 105 person-years (boys 2,135 and girls 1,423). From 1950 onwards age-adjusted fracture incidence increased until 1979 in both boys (APC +1.5%, CI 1.2-1.8) and girls (APC +1.6%, CI 0.8-2.5). The incidence remained stable from 1979 to 2016 (APC in boys 0.0%, CI -0.3 to 0.3 and in girls -0.2%, CI -1.1 to 0.7). Age-adjusted incidence 2014-2016 was higher than 2005-2006 in girls (IRR 1.1, CI 1.03-1.3), but not in boys (IRR 1.0, CI 0.9-1.1).Interpretation - Fracture incidence was in girls higher in 2014-2016 than in 2005-2006. However, only with more than 2 measuring points are meaningful trend analyses possible. When we analyzed the period 1950-2016 with 17 measuring points and joinpoint regression, we found that fracture incidence increased in both sexes until 1979 but has thereafter been stable.


Figures
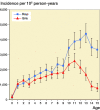
Figure 1.
Figure 1.
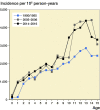
Fracture incidence per 105 person-years in boys and girls aged 0–15 years in Malmц, Sweden, during the years 2014–2016. Data are presented with 95% confidence intervals (CI 95%) per 1-year age class.
Figure 3.
Figure 3.
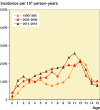
Fracture incidence per 105 person-years in boys (left panel) and girls (right panel) aged 0–15 years in Malmц, Sweden, during the periods 1950/1955 (study start), 2005–2006 (earlier study), and 2014–2016 (present study), representing fracture incidence during different decades.
Figure 3.
Figure 3.
Fracture incidence per 105 person-years in boys (left panel) and girls (right panel) aged 0–15 years in Malmц, Sweden, during the periods 1950/1955 (study start), 2005–2006 (earlier study), and 2014–2016 (present study), representing fracture incidence during different decades.
Figure 5.
Figure 5.
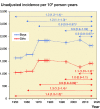
Unadjusted fracture (left panel) and age-adjusted fracture (right panel) incidence per 105 person-years in boys and girls aged 0–15 years in Malmц, Sweden, in 2014–2016 in comparison with 1950/1955, 1960/1965, 1970/1975–1979, 1993–1994, and 2005–2006. These periods are shown with thick lines, with line markers representing the number of years measured in the period. An arrow indicates the 2 compared periods with incident rate ratios (IRR) in fracture incidence with 95% confidence intervals (95% CI) presented above the arrow. aindicates statistically significant changes.
Figure 5.
Figure 5.
Unadjusted fracture (left panel) and age-adjusted fracture (right panel) incidence per 105 person-years in boys and girls aged 0–15 years in Malmц, Sweden, in 2014–2016 in comparison with 1950/1955, 1960/1965, 1970/1975–1979, 1993–1994, and 2005–2006. These periods are shown with thick lines, with line markers representing the number of years measured in the period. An arrow indicates the 2 compared periods with incident rate ratios (IRR) in fracture incidence with 95% confidence intervals (95% CI) presented above the arrow. aindicates statistically significant changes.
Figure 6.
Figure 6.
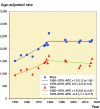
Age-adjusted fracture incidence per 105 person years in boys and girls aged 0–15 in Malmц, Sweden, during the years 1950–2016, estimated with joinpoint regression. aindicates statistically significant changes.

Similar articles

Cited by

References

    1. Anjum R, Sharma V, Jindal R, Singh T P, Rathee N. Epidemiologic pattern of paediatric supracondylar fractures of humerus in a teaching hospital of rural India: a prospective study of 263 cases. Chin J Traumatol 2017; 20(3): 158–60. - PMC - PubMed
    1. Brix N, Ernst A, Lauridsen L L B, Parner E, Stovring H, Olsen J, Henriksen T B, Ramlau-Hansen C H. Timing of puberty in boys and girls: a population-based study. Paediatr Perinat Epidemiol 2019; 33(1): 70–8. - PMC - PubMed
    1. Christoffersen T, Ahmed L A, Winther A, Nilsen O A, Furberg A S, Grimnes G, Dennison E, Center J R, Eisman J A, Emaus N. Fracture incidence rates in Norwegian children, The Tromso Study, Fit Futures. Arch Osteoporos 2016; 11(1): 40. - PubMed
    1. Cooper C, Dennison E M, Leufkens H G, Bishop N, van Staa T P. Epidemiology of childhood fractures in Britain: a study using the general practice research database. J Bone Miner Res 2004; 19(12): 1976–81. - PubMed
    1. Faulkner R A, Davison K S, Bailey D A, Mirwald R L, Baxter-Jones A D. Size-corrected BMD decreases during peak linear growth: implications for fracture incidence during adolescence. J Bone Miner Res 2006; 21(12): 1864–70. - PubMed

Publication types