. 2020 Nov 19;136(21):2442-2456.
doi: 10.1182/blood.2020005037.

Synergistic targeting of FLT3 mutations in AML via combined menin-MLL and FLT3 inhibition

Affiliations

Synergistic targeting of FLT3 mutations in AML via combined menin-MLL and FLT3 inhibition

Margarita M Dzama et al. Blood. .

Abstract

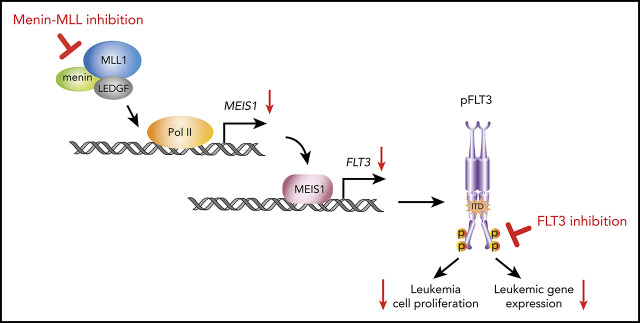
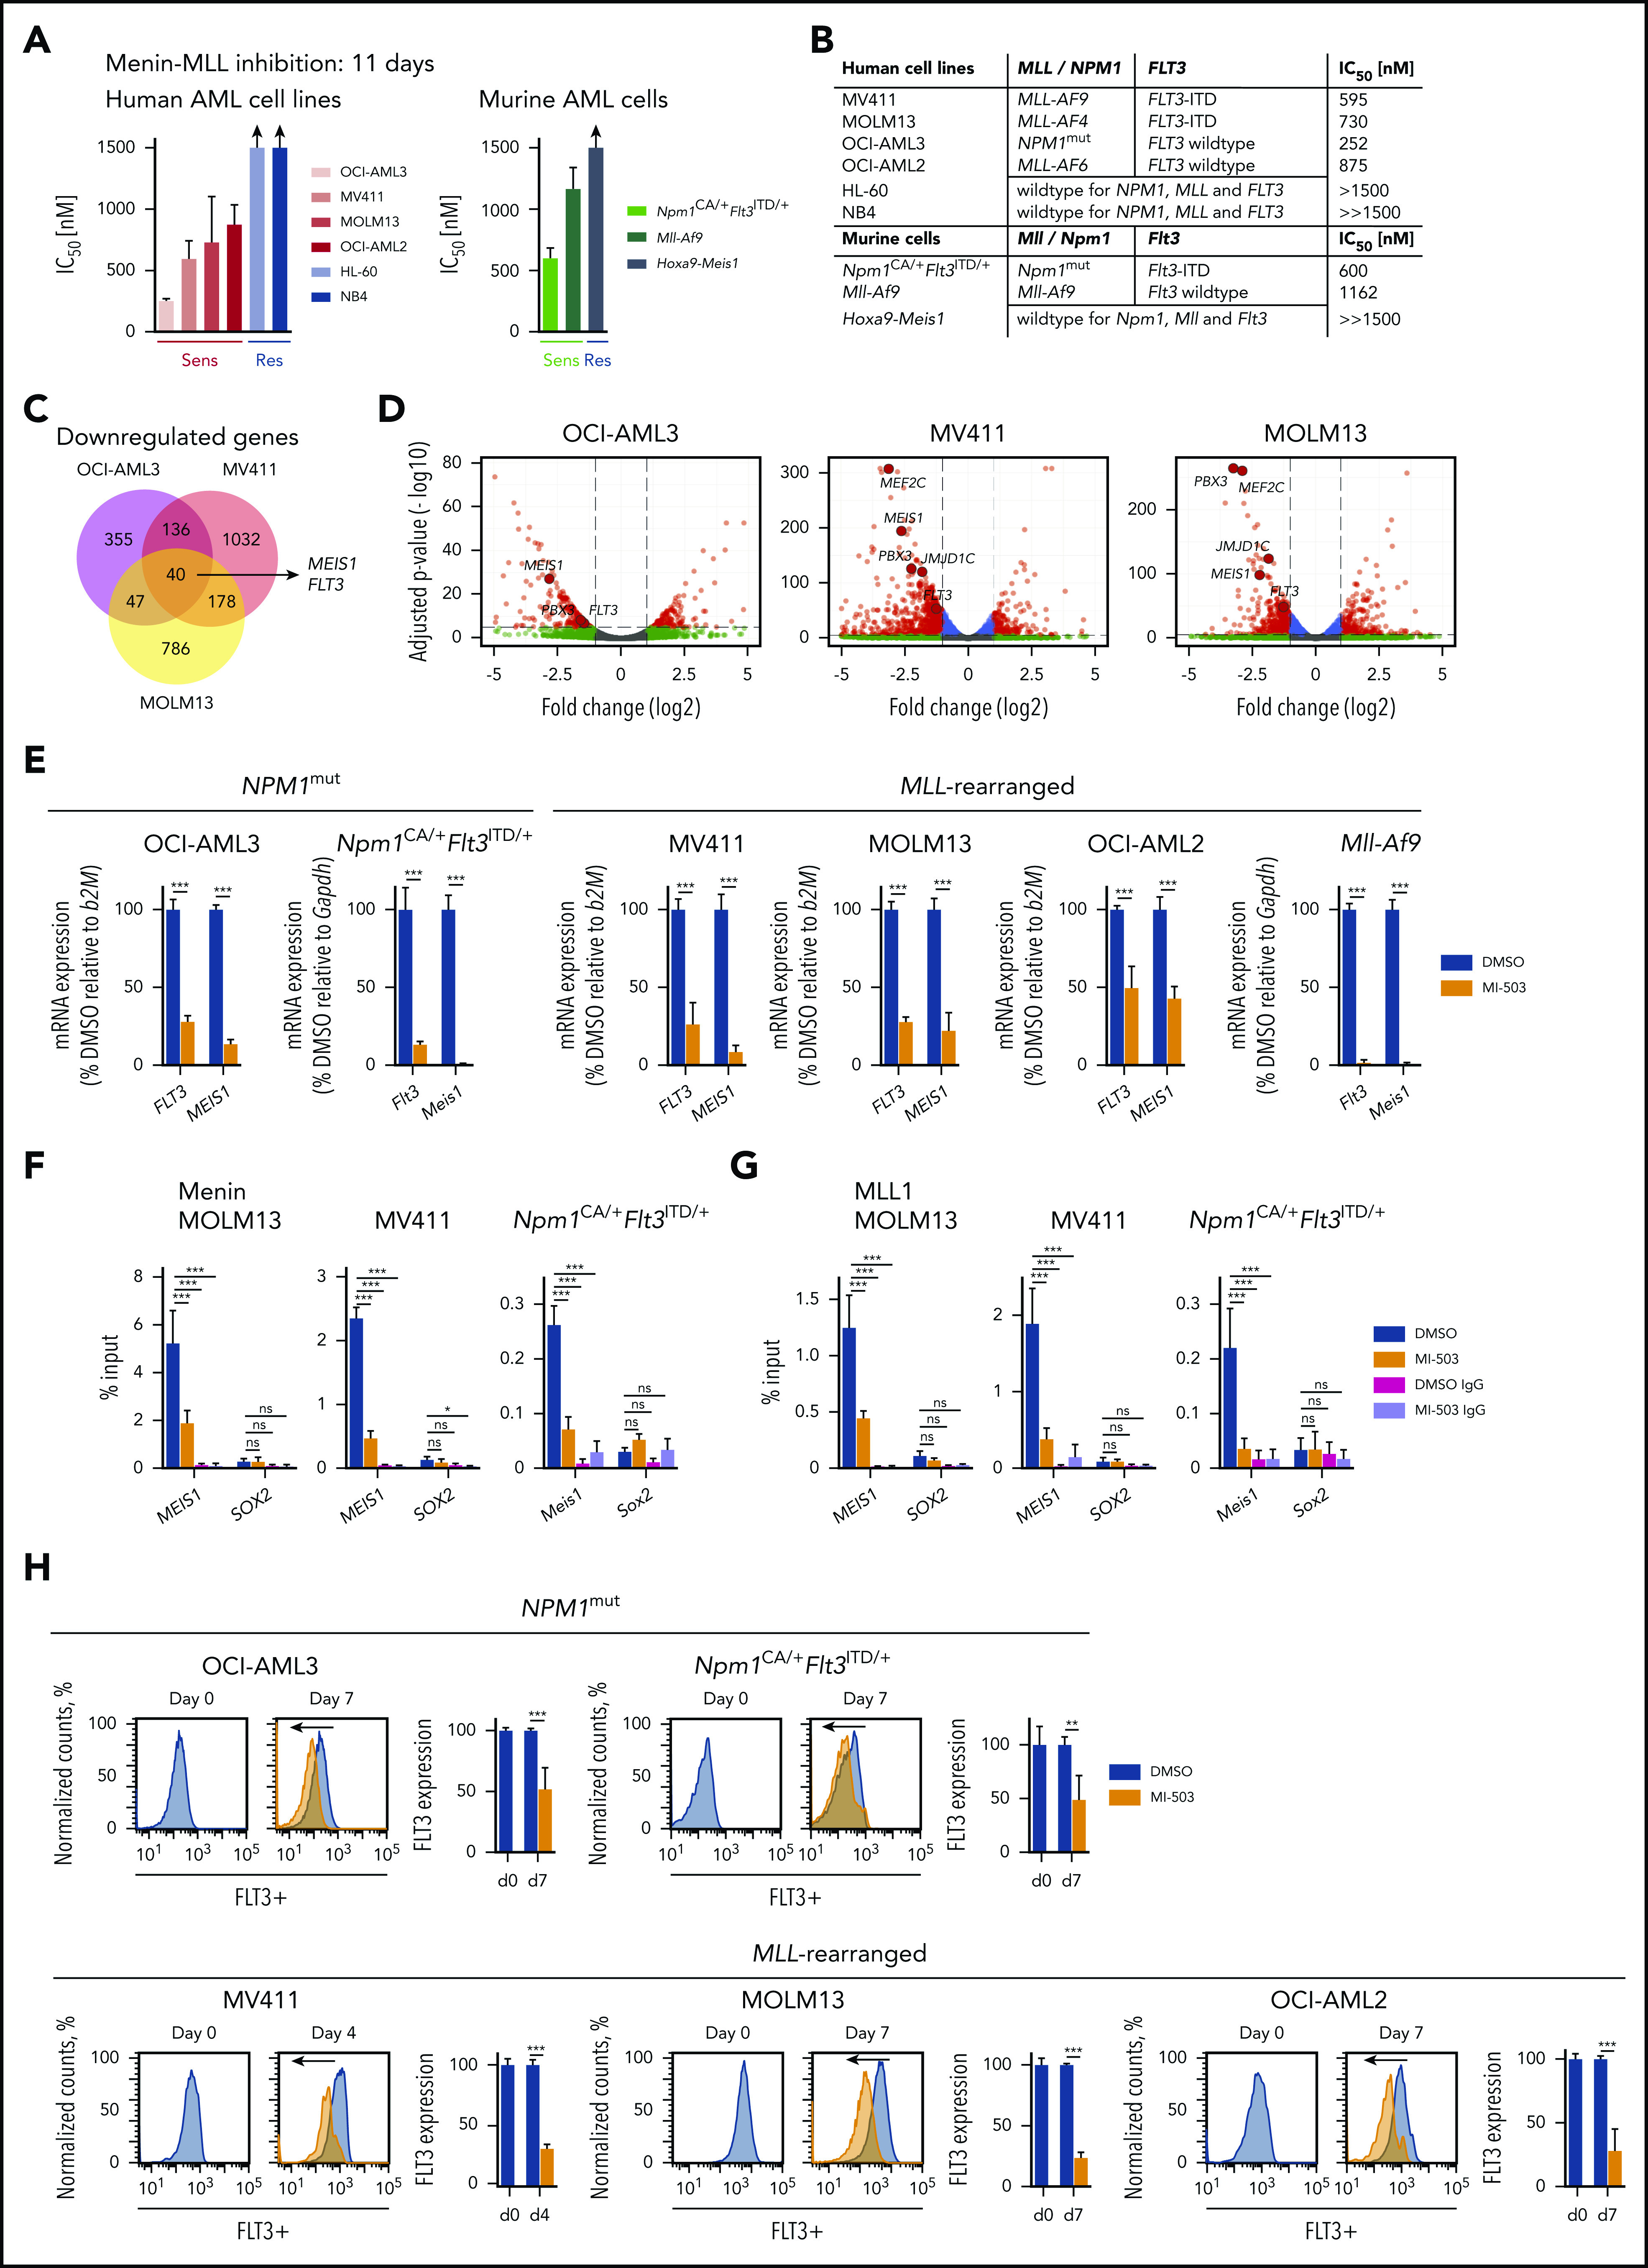
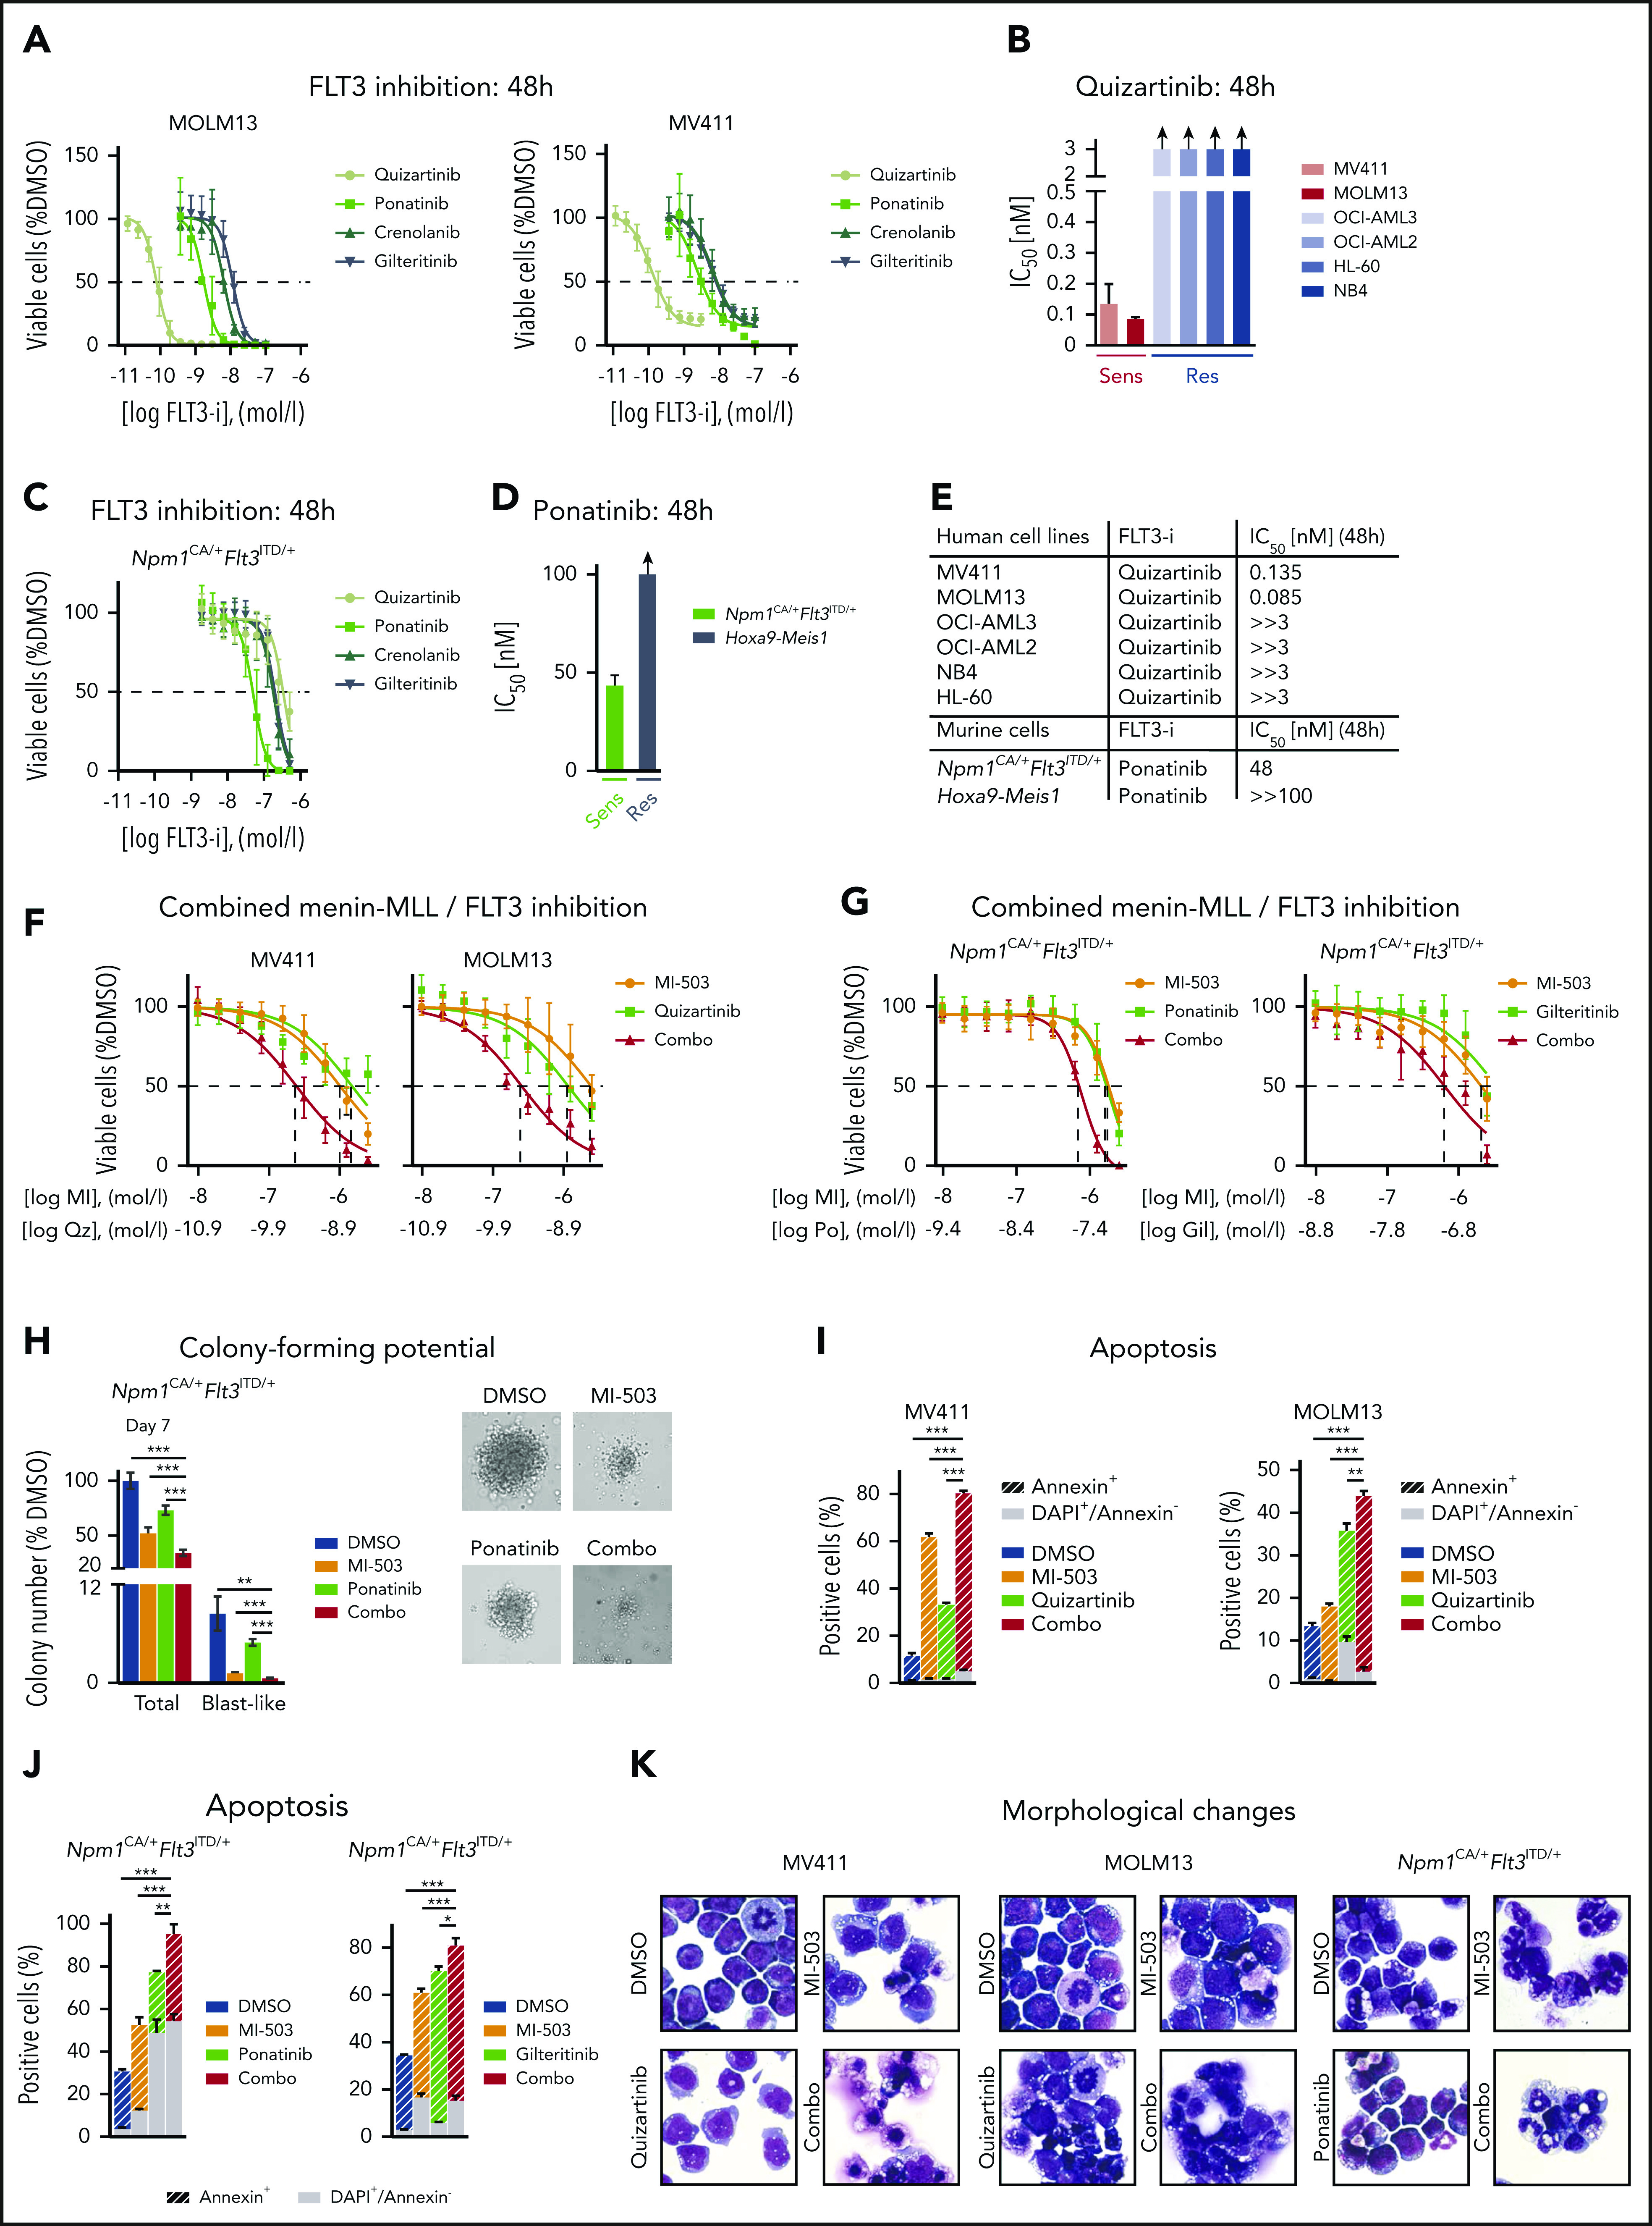
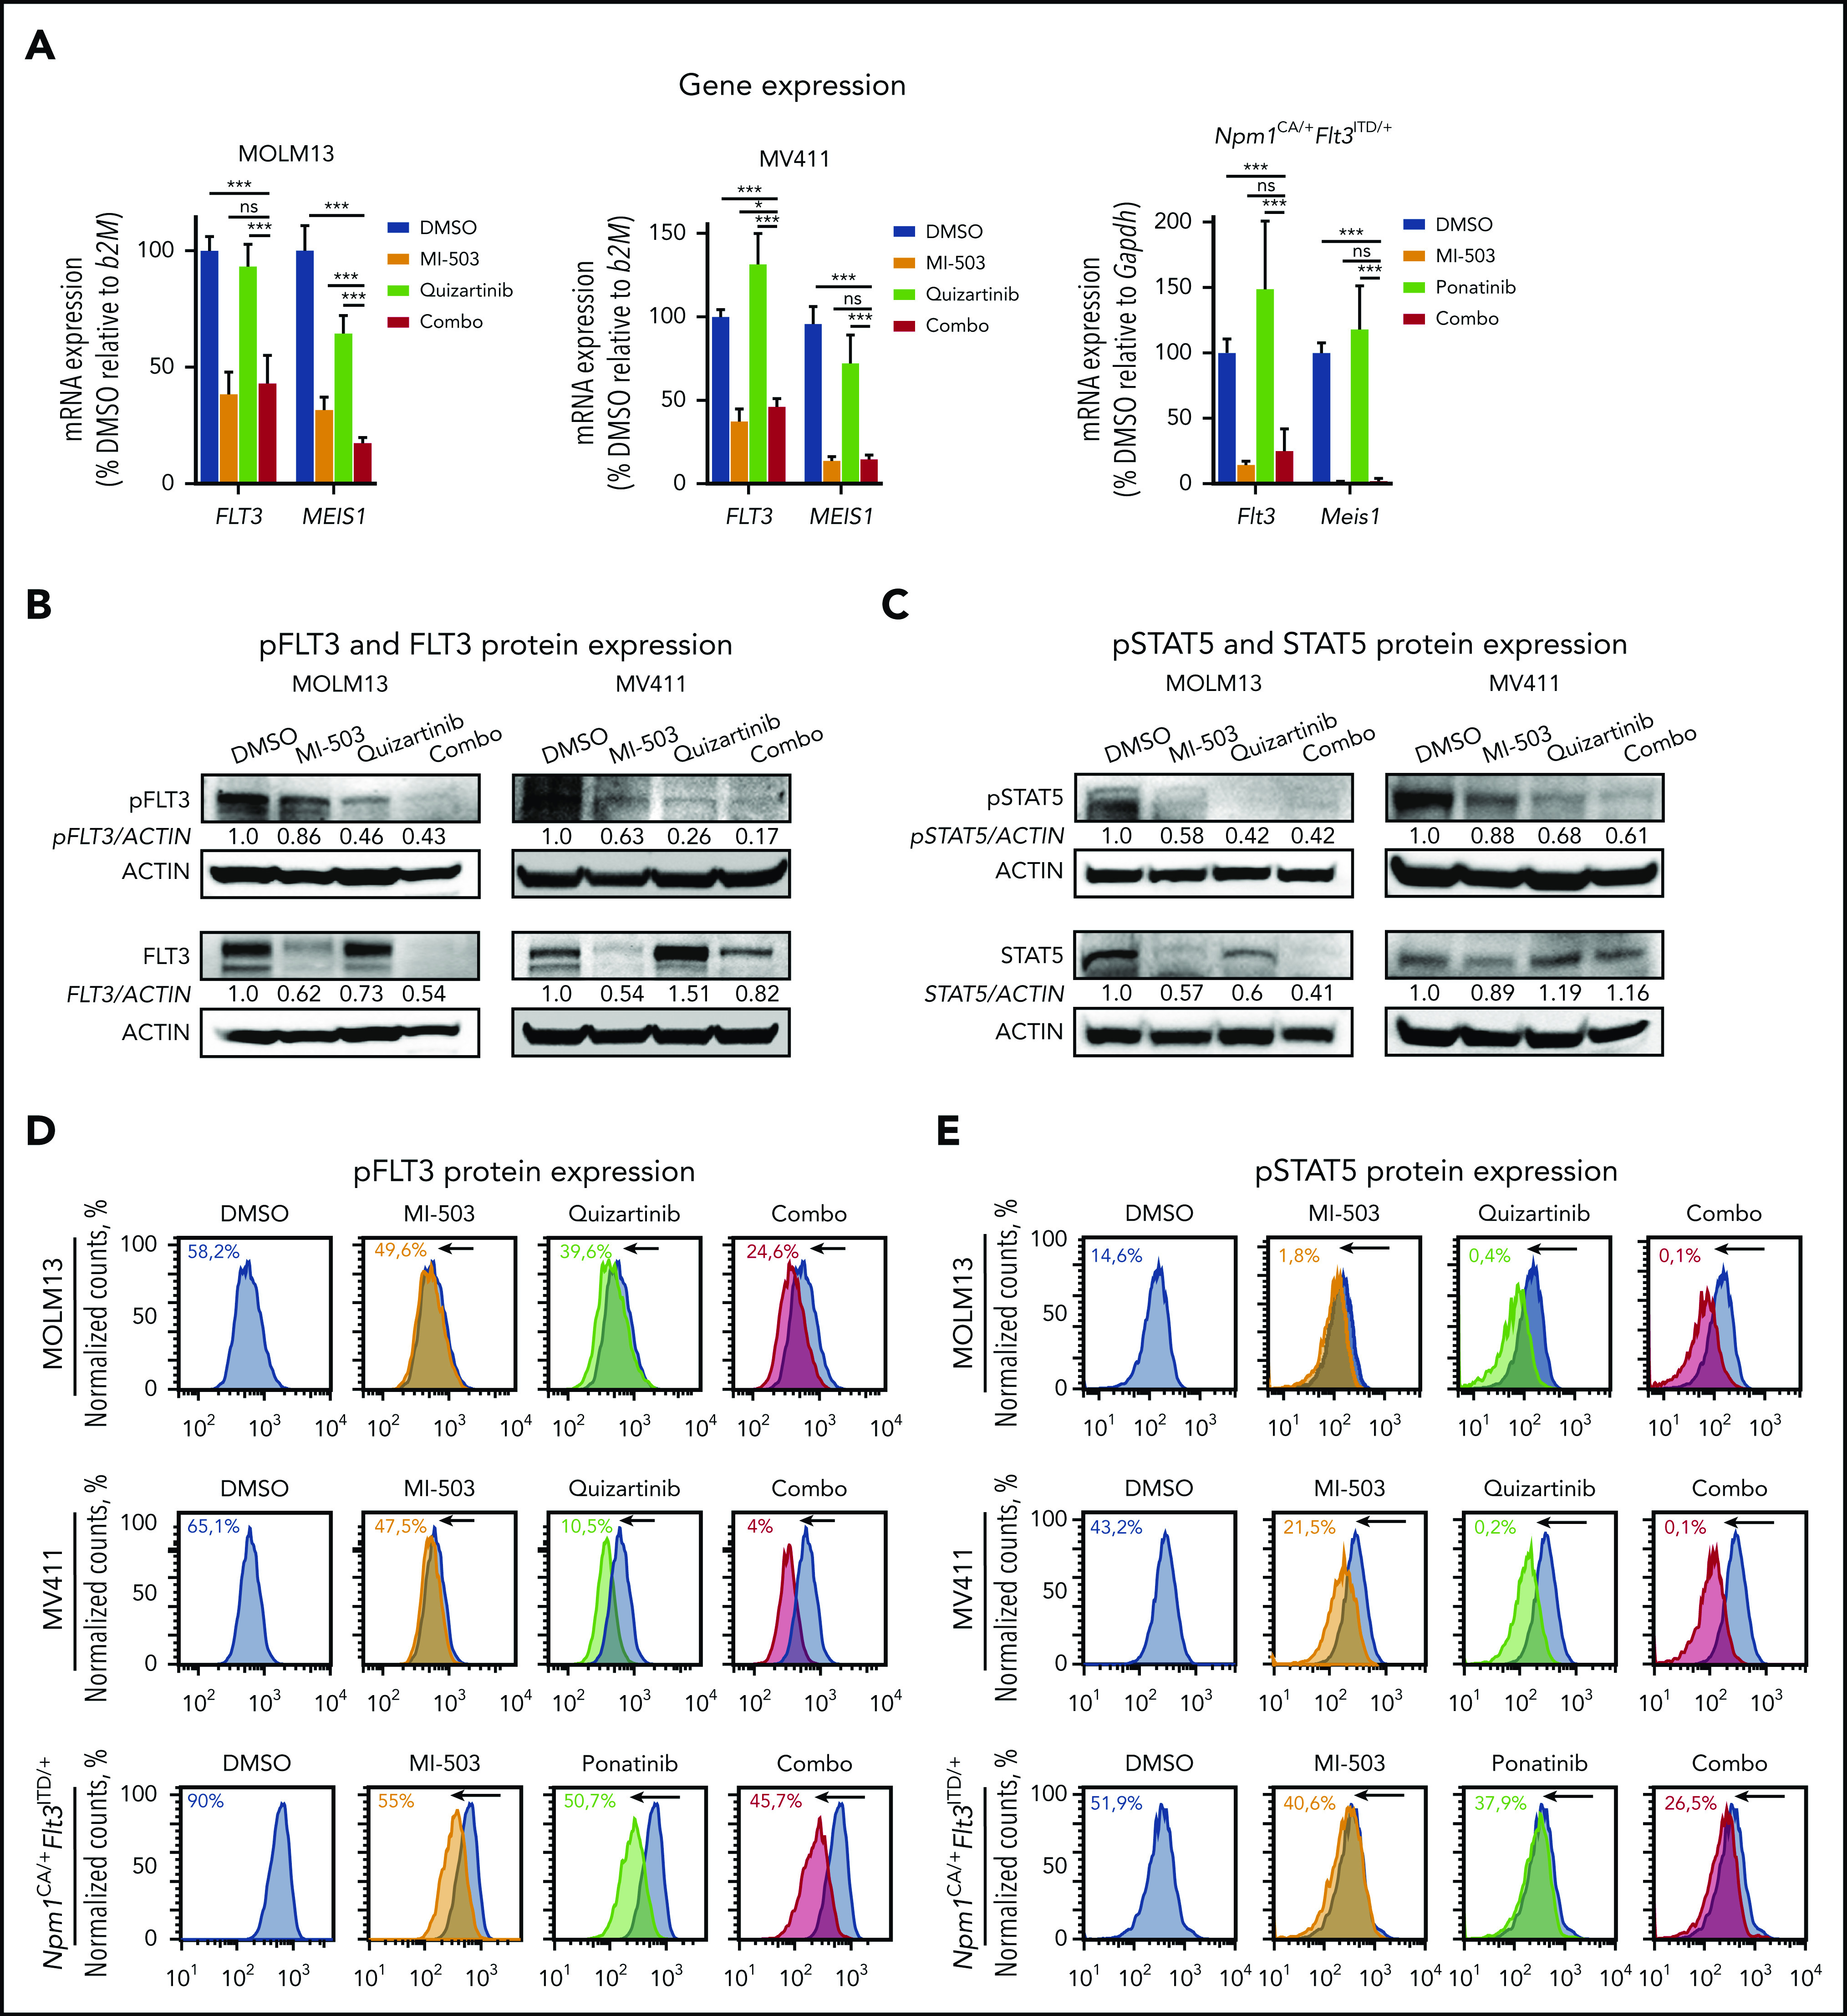
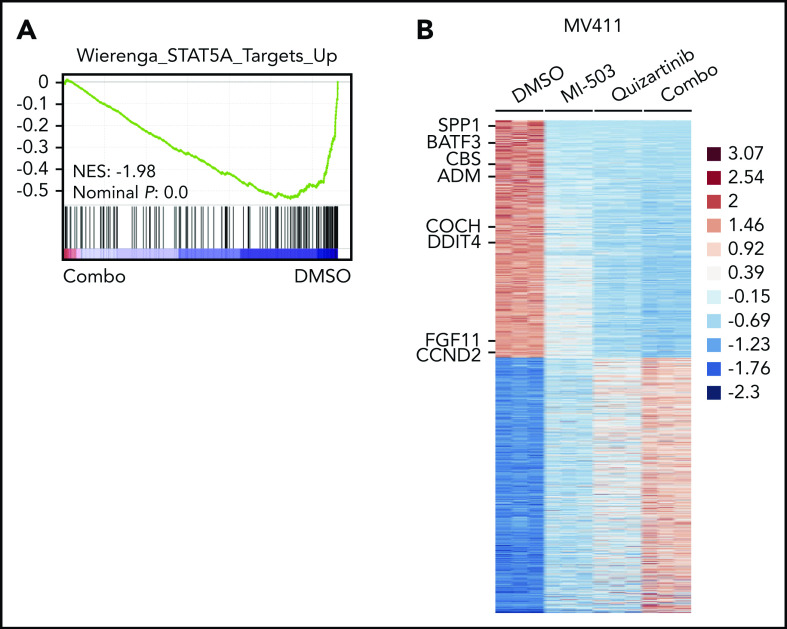
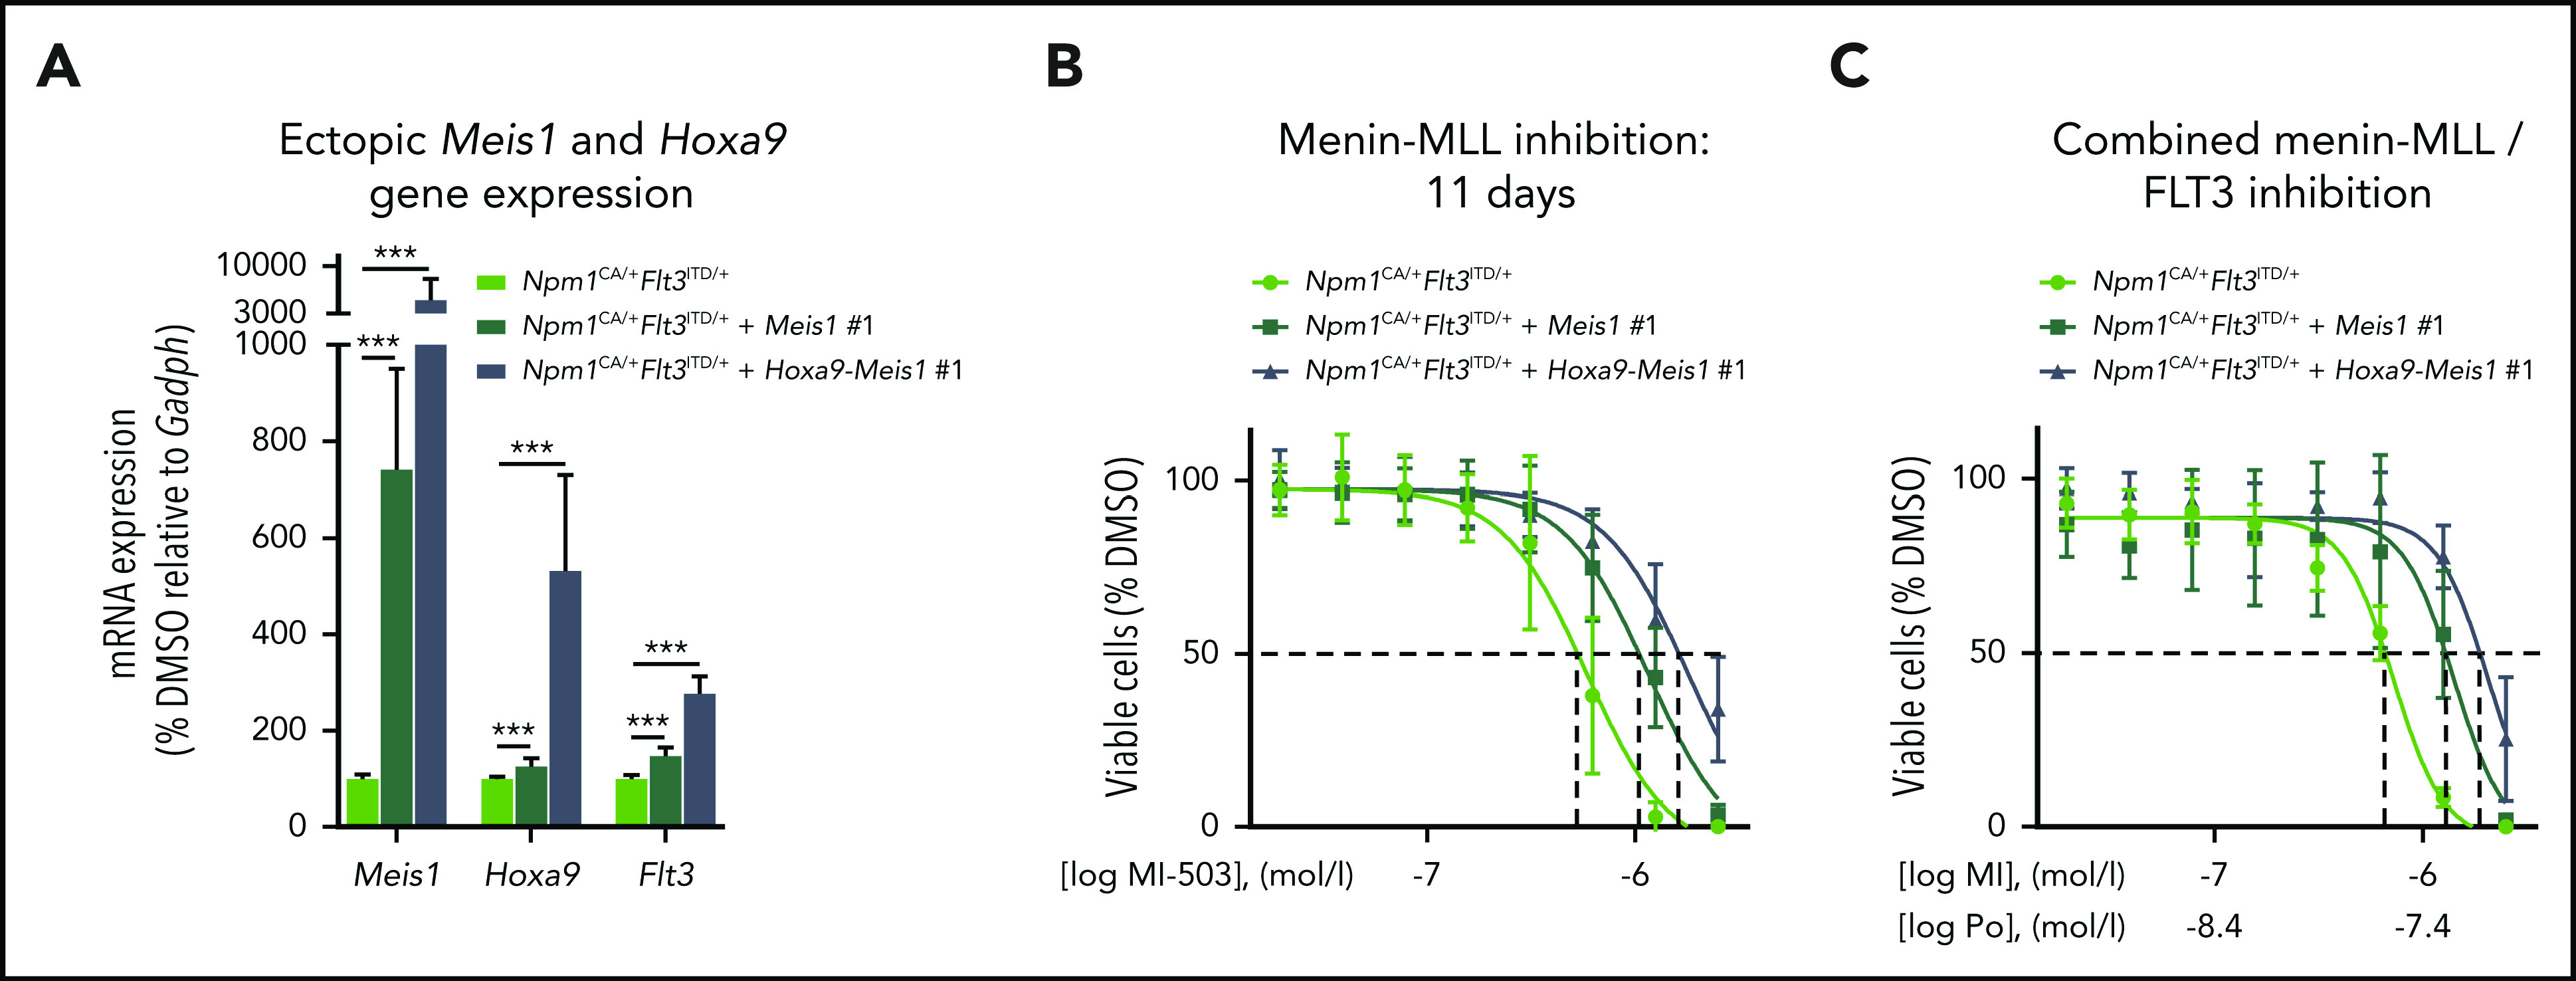
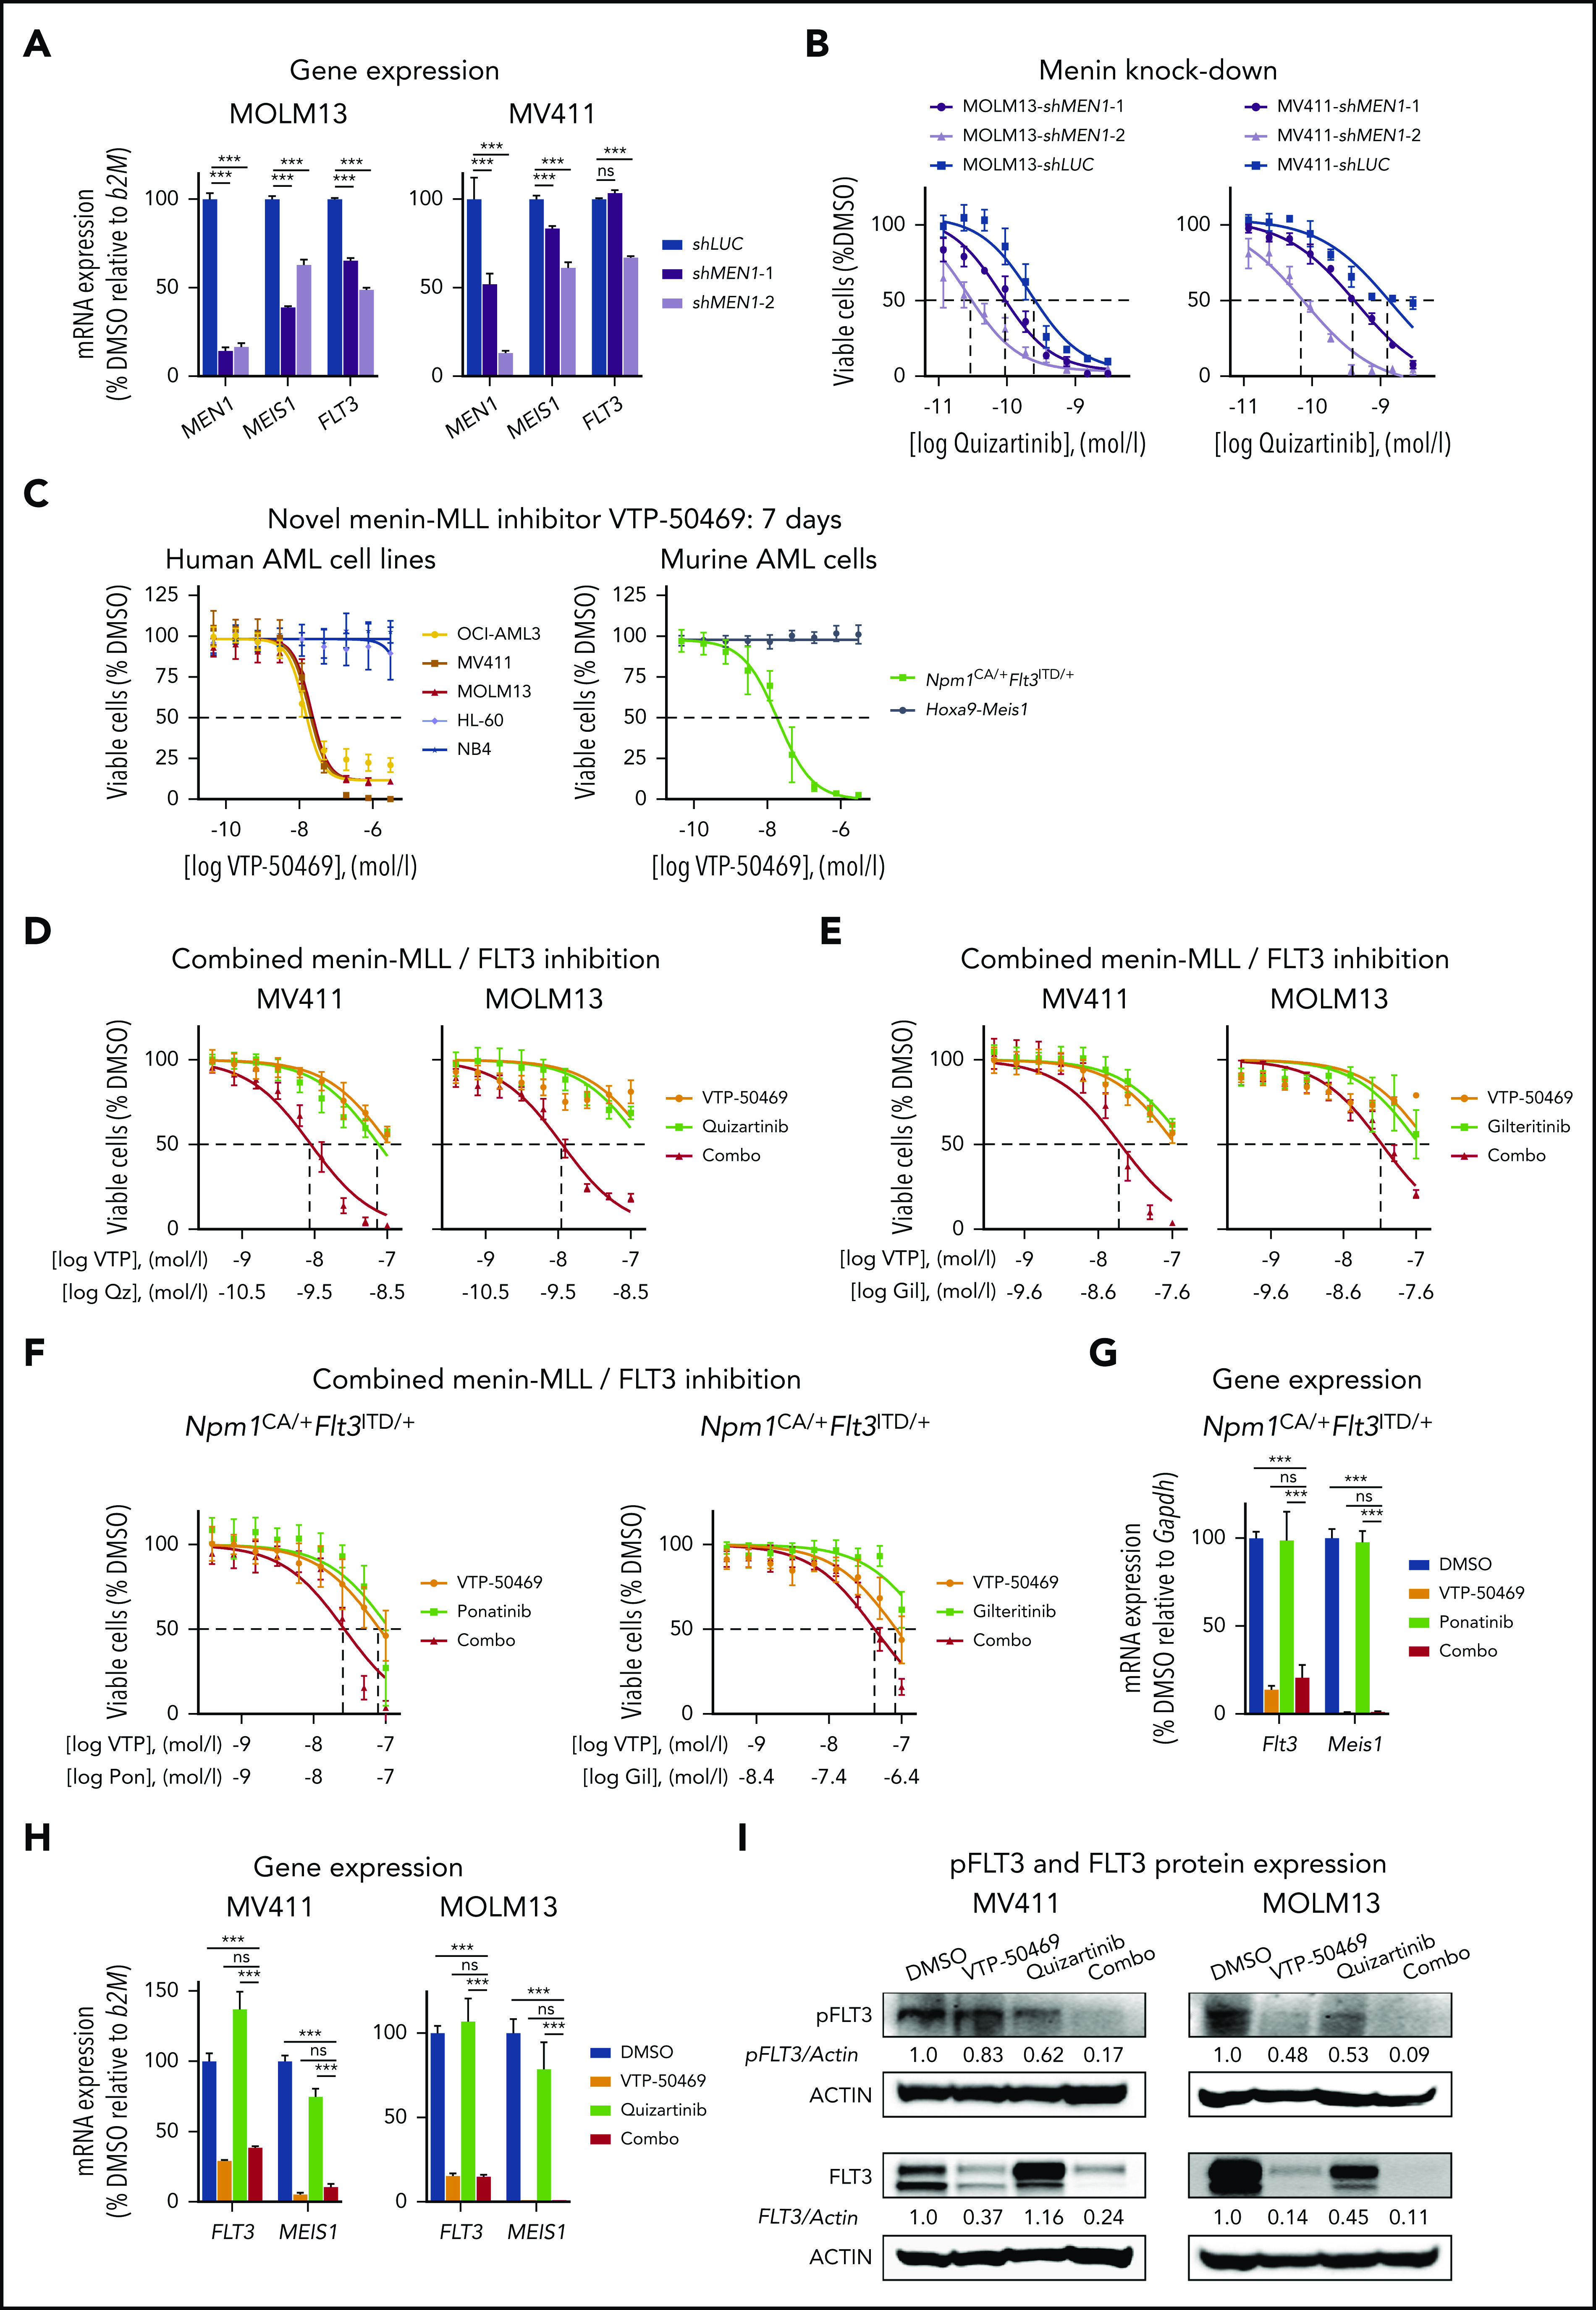
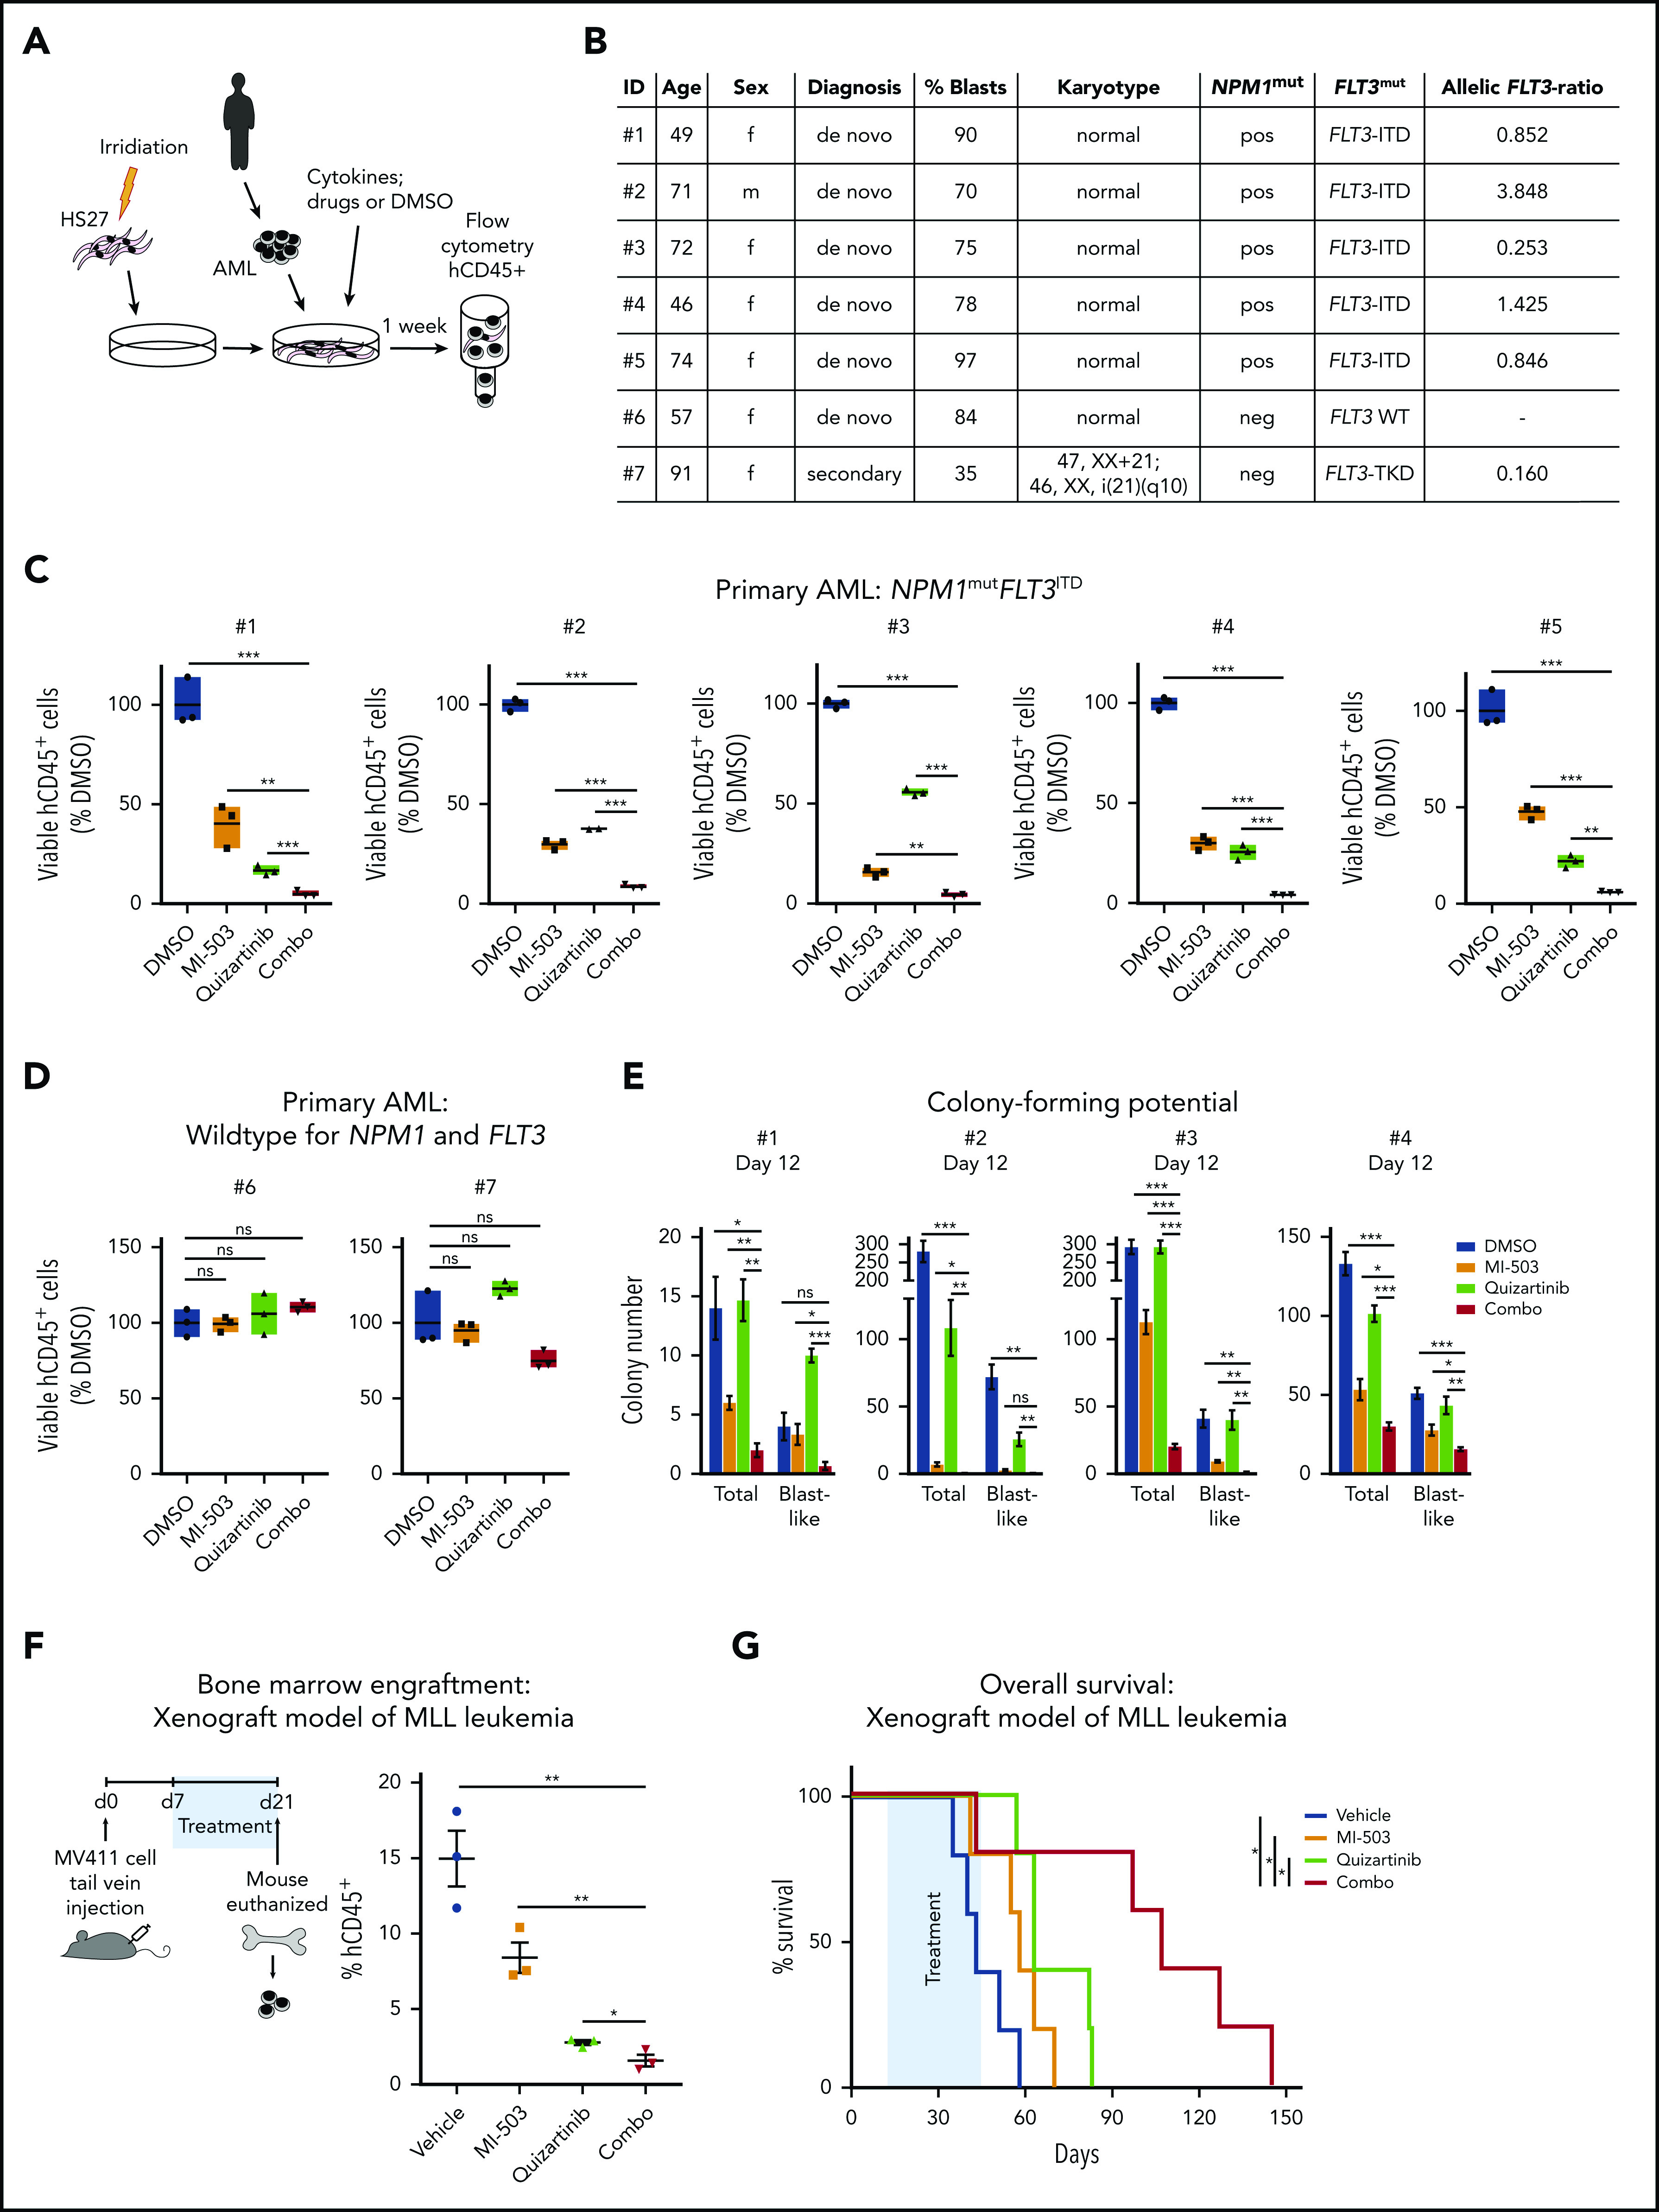
The interaction of menin (MEN1) and MLL (MLL1, KMT2A) is a dependency and provides a potential opportunity for treatment of NPM1-mutant (NPM1mut) and MLL-rearranged (MLL-r) leukemias. Concomitant activating driver mutations in the gene encoding the tyrosine kinase FLT3 occur in both leukemias and are particularly common in the NPM1mut subtype. In this study, transcriptional profiling after pharmacological inhibition of the menin-MLL complex revealed specific changes in gene expression, with downregulation of the MEIS1 transcription factor and its transcriptional target gene FLT3 being the most pronounced. Combining menin-MLL inhibition with specific small-molecule kinase inhibitors of FLT3 phosphorylation resulted in a significantly superior reduction of phosphorylated FLT3 and transcriptional suppression of genes downstream of FLT3 signaling. The drug combination induced synergistic inhibition of proliferation, as well as enhanced apoptosis, compared with single-drug treatment in models of human and murine NPM1mut and MLL-r leukemias harboring an FLT3 mutation. Primary acute myeloid leukemia (AML) cells harvested from patients with NPM1mutFLT3mut AML showed significantly better responses to combined menin and FLT3 inhibition than to single-drug or vehicle control treatment, whereas AML cells with wild-type NPM1, MLL, and FLT3 were not affected by either of the 2 drugs. In vivo treatment of leukemic animals with MLL-r FLT3mut leukemia reduced leukemia burden significantly and prolonged survival compared with results in the single-drug and vehicle control groups. Our data suggest that combined menin-MLL and FLT3 inhibition represents a novel and promising therapeutic strategy for patients with NPM1mut or MLL-r leukemia and concurrent FLT3 mutation.


Conflict of interest statement

Conflict-of-interest disclosure: M.W.M.K, is a consultant for Pfizer and Abbvie and receives travel support from Celgene and Daiichi Sankyo. S.A.A. is a consultant and/or shareholder for Epizyme Inc, Vitae/Allergan Pharmaceuticals, Imago Biosciences, Cyteir Therapeutics, C4 Therapeutics, Syros Pharmaceuticals, OxStem Oncology, Accent Therapeutics, and Mana Therapeutics and has received research support from Janssen, Novartis, and AstraZeneca. G.S.V. is a consultant for Kymab and Oxstem. G.M.M. is a shareholder of Syndax Pharmaceuticals. The remaining authors declare no competing financial interests.

Figures

None
Graphical abstract
Figure 1.
Figure 1.
Gene and protein expression changes upon menin-MLL inhibition in NPM1mut and MLL-r AML. (A) Human (left) and murine (right) AML cells were treated for 11 days with MI-503. Viable (4′,6-diamidino-2-phenylindole [DAPI]–negative) cells were assessed by flow cytometry, and IC50 values were calculated with GraphPad Prism software. (B) Summary of IC50 values (MI-503), MLL-rearrangement, and NPM1 and FLT3 mutation status in the AML cells assessed. (C) Venn diagram showing downregulated genes identified by RNA-seq (more than twofold decrease; adjusted P < .05), in NPM1mut OCI-AML3, MLL-r MOLM13, and MV411 cells after MI-503 treatment (2.5 µM) compared with the DMSO control. (D) Volcano plots of RNA-seq data obtained from OCI-AML3, MOLM13, and MV411 cells treated with MI-503 (2.5 µM). FLT3 and selected MLL-fusion targets are labeled. (E) FLT3 and MEIS1 mRNA expression in human and murine leukemia cells after 4 days of MI-503 treatment (2.5 µM), as assessed by qRT-PCR. ChIP was performed with antibodies against menin (F) or MLL1 (G) and IgG as the negative control, followed by qPCR to detect a sequence within the MEIS1 gene body or SOX2 as negative control. Cells were treated with MI-503 (2.5 µM) or vehicle control for 4 days. (H) FLT3 protein (cell surface) expression assessed by flow cytometry in human and murine NPM1mut and MLL-rearranged AML cells after MI-503 treatment (2.5 µM for 4 or 7 days, as indicated). Representative histograms of 3 independent experiments are shown. Bar graphs in panels A and E-G represent the mean of 3 independent experiments, each performed in technical triplicate. Bar graph in panel H showing Npm1CA/+Flt3ITD/+ cells represents 2 independent experiments performed in technical triplicate. Error bars represent standard deviation.
Figure 2.
Figure 2.
Synergistic effects of combined menin-MLL and FLT3 inhibition. (A) Dose-response curves from cell-viability assays after 48 hours of treatment with various FLT3 inhibitors in FLT3-ITD+ MOLM13 and MV411 cells. (B) FLT3-ITD+ and FLT3 WT human leukemia cell lines were treated with quizartinib for 48 hours. IC50 values were graphically determined by GraphPad Prism. (C) Dose-response curves from cell-viability assays after 48 hours of treatment with various FLT3 inhibitors in murine Npm1CA/+Flt3ITD/+ cells. (D) Ponatinib IC50 concentrations in murine Npm1CA/+Flt3ITD/+ and Hoxa9-Meis1–transformed cells after 48 hours of treatment. (E) Summary of FLT3 inhibitor IC50 concentrations in the human and murine leukemia cell lines assessed in this study. (F) Dose-response curves from cell-viability assays of MV411 and MOLM13 cells, comparing MI-503 (MI; 3 days for MV411 cells and 4 days for MOLM13 cells), quizartinib (Qz; 24 hours), and combinatorial MI-503 (3 or 4 days) and quizartinib (24 hours) treatment. Dashed lines indicate IC50 values. (G) Dose-response curves from cell-viability assays of Npm1CA/+Flt3ITD/+ cells comparing MI-503 (MI, 4 days), ponatinib (Po, 24 hours, left), and gilteritinib (Gil, 24 hours; right), or their combination (4 days, MI-503; 24 hours, ponatinib and gilteritinib). Dashed lines indicate IC50 values. (H) Effect of MI-503 (2.5 µM), ponatinib (100 nM), and combinatorial treatment (2.5 µM and 100 nM) on the number of total and blast-like colonies in murine Npm1CA/+Flt3ITD/+ cells, normalized to DMSO. Micrographs were taken at ×20 amplification. (I-J) Percentage of apoptotic (annexin V) and dead (4′,6-diamidino-2-phenylindole [DAPI]-stained) cells after single and combinatorial treatment with MI-503 (2.5 µM) and quizartinib (3 nM) in human cell lines (I) or MI-503 (2.5 µM) and ponatinib (100 nM) or gilteritinib (400 nM) in murine cells (J). (K) Giemsa-stained cytospins showing human MV411 and MOLM13 cells and murine Npm1CA/+Flt3ITD/+ cells after single and combinatorial treatment with MI-503 (2.5 µM; 4 days and 3 days for MV411) and FLT3 inhibitor (quizartinib, 3 nM, 24 hours; ponatinib, 100 nM, 24 hours) or their combination (day 4/24 hours and day 3/24 hours for MV411, respectively). Micrographs were taken at ×100 amplification. Error bars represent SD of 3 independent experiments, each performed in 3 technical replicates.
Figure 3.
Figure 3.
Effects of single and combined menin-MLL and FLT3 inhibition on FLT3 and phosphorylated FLT3 protein levels. (A) FLT3 and MEIS1 mRNA expression in human MOLM13 (left) and MV411 (middle) cells and murine Npm1CA/+Flt3ITD/+ (right) leukemia cells after single or combinatorial treatment with MI-503 (2.5 µM; 4 days for MOLM13 and Npm1CA/+Flt3ITD/+ cells and 3 days for MV411 cells) and FLT3 inhibitors (quizartinib, 3 nM; ponatinib, 100 nM, 24 hours) as assessed by qRT-PCR. Bar graphs represent the mean with SD of 3 independent experiments, each performed in technical triplicate. (B) Immunoblot analysis of FLT3 and phosphorylated (p)FLT3 in MOLM13 cells (left) and MV411 cells (right) upon treatment with 2.5 µM MI-503 (for 3 and 4 days in MV411 and MOLM13 cells), quizartinib (3 nM, 24 hours), or the 2 combined. One representative blot of 3 independent experiments is shown. Numbers indicate the DMSO-normalized quantification of western blot signals, relative to the loading control, performed by densitometry with ImageJ software. (C) Immunoblot analysis of STAT5 and phosphorylated (p)STAT5 in MOLM13 (left) and MV411 (right) cells after treatment as described in panel B. One representative blot of 3 independent experiments is shown. Numbers indicate the DMSO-normalized quantification of western blot signals, relative to the loading control, performed by densitometry with ImageJ software. pFLT3 (D) and pSTAT5 (E) protein expression in human MOLM13 and MV411 and murine Npm1CA/+Flt3ITD/+ cells after treatment with MI-503 (2.5 µM; 4 days for MOLM13 and Npm1CA/+Flt3ITD/+ cells; 3 days for MV411 cells), FLT3 inhibitor (quizartinib, 3 nM, and ponatinib, 100 nM; 24 hours) or their combination, as assessed by flow cytometry. One representative histogram of 3 independent experiments is shown. The colored numbers in the flow histograms indicate the percentage of pFLT3+ and pSTAT5+ cells, respectively.
Figure 4.
Figure 4.
Downregulated genes after combined menin-MLL and FLT3 inhibition are enriched for STAT5A target genes. (A) Gene set enrichment analysis of gene expression changes in MV411 cells treated with combined MI-503 (2.5 µM; 3 days) and quizartinib (3 nM; 24 hours) compared with STAT5A targets. (B) Heatmap of differentially expressed genes (log2 change >1 and < −1, and adjusted P < .05) in MV411 cells after single and combined treatment with MI-503 (2.5 µM, 3 days) and quizartinib (3 nM, 24 hours). Target genes of STAT5A are indicated.
Figure 5.
Figure 5.
Effects of ectopic Meis1 expression in murine Npm1mut Flt3-ITD+ leukemias. (A) Relative mRNA expression of Meis1, Hoxa9, and Flt3 in murine Npm1CA/+Flt3ITD/+ cells ectopically expressing Meis1 or both Meis1 and Hoxa9, normalized to cells with just endogenous Meis1 and Hoxa9 expression. (B) Dose-response curves from cell viability assays after 11 days of MI-503 treatment comparing Npm1CA/+Flt3ITD/+ cells vs Npm1CA/+Flt3ITD/+ cells overexpressing Meis1 or Meis1-Hoxa9. Dashed lines indicate the shift of IC50 values. (C) Dose-response curves from cell viability assays after combinatorial treatment with MI-503 (MI, 6 days) and ponatinib (Po; 72 hours) comparing Npm1CA/+Flt3ITD/+ cells vs Npm1CA/+Flt3ITD/+ cells overexpressing Meis1 or Meis1-Hoxa9. Dashed lines indicate the shift of IC50 values. Cells with ectopic Meis1 and Hoxa9 expression in panels A-C were each obtained from 2 different clones after retroviral transduction. Shown are the average results of 3 different experiments with clone #1, all performed in triplicate. Error bars, standard deviation.
Figure 6.
Figure 6.
Synergistic inhibition of proliferation and FLT3 activation after combined treatment with next-generation menin-MLL and FLT3 inhibitors. (A) Dose-response curves of MOLM13 and MV411 cells treated with quizartinib for 24 hours, comparing cells transduced with short hairpin RNAs against MEN1 with control-transduced cells (shLUC). (B) mRNA expression levels of MEN1, MEIS1, and FLT3 in MOLM13 and MV411 cells with MEN1 knock down or control-transduced cells, assessed 48 hours after transduction. (C) Dose-response curves from cell-viability assays after 7 days of treatment with VTP-50469 in human (left) and murine (right) leukemia cells. Viable (4′,6-diamidino-2-phenylindole [DAPI]-negative) cells were assessed by flow cytometry. (D-E) Dose-response curves from cell viability assays of MV411 and MOLM13 cells comparing VTP-50469 (VTP; 3 days for MV411 and 4 days for MOLM13 cells), quizartinib (Qz, 24 hours; D), gilteritinib (Gil, 24 hours; E), and combinatorial VTP-50469 (3 or 4 days) and FLT3 inhibition (24 hours) treatment. Dashed lines indicate IC50 values. (F) Dose-response curves from cell viability assays of Npm1CA/+Flt3ITD/+ cells comparing VTP-50469 (VTP; 6 days), ponatinib (Po, 24 hours, [left]), or gilteritinib (Gil, 24 hours; [right]) with their combination (6 days VTP50469, 24 hours FLT3 inhibition). Dashed lines indicate IC50 values. (G-H) FLT3 and MEIS1 mRNA expression in murine Npm1CA/+Flt3ITD/+ (G), human MV411 (H; left), and MOLM13 (H; right) leukemia cells after single or combined treatment with VTP-50469 (100 nM; 4 days for MOLM13 and Npm1CA/+Flt3ITD/+ cells and 3 days for MV411 cells) and FLT3 inhibitors (quizartinib, 3 nM and ponatinib, 100 nM; 24 hours) as assessed by qRT-PCR. Bar graphs represent the mean with standard deviation of 3 independent experiments, each performed in technical triplicate. (I) Immunoblot analysis of FLT3 and phosphorylated (p)FLT3 in MV411 cells (left) and MOLM13 cells (right) after treatment with VTP-50469 (100 nM; 3 and 4 days in MV411 and MOLM-13, respectively) and quizartinib (3 nM, 24 hours), or their combination. Numbers indicate the DMSO-normalized quantification of western blot signals, relative to the loading control, performed by densitometry using the ImageJ software tool.
Figure 7.
Figure 7.
Effects of single and combined menin-MLL and FLT3 inhibition on primary NPM1mut FLT3ITD AML patient samples and on survival of in vivo–treated MLL-r FLT3-ITD leukemic xenograft mice. (A) The human stromal cell coculture assay, performed to maintain and treat patients’ primary AML blasts. (B) Summary of characteristics of patients providing the samples used in panels C-E. (C-D) Number of viable cells inde novoAML samples treated in coculture for 7 days with DMSO, MI-503 (2 µM), quizartinib (6 nM), or combinatorial MI-503 and quizartinib treatment. (C) Five independent samples of de novo NPM1mutFLT3ITD AML. (D) Two independent samples of de novo AML, WT for NPM1, FLT3, and MLL. Depicted are 4′,6-diamidino-2-phenylindole [DAPI], human CD45+ cell numbers as assessed by flow cytometry. (E) Effect of MI-503 (2.5 µM), quizartinib (3 nM), and combinatorial treatment (2.5 µM and 3 nM) on total and blast-like CFUs in primary patient sample cells. (F) Experimental setup for the treatment of MV411-derived leukemic xenograft mice (left); percentage of human CD45+ cells in the bone marrow of leukemic mice (right) after treatment with drug vehicles, MI-503 (50 mg/kg; twice daily IP), quizartinib (10 mg/kg; PO; once daily), or combined MI-503 and quizartinib. (G) Kaplan-Meier survival analysis of MV411-derived leukemic xenograft mice treated with drug vehicles, MI-503 (50 mg/kg; twice daily IP), quizartinib (10 mg/kg; PO; once daily), or combinatorial MI-503 and quizartinib (n = 5 mice/group). The treatment period is displayed in blue. The log-rank (Mantel-Cox) test was used to calculate the P-values.

Comment in

Similar articles

Cited by

References

    1. Arber DA, Orazi A, Hasserjian R, et al. The 2016 revision to the World Health Organization classification of myeloid neoplasms and acute leukemia. Blood. 2016;127(20):2391-2405. - PubMed
    1. Döhner H, Weisdorf DJ, Bloomfield CD. Acute Myeloid Leukemia. N Engl J Med. 2015;373(12):1136-1152. - PubMed
    1. Papaemmanuil E, Gerstung M, Bullinger L, et al. Genomic Classification and Prognosis in Acute Myeloid Leukemia. N Engl J Med. 2016;374(23):2209-2221. - PMC - PubMed
    1. Tyner JW, Tognon CE, Bottomly D, et al. Functional genomic landscape of acute myeloid leukaemia. Nature. 2018;562(7728):526-531. - PMC - PubMed
    1. Ley TJ, Miller C, Ding L, et al; Cancer Genome Atlas Research Network . Genomic and epigenomic landscapes of adult de novo acute myeloid leukemia [published correction appears in N Engl J Med. 2013;369(1):98]. N Engl J Med. 2013;368(22):2059-2074. - PMC - PubMed

Publication types

MeSH terms