. 2020 Sep 9;107(5):874-890.e8.
doi: 10.1016/j.neuron.2020.06.008. Epub 2020 Jun 25.

An Activity-Mediated Transition in Transcription in Early Postnatal Neurons

Affiliations

An Activity-Mediated Transition in Transcription in Early Postnatal Neurons

Hume Stroud et al. Neuron. .

Abstract

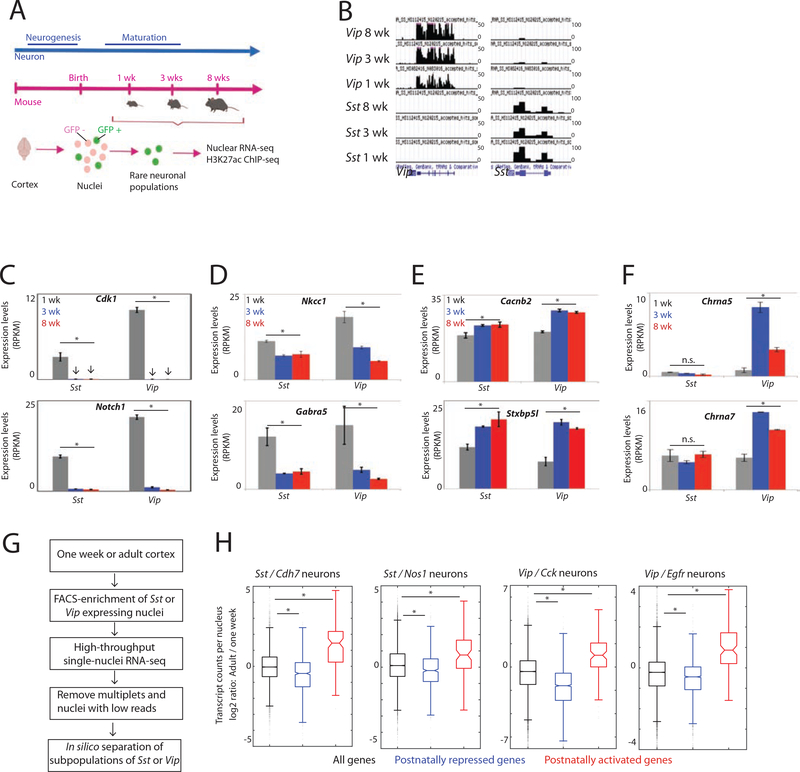
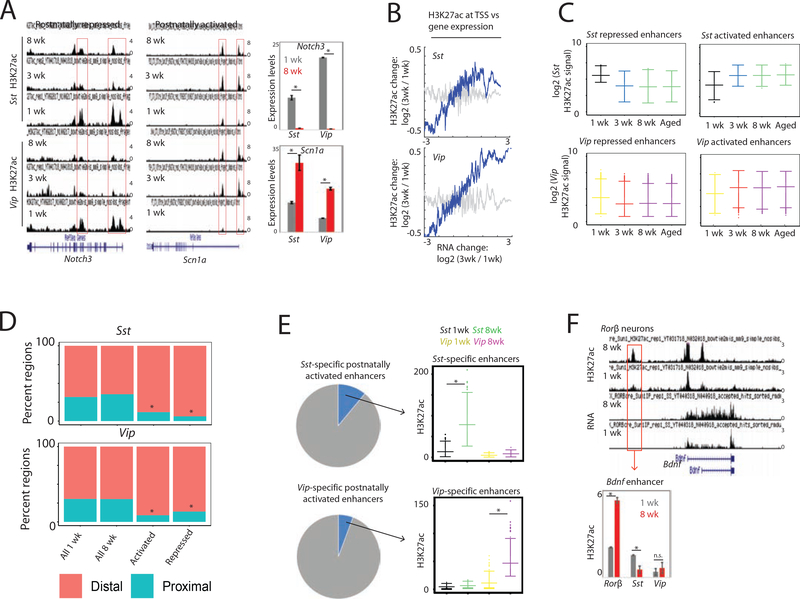
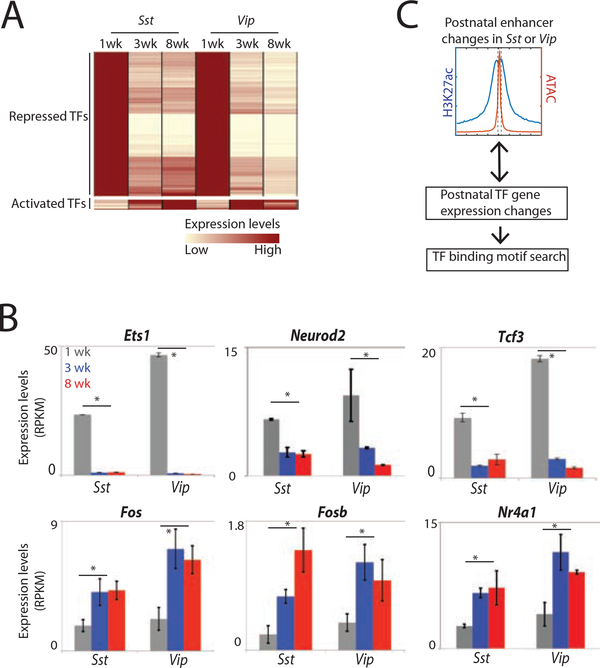
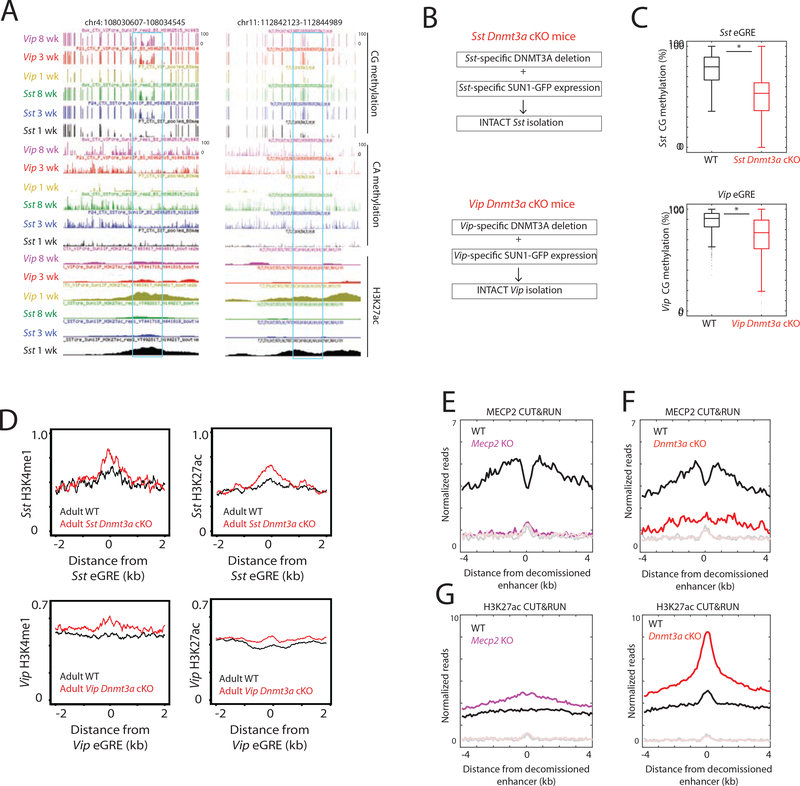
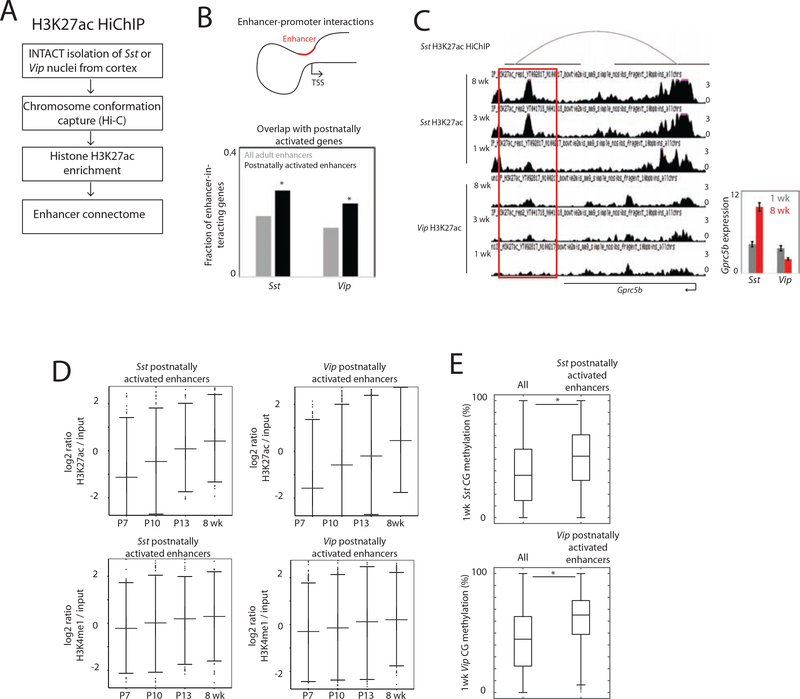
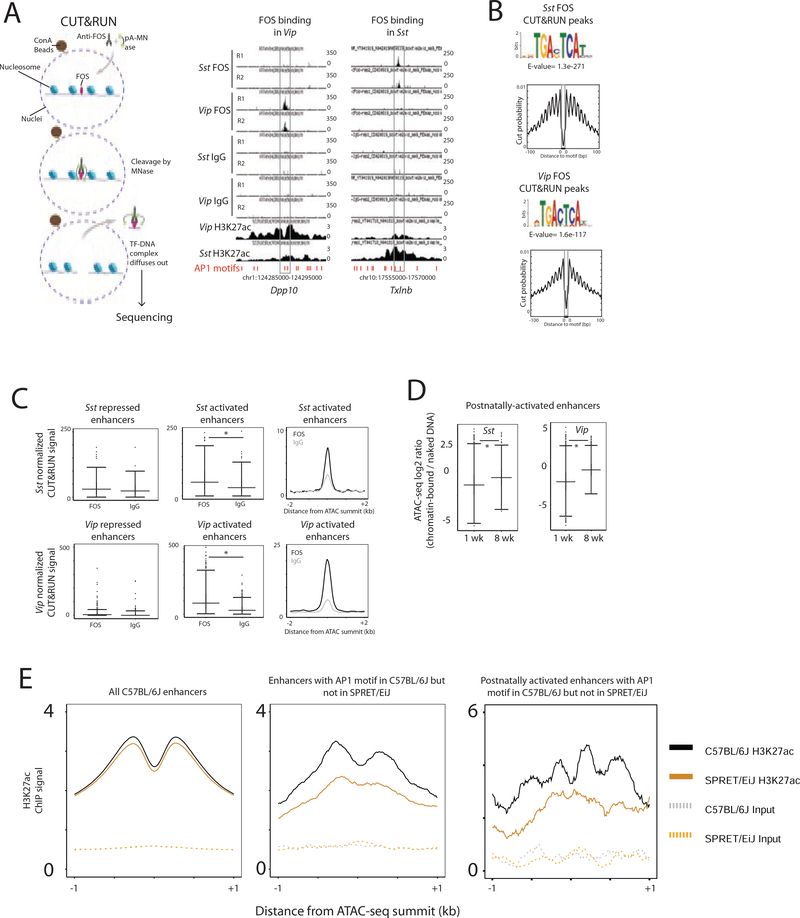
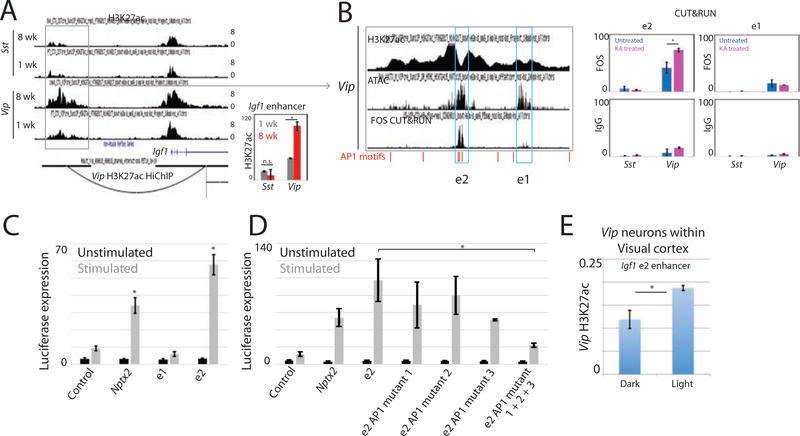
The maturation of the mammalian brain occurs after birth, and this stage of neuronal development is frequently impaired in neurological disorders, such as autism and schizophrenia. However, the mechanisms that regulate postnatal brain maturation are poorly defined. By purifying neuronal subpopulations across brain development in mice, we identify a postnatal switch in the transcriptional regulatory circuits that operates in the maturing mammalian brain. We show that this developmental transition includes the formation of hundreds of cell-type-specific neuronal enhancers that appear to be modulated by neuronal activity. Once selected, these enhancers are active throughout adulthood, suggesting that their formation in early life shapes neuronal identity and regulates mature brain function.


Conflict of interest statement

Declaration of Interests The authors declare no competing interests.

Figures

Figure 1.
Figure 1.. Dynamic changes in neuronal gene expression programs within early postnatal brains.
(A) An overview of the experimental design. (B) Genome browser views confirming specific enrichment of Sst and Vip transcripts in INTACT-isolated Sst-and Vip-expressing nuclei, respectively. The y-axis units represent reads per kilobase per million mapping reads (RPKM). At the bottom of the panel the exon (boxes) intron (lines) structure of the Sst and Vip genes are shown. (C) Normalized expression levels of representative genes that are postnatally repressed encoding proteins involved in embryogenesis. Error bars represent s.d. between biological replicates. *FDR<1e-4, DEseq2. (D) Normalized expression levels of representative genes that are postnatally repressed encoding co-transporters and receptors. *FDR<1e-4, DEseq2. (E) Normalized expression levels of representative genes that are postnatally activated encoding proteins involved in synaptic function. *FDR<1e-4, DEseq2. (F) Normalized expression levels of representative genes that are selectively postnatally activated in Vip neurons but not in Sst neurons. *FDR<1e-4, DEseq2. (G) Scheme of the experimental design for high throughput single-nuclei RNA sequencing of FACS-sorted Sst- or Vip-expressing nuclei (H) Postnatal regulation of gene expression in neurons is a shared feature across subpopulations of Sst and Vip neurons. The normalized mean transcript counts per nucleus in different subpopulations of Sst of Vip neurons were calculated across all genes (black bars), postnatally repressed genes (defined by INTACT RNA-seq, blue bars) and postnatally activated genes (defined by INTACT RNA-seq, red bars). Sst subpopulations expressing Cdh7 or Nos1, and Vip subpopulations expressing Cck or Egfr are shown. Genes that were unexpressed in either of the developmental timepoints were excluded from the analysis. *P<1e-5, Wilcoxon rank sum test.
Figure 2.
Figure 2.. Dynamic gene-distal enhancers reflect early postnatal changes in transcription profiles.
(A) Genome browser views of H3K27ac patterns in Sst and Vip neurons. H3K27ac patterns across a postnatally repressed gene (Notch3) (left) and an activated gene (Scn1a) (right) are shown. The gene expression levels of the two genes are also shown. Error bars represent s.d. between biological replicates. *FDR<1e-4, DEseq2. (B) Genome-wide correlation between postnatal changes in gene expression and postnatal changes in H3K27ac at TSS. The average postnatal changes (between one week and three weeks) in H3K27ac read densities within 500 bp of annotated TSS were binned according to the postnatal changes in gene expression levels (200 genes per bin). H3K27ac levels after random grouping of genes are shown as controls in faded gray lines. P<0.001, permutation test. (C) Most postnatal changes in H3K27ac occur by three weeks after birth in both Sst and Vip neurons. Genomic regions that significantly change in H3K27ac levels between one week and adult (eight week) were defined (+/− 500 bp of ATAC-seq summit, see Methods), and densities of H3K27ac at one week, three weeks, eight weeks and aged (~20 months) were plotted. (D) Most postnatal changes in H3K27ac occur at gene-distal sites. Proportion of H3K27ac regions proximal to promoters or distal to genes (i.e. greater than one kb away from nearest annotated TSS) are shown. *P<1e-4, hypergeometric distribution. (E) A subset of enhancers is selectively activated postnatally in either Sst (n = 91) or Vip (n = 116). Enhancers that were significantly activated in Sst but not Vip, and vice versa were defined. *P<1e-7, Wilcoxon rank sum test. (F) A postnatally activated enhancer in Rorβ neurons upstream of the Bdnf gene. Genome-browser views of gene expression and H3K27ac signal, as well as quantifications of H3K27ac within the distal Bdnf enhancer in Rorβ, Sst and Vip neurons are shown. *P<0.05, two-tailed t-test.
Figure 3.
Figure 3.. Putative regulatory TFs control the postnatal switch in transcription programs.
(A) Identification of TFs that change in gene expression during maturation. Gene expression heatmaps of TFs that postnatally decrease in expression in either Sst or Vip (top, n=200) or increase in expression in either Sst or Vip neurons (bottom, n=15) during maturation are shown (>two-fold, FDR<1e-4 cutoff). The expression level of a given gene was normalized to the highest value across the indicated time-course. (B) Representative examples of TFs that are postnatally repressed or activated. *FDR<1e-4, DEseq2. Error bars represent s.d. between biological replicates. (C) Approach for identifying regulatory TFs controlling postnatally repressed or activated enhancers.
Figure 4.
Figure 4.. De novo methylation-mediated enhancer decommissioning.
(A) Genome-browser views of base-resolution DNA methylation data across two gene-distal postnatally repressed enhancers. (B) Cell type-specific DNMT3A deletion and analysis. In Sst-specific Dnmt3a cKO mice, both DNMT3A deletion and SUN1-GFP expression selectively occurs in Sst neurons. In Vip-specific Dnmt3a cKO mice, both DNMT3A deletion and SUN1 -GFP expression selectively occurred in Vip neurons. This strategy enabled INTACT-purification of Sst or Vip expressing nuclei for further analyses. (C) DNMT3A mediates the postnatal CG methylation at eGREs. Adult CG methylation was quantified within eGREs in Sst and Vip neurons. Dnmt3a KO Sst neurons from Sstspecific Dnmt3a cKO mice were compared to wild type Sst neurons from littermate wild type mice. Dnmt3a KO Vip neurons from Vip-specific Dnmt3a cKO mice were compared to wild type Vip neurons from littermate wild type mice. *P<1 e-18, Wilcoxon rank sum test. (D) Increase in enhancer activity of eGREs is observed in adult Sst Dnmt3a KO (top) or Vip Dnmt3a KO (bottom) neurons compared to wild type. The average distribution of H3K4me1 and H3K27ac in adult (> eight weeks) wild type or Dnmt3a KO neurons across eGREs were plotted. (E) MECP2 binding is enriched across eGREs in whole cortex. Average MECP2 CUT&RUN read distribution in adult wild type and Mecp2 KO cortices across eGREs that normally gain methylation postnatally (shown in Figure S4F) were plotted. Faded lines represent respective IgG controls. (F) MECP2 binding across eGREs is reduced upon deletion of DNMT3A. Average MECP2 CUT&RUN read distribution in wild type and Dnmt3a cKO cortices across eGREs. Faded lines represent respective IgG controls. (G) Enhancer activity increases in eGREs in adult Mecp2 or Dnmt3a cKO cortices. Average H3K27ac CUT&RUN read distribution across GREs in wild type and Mecp2 KO (left) or Dnmt3a cKO cortices (right) across eGREs. Faded lines represent respective IgG controls. Note that the IgG controls shown here are the same as those in (E) and (F).
Figure 5.
Figure 5.. Formation of de novo enhancers that promote the postnatal switch.
(A) Workflow of using in situ chromatin conformation HiChIP analysis to determine enhancer connectomes in Sst and Vip neurons in vivo. (B) Postnatally activated enhancers significantly interact with genes that increase in expression levels postnatally. Gene-distal enhancers (i.e. at least one kilobase away from nearest annotated TSS) were linked to genes they interact with at the TSS (i.e. TSS+/−500 bp). *P<0.01, hypergeometric distribution. (C) A postnatally Sst-specific activated enhancer downstream of the Gprc5b gene that physically interacts with the TSS. The gene expression levels of Gprc5b are also shown. Error bars represent s.d. between biological replicates. (D) Co-acquisition of H3K4me1 and H3K27ac marks during the postnatal period. H3K4me1 and H3K27ac levels were quantified within postnatally activated enhancers that lack H3K27ac at P7 (i.e. are inactive at P7). (E) Prior to activation, postnatally activated enhancers tend to be marked by CG methylation. Methylation levels at P7 were quantified across GREs within all enhancers and postnatally activated enhancers. *P<1e-41, Wilcoxon rank sum test.
Figure 6.
Figure 6.. The transcription factor FOS regulates postnatally-activated enhancers.
(A) Scheme of FOS CUT&RUN. Figure adapted from (Skene and Henikoff, 2017) (left). On the right are genome browser views of FOS CUT&RUN data showing neuronal subtype-specific FOS binding sites at gene-distal genomic sites downstream of Dpp10 (left) and Txlnb (right) genes. Two biological replicates of data are shown (R1 and R2). (B) Footprints within FOS CUT&RUN peaks are enriched in AP1 binding motifs. AP1 binding motifs were the most significantly enriched motif within the footprints using cutruntools (Zhu et al., 2019), and distribution of nuclease cut probabilities surrounding the AP1 motifs are shown. The 10bp periodicity flanking may reflect nucleosomes flanking the FOS binding sites, exposing DNA to MNase digestion every 10 bp. (C) FOS is bound across postnatally activated enhancers. FOS CUT&RUN reads were quantified within postnatally repressed or activated enhancers (left and middle). The average distribution of FOS binding across the GREs within the postnatally activated enhancers are also shown (right). *P<1e-9, Wilcoxon rank sum test. (D) Postnatal increase in chromatin accessibility within postnatally activated enhancers. ATAC-seq read densities in Sst or Vip neurons were quantified within the regulatory regions of postnatally activated enhancers at postnatal one week and eight weeks. The ratio of ATAC-seq read densities to genomic DNA transposed by the Tn5 transposase were plotted (See Methods). *P<1e-3, Wilcoxon rank sum test. (E) Mutations in AP1 motifs are associated with decreased enhancer activity in Sst neurons. The distribution of H3K27ac in C57BL/6J and SPRET/EiJ alleles in Sst neurons of F1 hybrid mice were analyzed. H3K27ac and input DNA patterns were quantified across all C57BL/6J enhancers (left), all enhancers with intact AP1 motif in C57BL/6J that are mutated in SPRET/EiJ, and postnatally activated enhancers with intact AP1 motif in C57BL/6J that is mutated in SPRET/EiJ.
Figure 7.
Figure 7.. Neuronal activity modulates postnatally activated enhancers.
(A) Genome-browser view of the Vip-specific enhancer cluster upstream of the Igf1 gene. Cortical H3K27ac ChIP and HiChIP data are shown. Quantification of H3K27ac within the Igf1 enhancer in Sst and Vip neurons are also shown. Error bars represent s.d. between biological replicates. *P<0.05, two-tailed t-test. (B) The Igf1 enhancer in Vip neurons within the visual cortex contains two GREs, e1 and e2, of which e2 is bound by FOS in vivo in Vip neurons. Genome browser views along with visual cortex ATAC-seq data are shown (left). We note that the ATAC-seq peaks were detected in visual cortices but not reproducibly detected across the whole cortex. Whole cortex FOS and IgG CUT&RUN read densities were quantified within e1 and e2 (right). Error bars represent s.d. between biological replicates. (C) Igf1 e2 is induced by neuronal activity in an AP1 TF-dependent manner in vitro. Days in vitro (DIV) 7 mouse cortical neurons were stimulated by KCI treatment. “Control” represents the Nptx2 reporter backbone without the Nptx2 enhancer, and “Nptx2" represents the Nptx2 reporter backbone including the Nptx2 enhancer (Malik et al., 2014). Luciferase expression was quantified by normalizing the firefly luciferase signal to renilla luciferase signal from the same samples. Error bars represent s.d. between three independent experiments (biological replicates). *P<0.05, two-tailed t-test compared to control. (D) Igf1 e2 is activity-induced in an AP1-dependent manner in vitro. Luciferase assays were analyzed as in (C). Error bars represent s.d. between three to five independent experiments (biological replicates). *P<0.05, two-tailed t-test. (E) Igf1 e2 is induced by visual stimulation in Vip neurons in vivo. H3K27ac ChIP-seq read densities within the e2 enhancer region from Vip neurons within visual cortices of mice either dark-reared or light exposed were quantified. *P<0.05, two-tailed t-test.

Comment in

  • 'Enhancing' brain maturation.
    Lewis S. Lewis S. Nat Rev Neurosci. 2020 Sep;21(9):450-451. doi: 10.1038/s41583-020-0352-9. Nat Rev Neurosci. 2020. PMID: 32678311 No abstract available.

Similar articles

Cited by

References

    1. Alitto HJ, and Dan Y (2012). Cell-type-specific modulation of neocortical activity by basal forebrain input. Front Syst Neurosci 6, 79. - PMC - PubMed
    1. Anders S, Pyl PT, and Huber W (2015). HTSeq--a Python framework to work with high-throughput sequencing data. Bioinformatics 31,166–169. - PMC - PubMed
    1. Bailey TL, Boden M, Buske FA, Frith M, Grant CE, Clementi L, Ren J, Li WW, and Noble WS (2009). MEME SUITE: tools for motif discovery and searching. Nucleic Acids Res 37, W202–208. - PMC - PubMed
    1. Bailey TL, and Machanick P (2012). Inferring direct DNA binding from ChIP-seq. Nucleic Acids Res 40, el28. - PMC - PubMed
    1. Berry KP, and Nedivi E (2016). Experience-Dependent Structural Plasticity in the Visual System. Annu Rev Vis Sci 2,17–35. - PMC - PubMed

Publication types

LinkOut - more resources