. 2020 Aug 10;38(2):247-262.e11.
doi: 10.1016/j.ccell.2020.05.018. Epub 2020 Jun 25.

PKCλ/ι Loss Induces Autophagy, Oxidative Phosphorylation, and NRF2 to Promote Liver Cancer Progression

Affiliations

PKCλ/ι Loss Induces Autophagy, Oxidative Phosphorylation, and NRF2 to Promote Liver Cancer Progression

Yotaro Kudo et al. Cancer Cell. .

Abstract

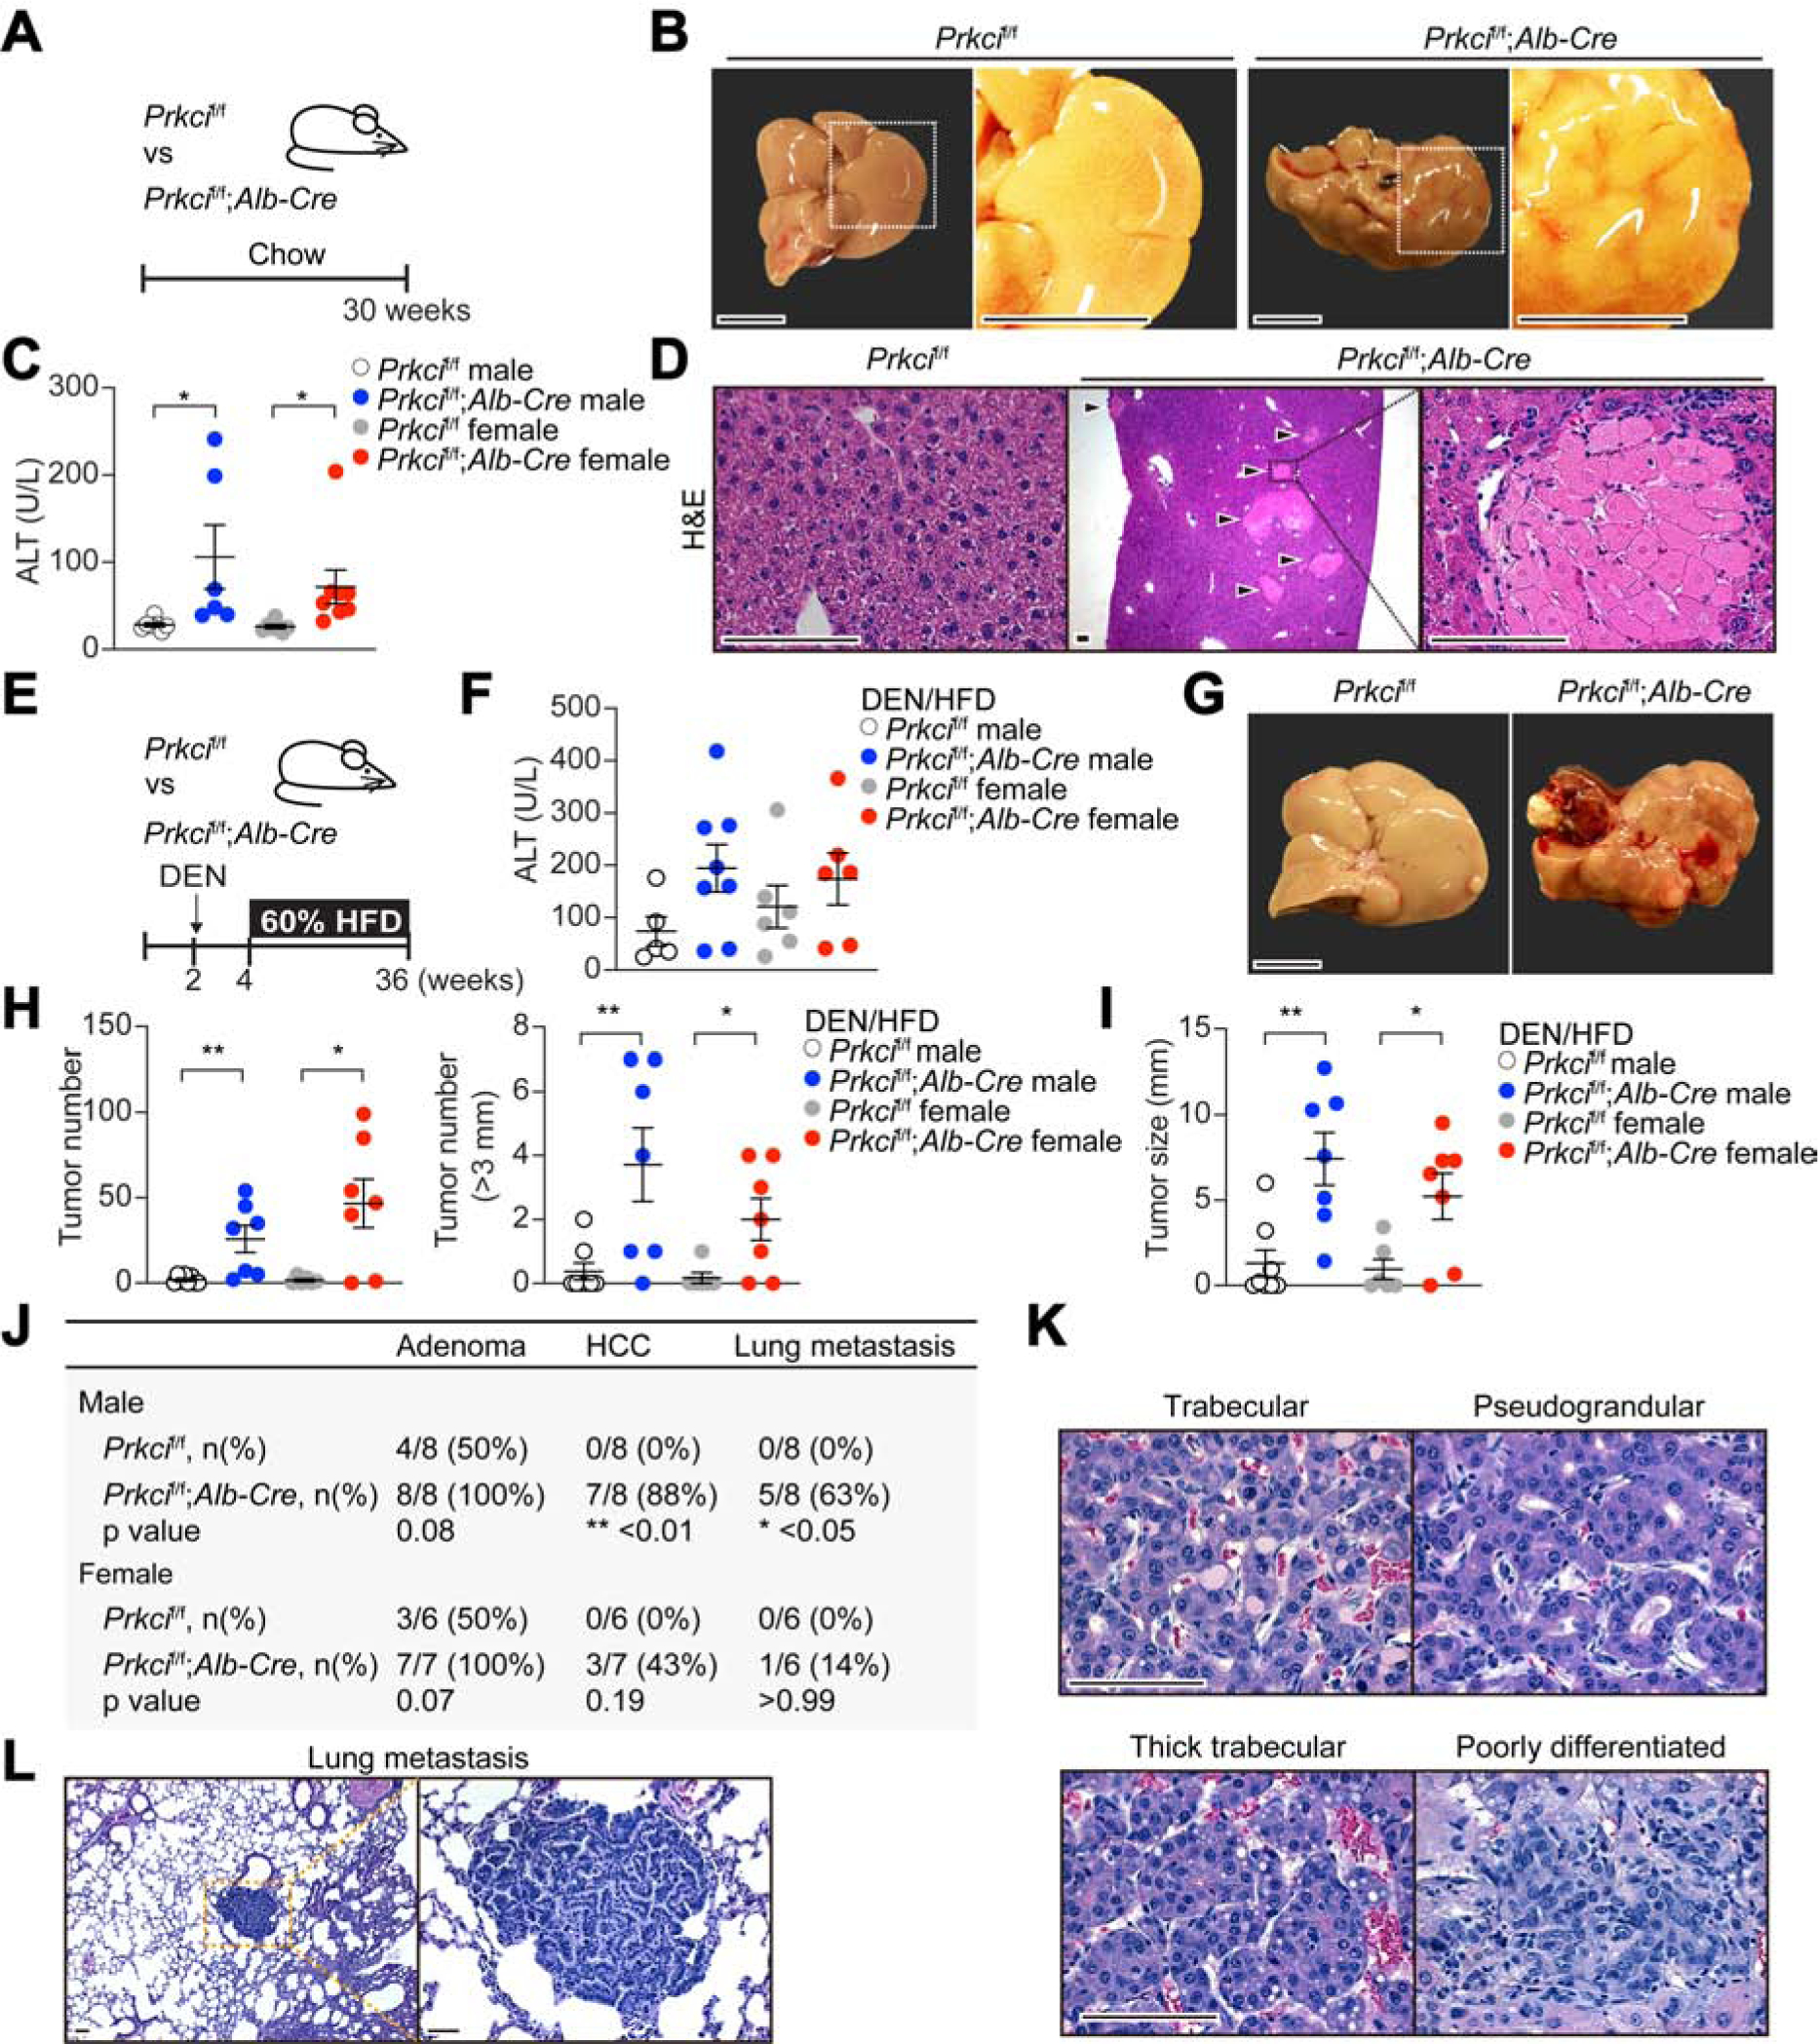
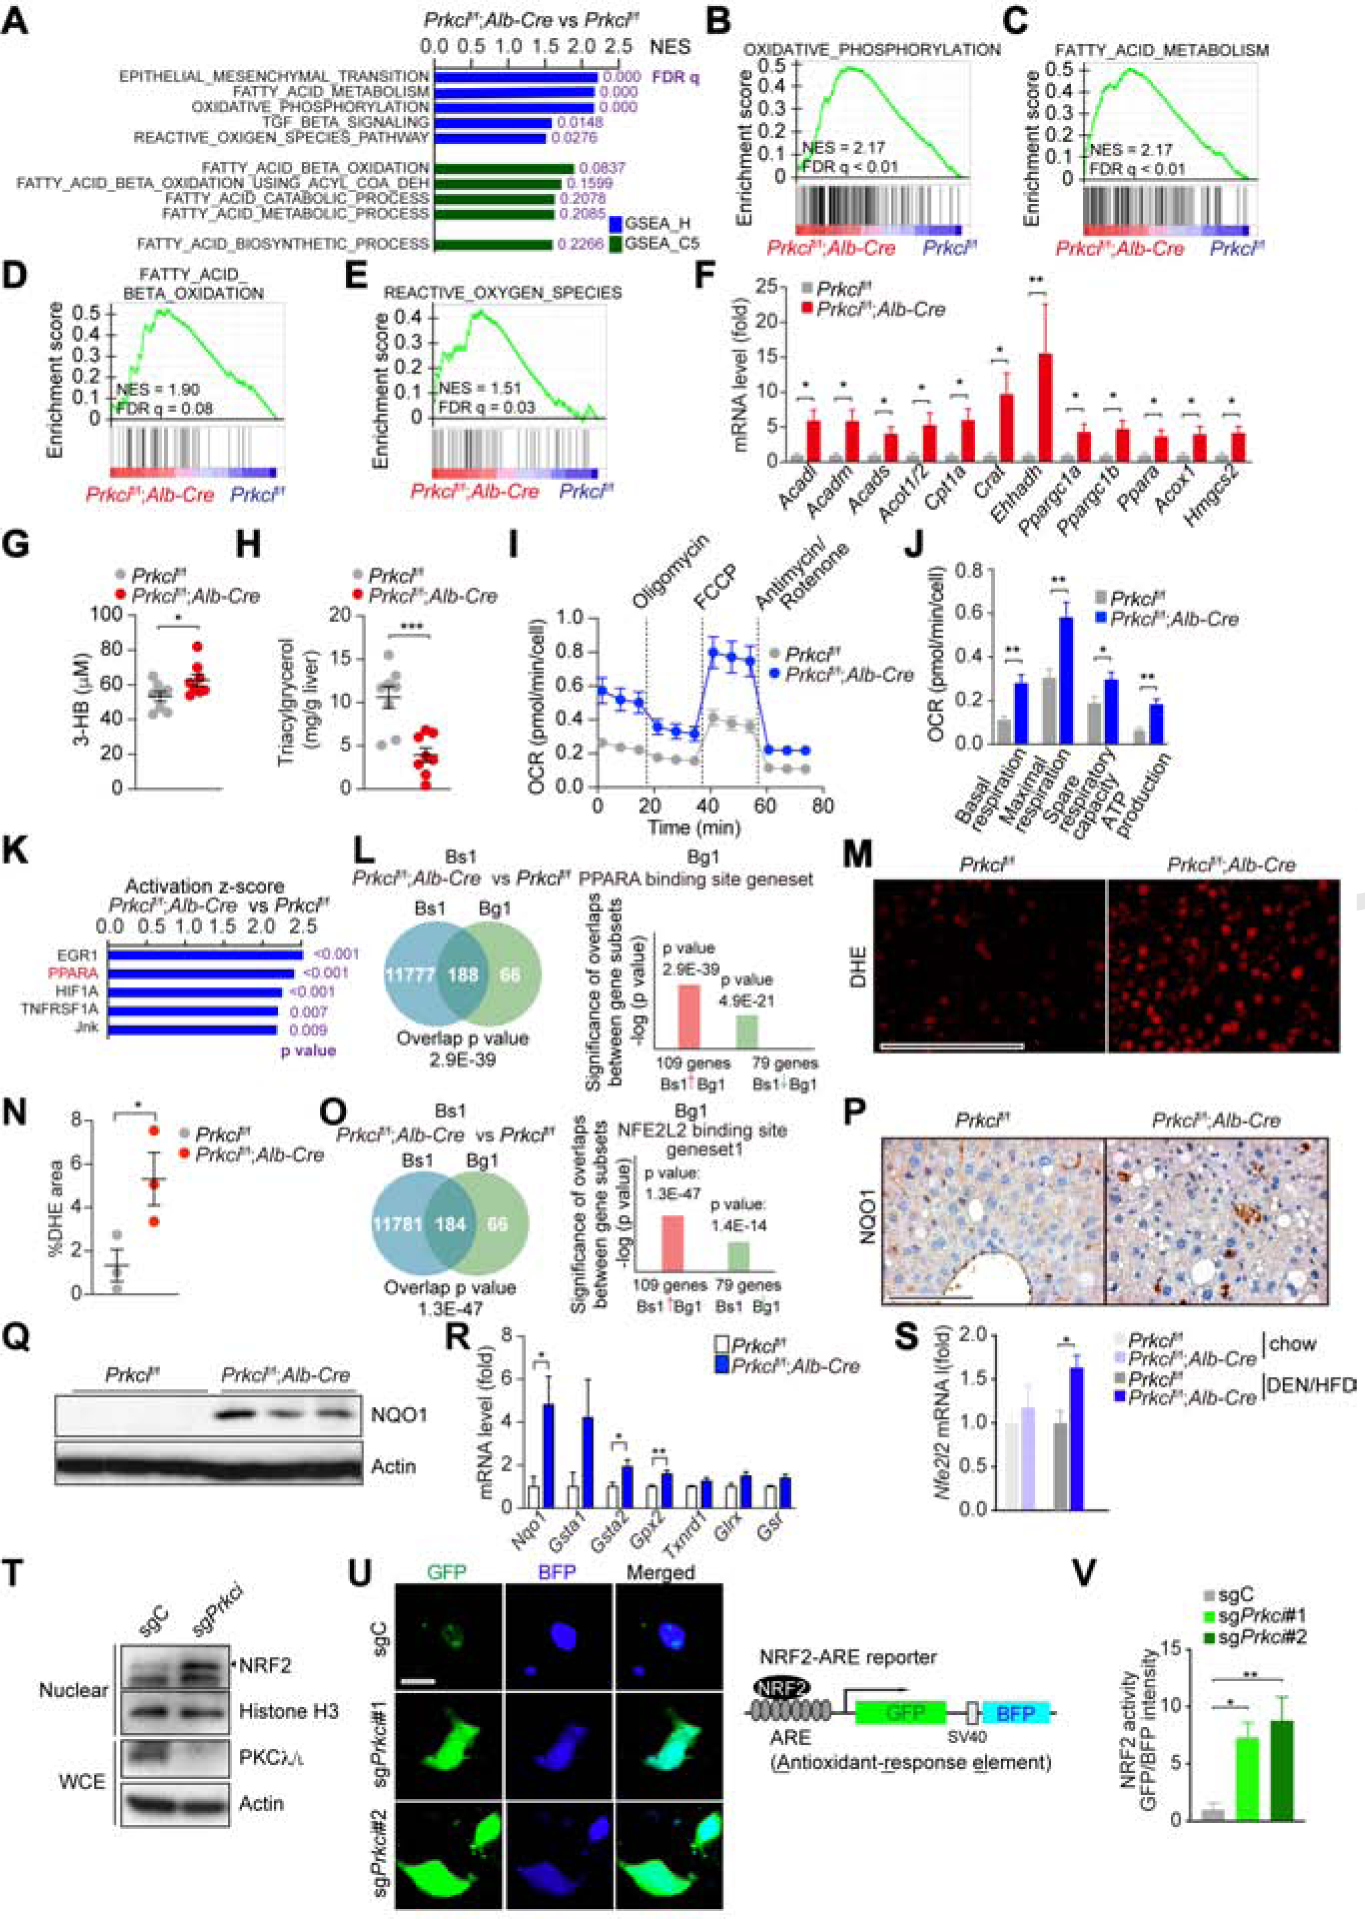
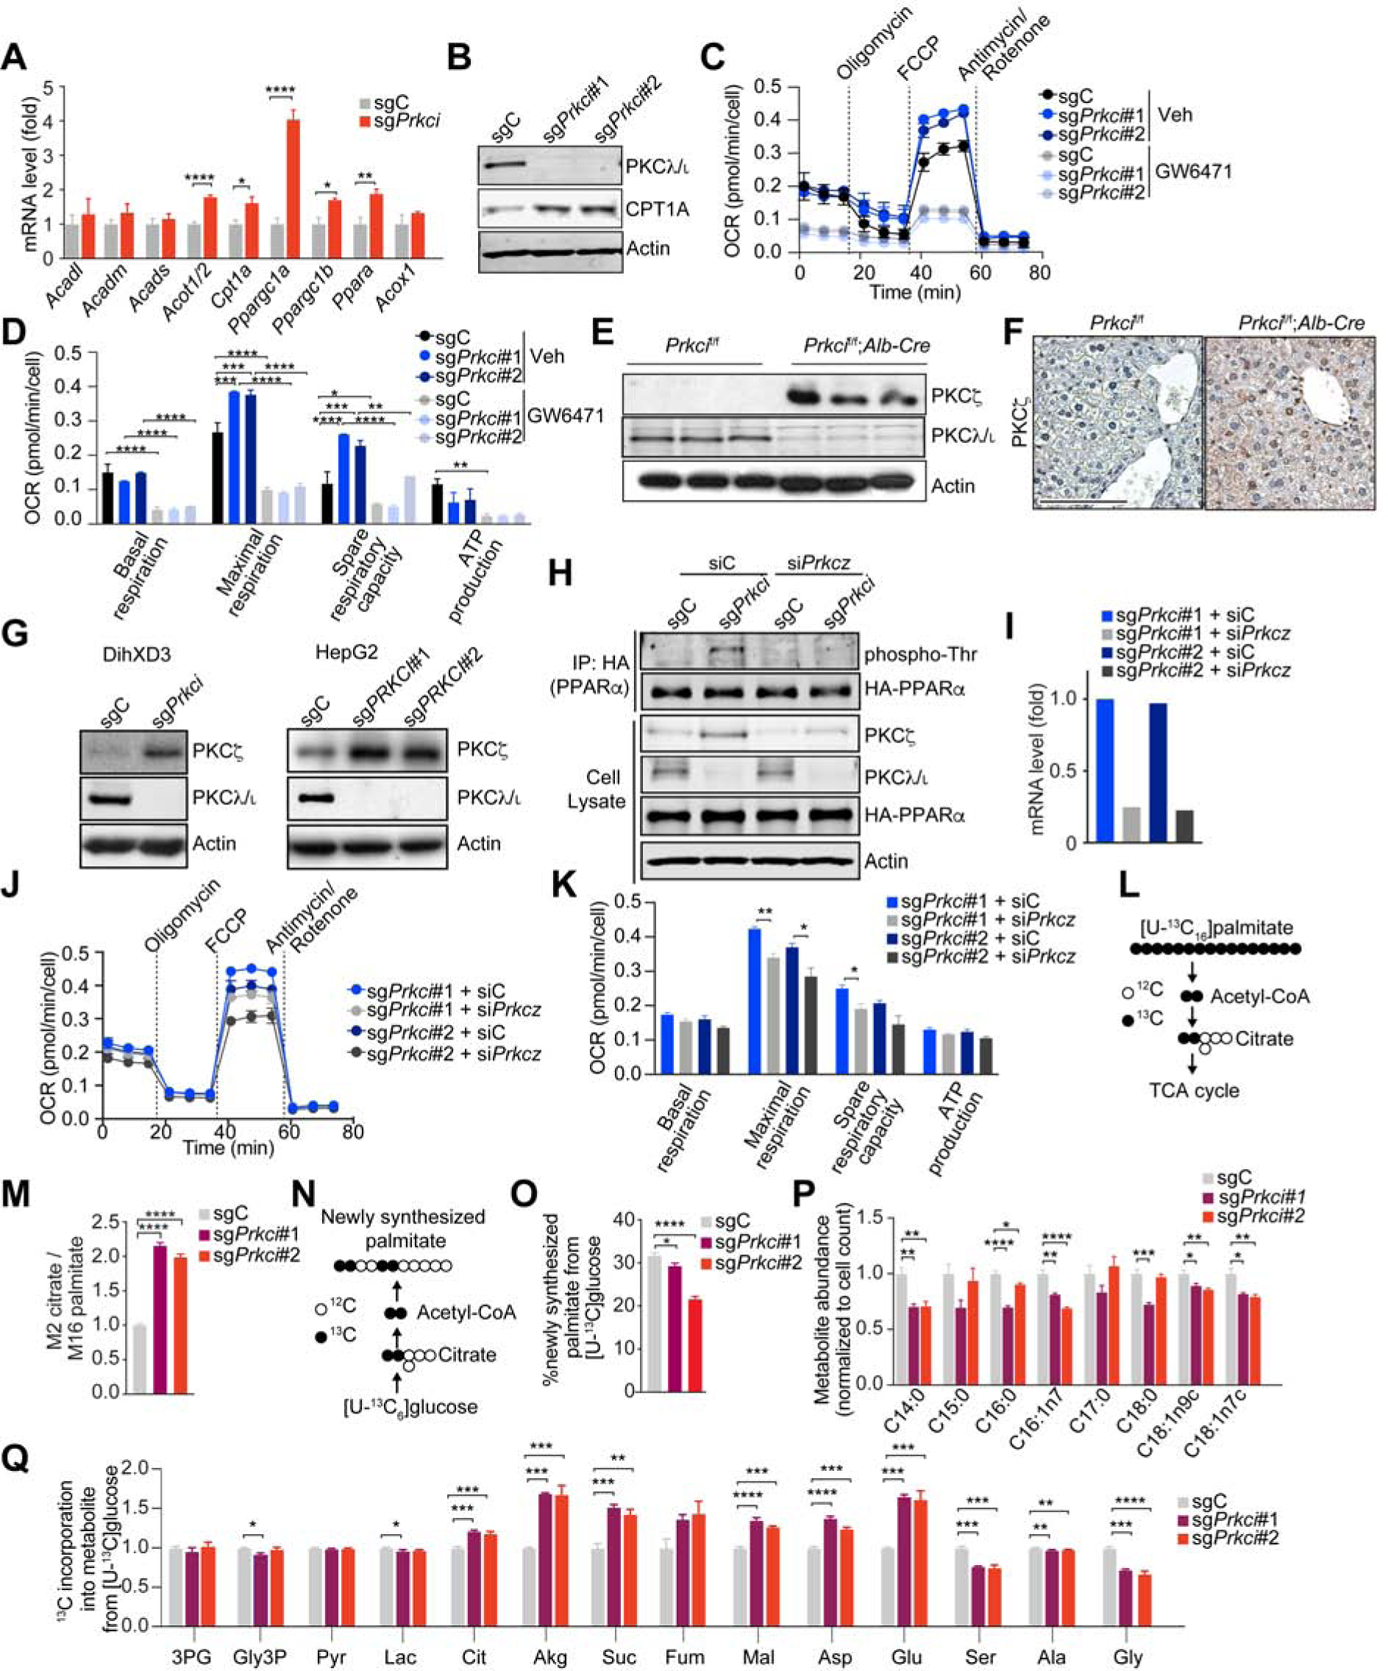
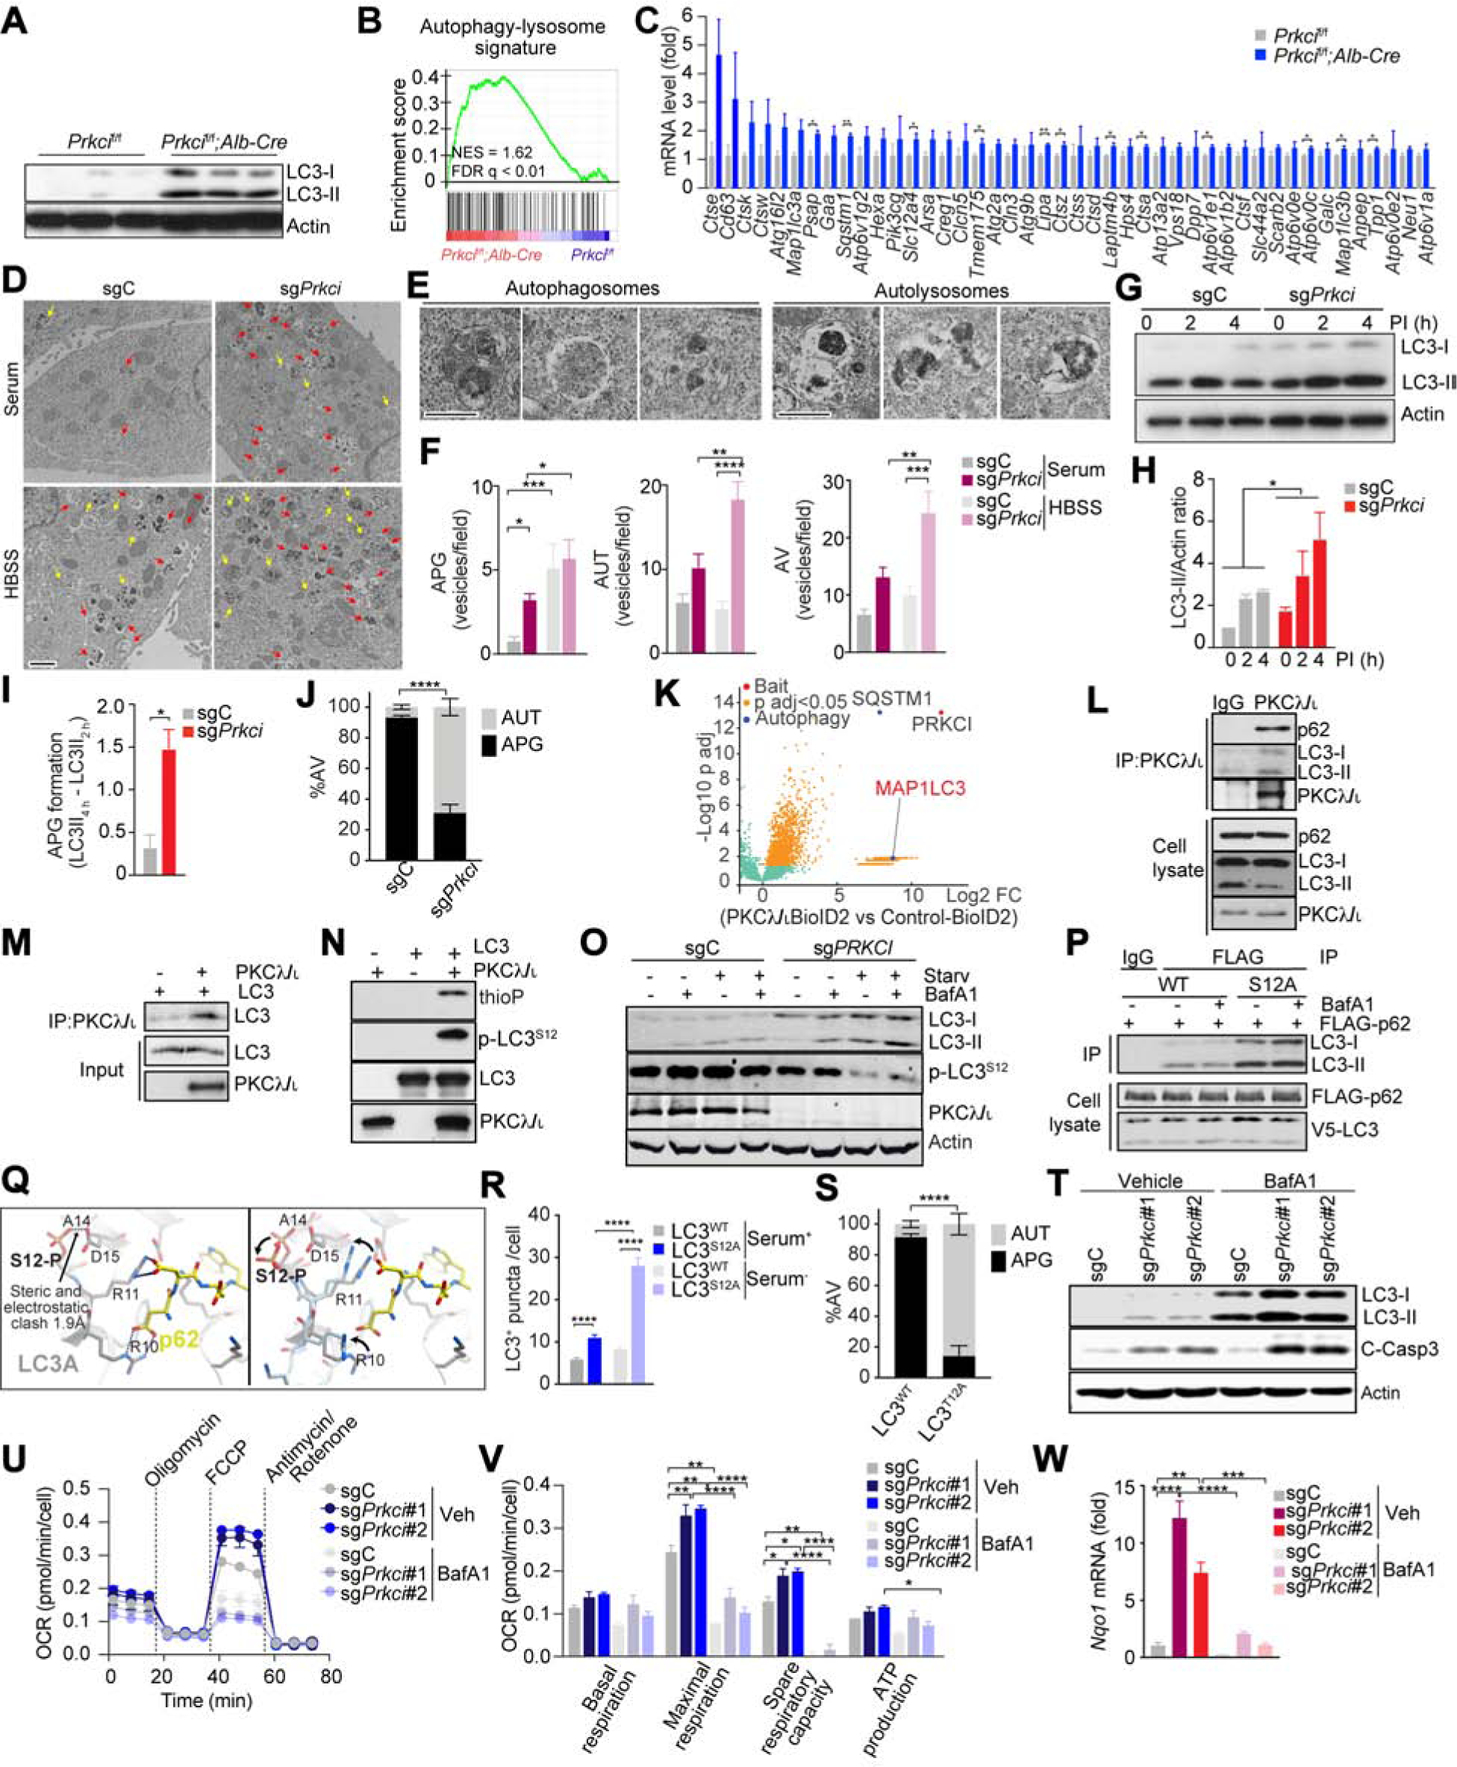
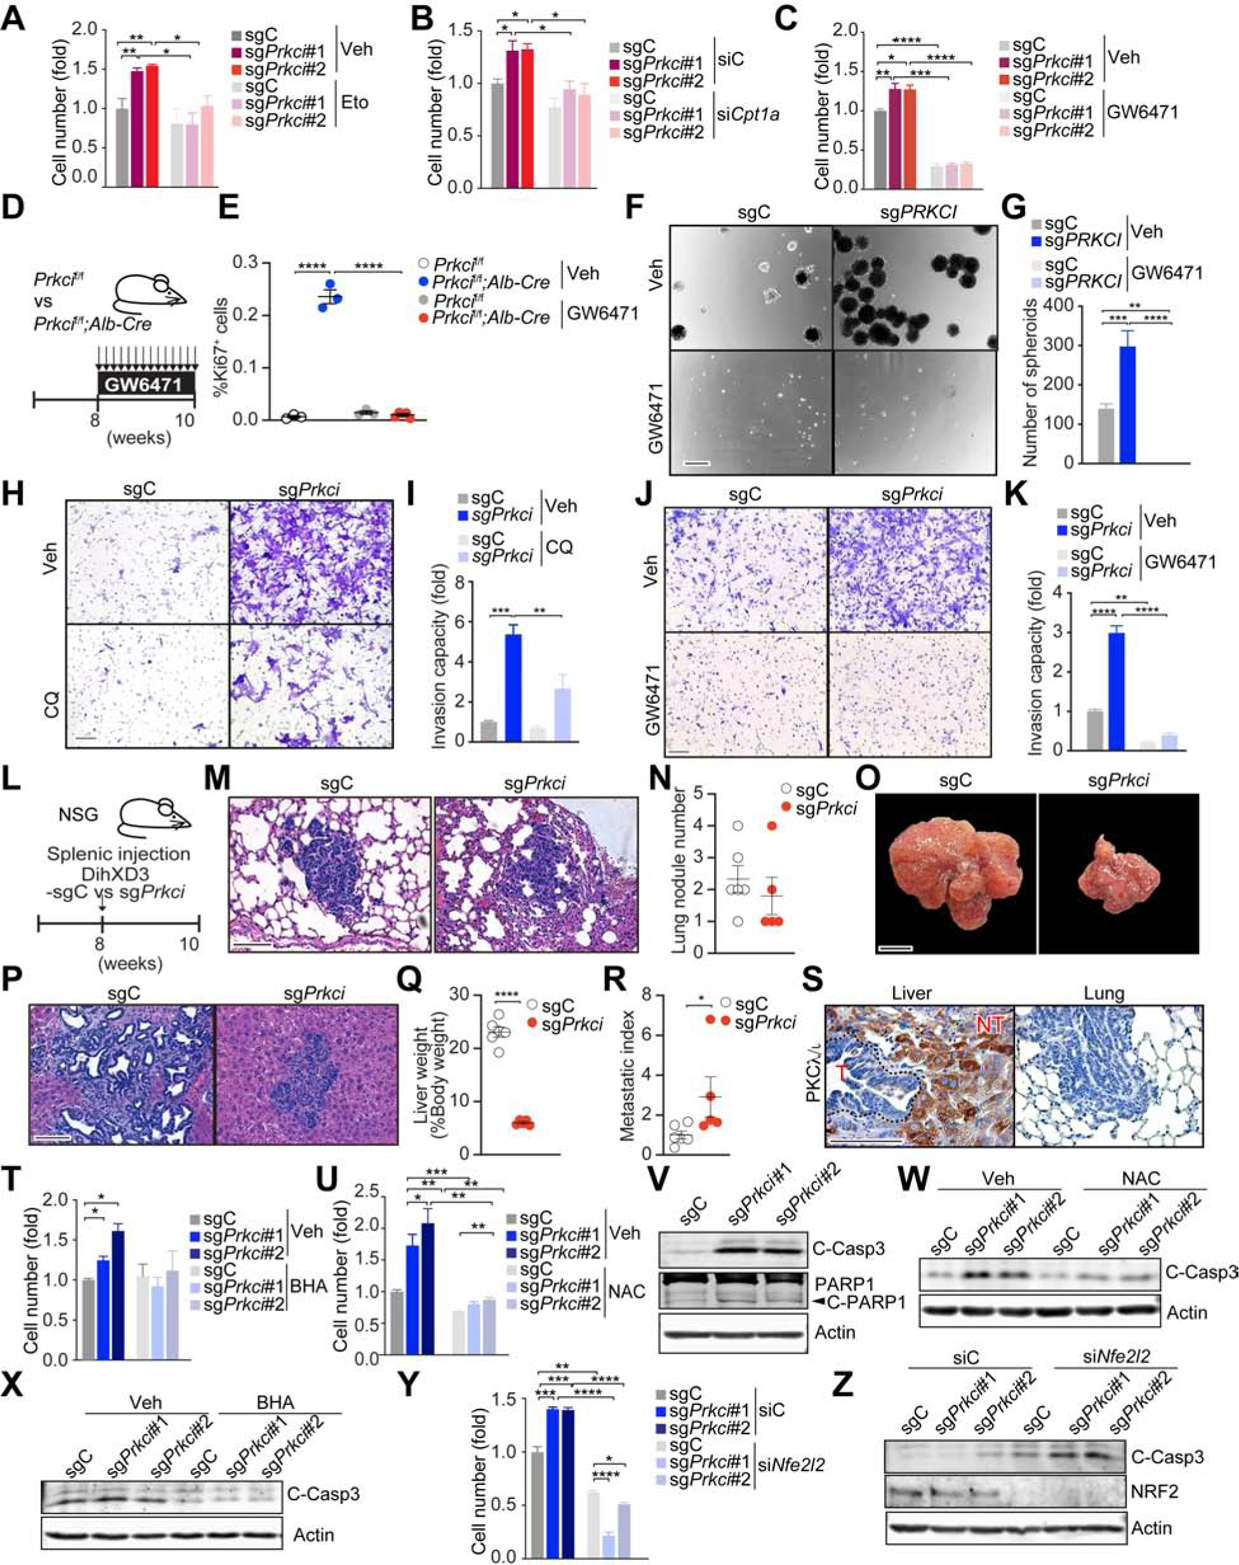
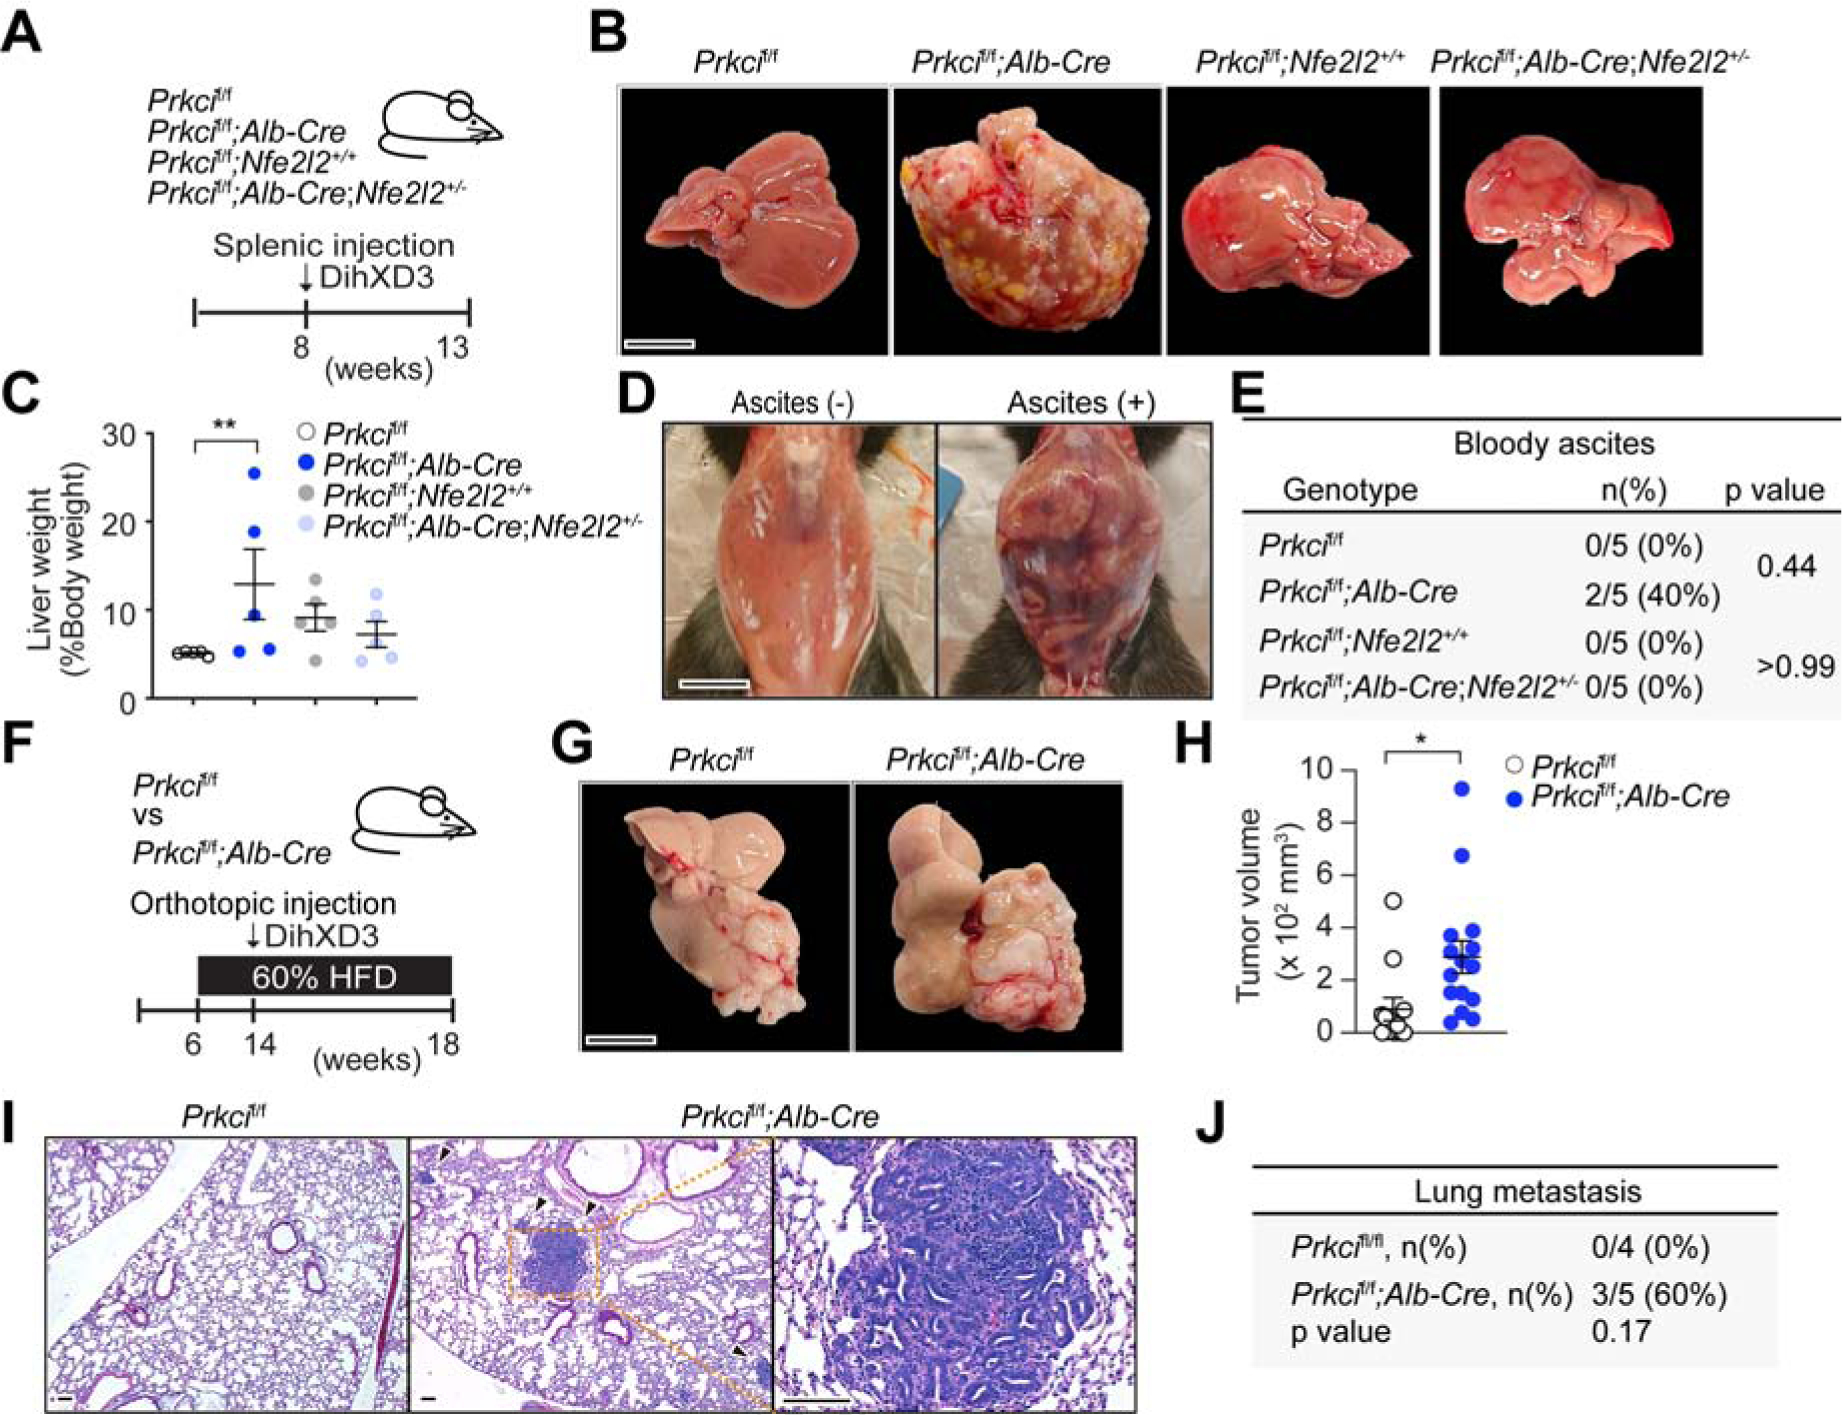
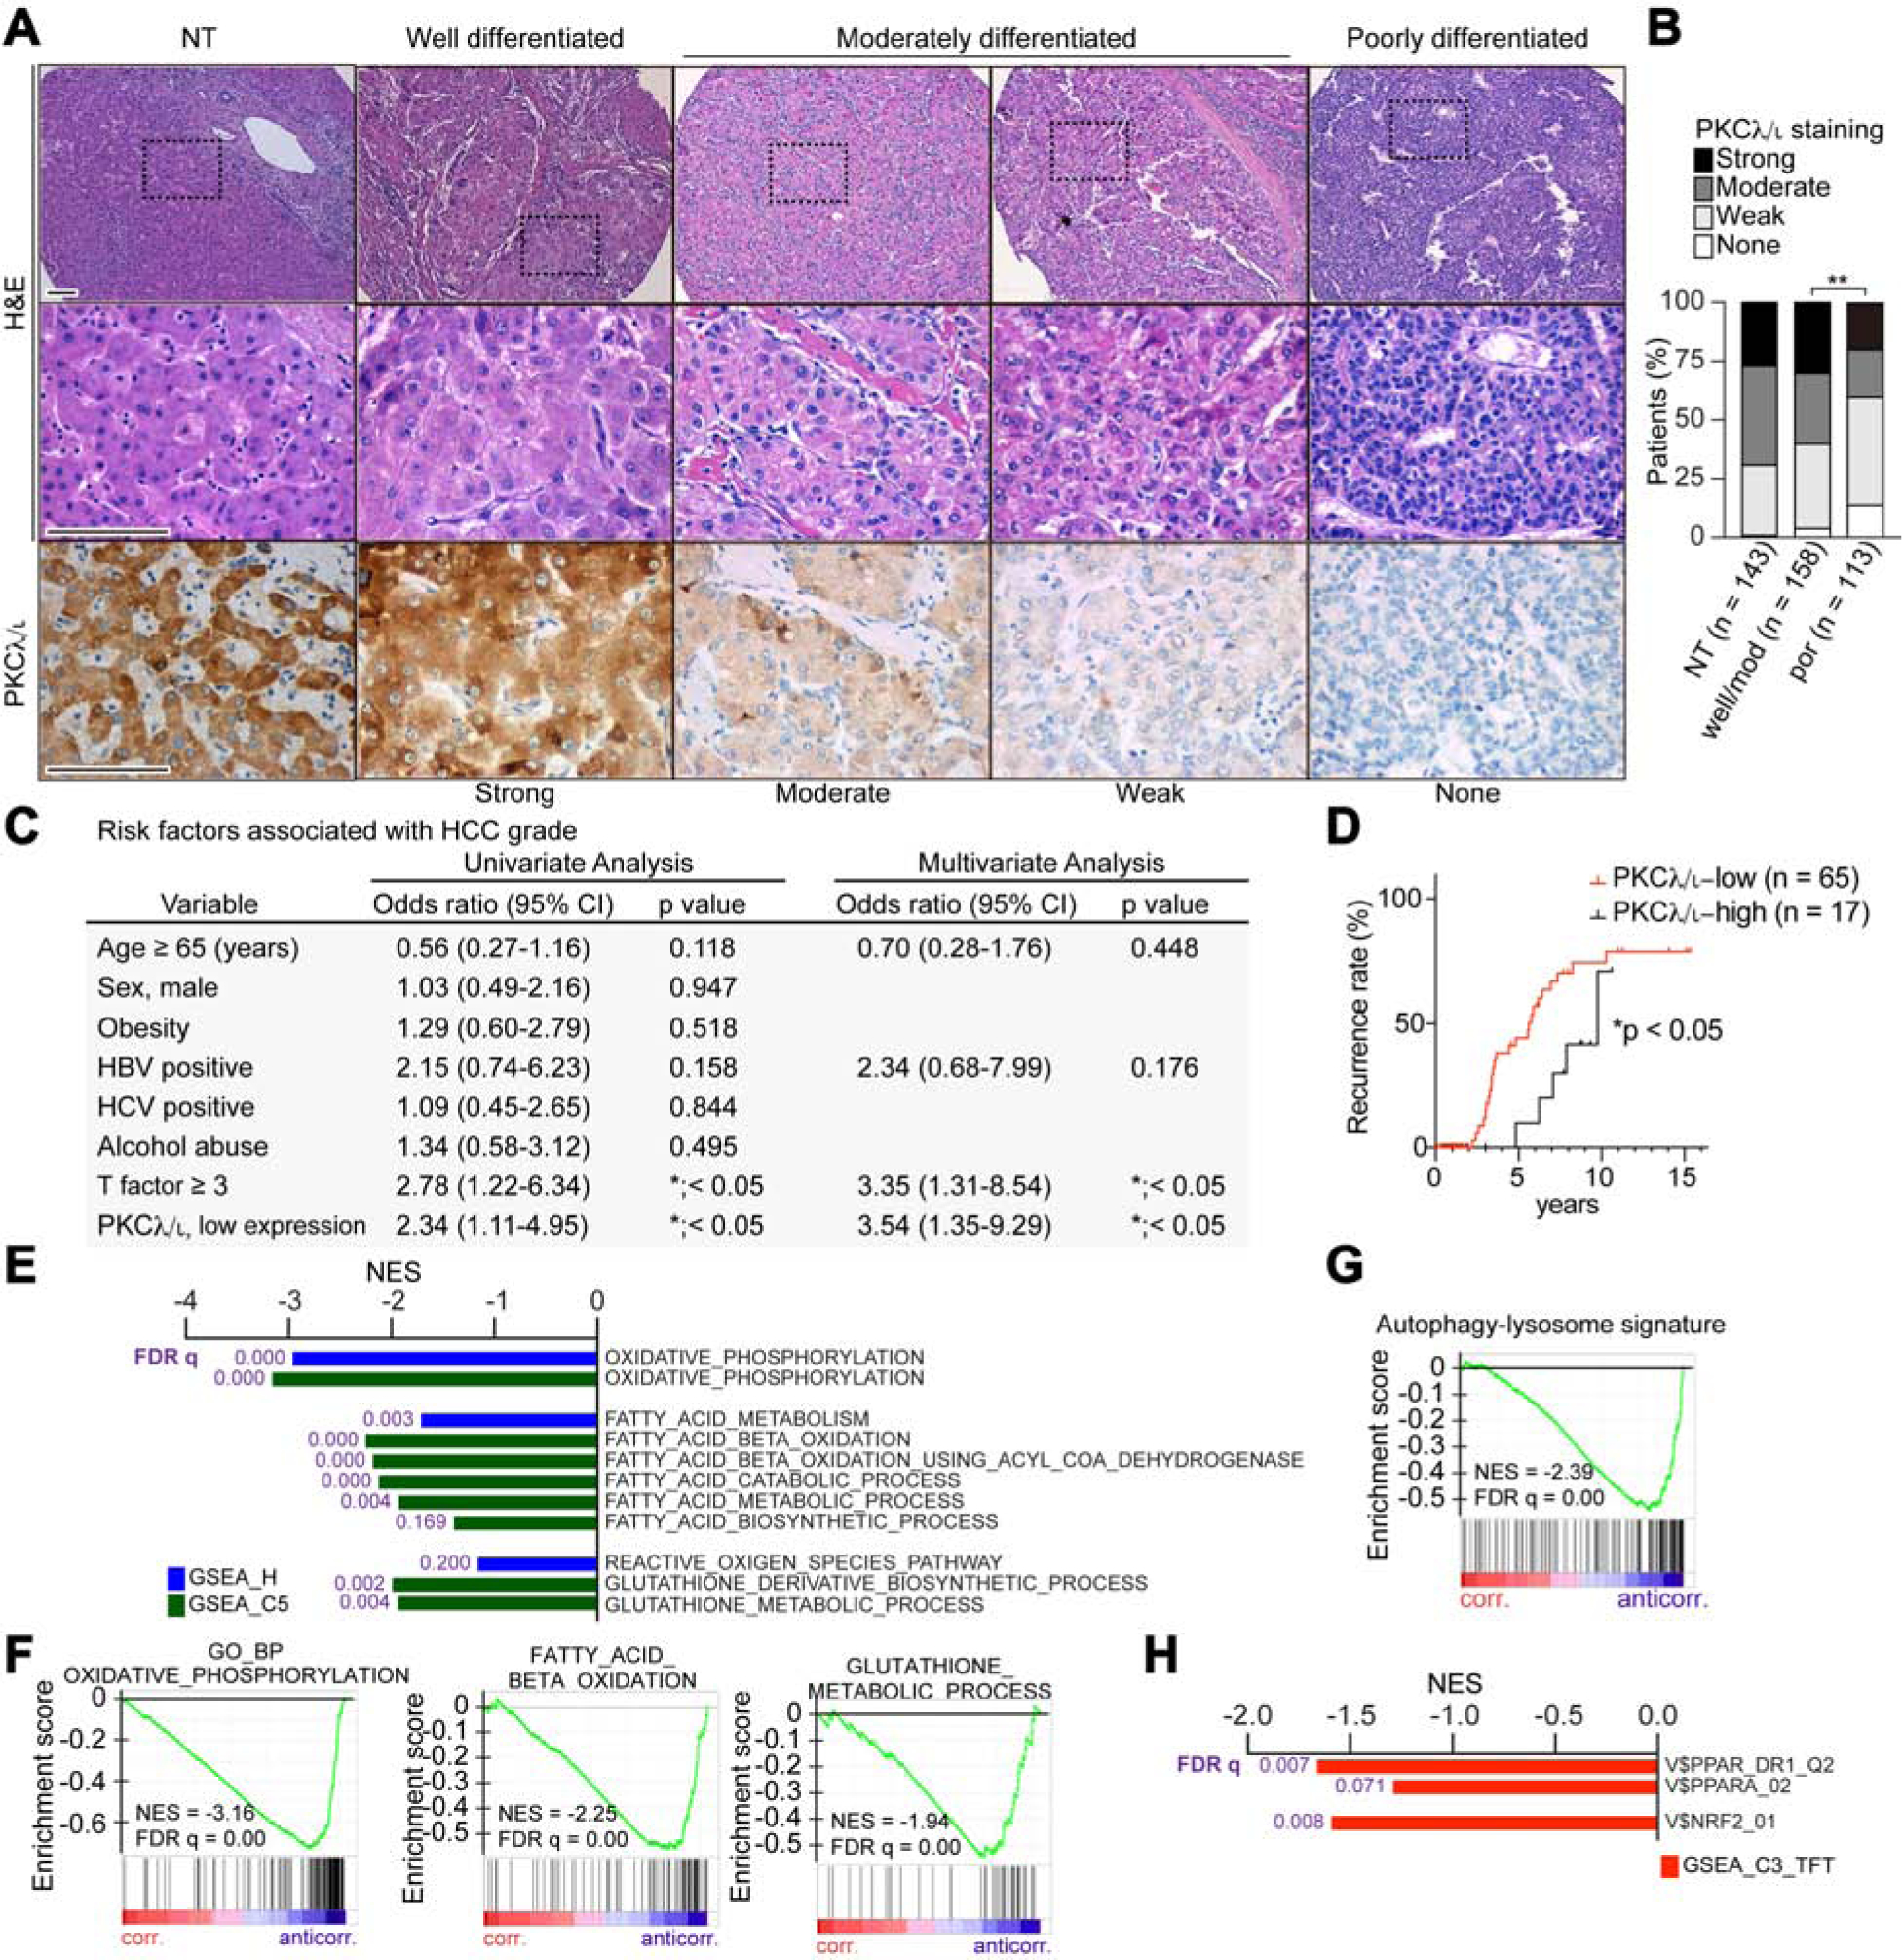
Oxidative stress plays a critical role in liver tissue damage and in hepatocellular carcinoma (HCC) initiation and progression. However, the mechanisms that regulate autophagy and metabolic reprogramming during reactive oxygen species (ROS) generation, and how ROS promote tumorigenesis, still need to be fully understood. We show that protein kinase C (PKC) λ/ι loss in hepatocytes promotes autophagy and oxidative phosphorylation. This results in ROS generation, which through NRF2 drives HCC through cell-autonomous and non-autonomous mechanisms. Although PKCλ/ι promotes tumorigenesis in oncogene-driven cancer models, emerging evidence demonstrate that it is a tumor suppressor in more complex carcinogenic processes. Consistently, PKCλ/ι levels negatively correlate with HCC histological tumor grade, establishing this kinase as a tumor suppressor in liver cancer.

Keywords: NRF2; PKCζ; PKCι; PKCλ; atypical PKC; autophagy; hepatocellular carcinoma; metabolic reprogramming; oxidative phosphorylation; reactive oxygen species.


Conflict of interest statement

Declaration of Interests The authors declare no competing interests.

Figures

Figure 1.
Figure 1.. Hepatocyte-specific PKCλ/ι Ablation Promotes Hepatocarcinogenesis
(A) Schematic representation of Prkcif/f;Alb-Cre mice examination. (B) Images of livers from Prkcif/f and Prkcif/f;Alb-Cre mice. Scale bar, 1 cm. (C) Serum ALT levels in Prkcif/f (n = 7 males and 6 females) and Prkcif/f;Alb-Cre mice (n = 7 males and 8 females). (D) H&E staining of Prkcif/f and Prkcif/f;Alb-Cre livers. Arrow heads indicate necrotic foci. Scale bar, 100 μm. (E) Schematic representation of DEN/HFD-induced HCC model. (F) Serum ALT levels in Prkcif/f (n = 5 males and 8 females) and Prkcif/f;Alb-Cre (n = 6 males and 6 females) mice treated as in (E). (G) Images of livers from Prkcif/f and Prkcif/f;Alb-Cre mice treated as in (E). Scale bar, 1 cm. (H and I) Tumor incidence (H), and maximal tumor diameters (I) in Prkcif/f (n = 8 males and 7 females) and Prkcif/f;Alb-Cre (n = 6 males and 7 females) livers. (J) Frequencies of liver adenoma, HCC and lung metastasis in Prkcif/f and Prkcif/f;Alb-Cre mice. (K and L) H&E staining of tumor sections from Prkcif/f;Alb-Cre livers showing different tumor histological grades (K), and lung metastasis (L) from Prkcif/f;Alb-Cre animals. Scale bar, 100 μm. Mean ± SEM. *p < 0.05, **p < 0.01. See also Figures S1 and S2.
Figure 2.
Figure 2.. Selective PKCλ/ι Deficiency in Hepatocytes Results in Metabolic Reprogramming
(A) Top 5 GSEA results of Prkcif/f;Alb-Cre vs Prkcif/f livers (n = 3) using compilation H and C5 (MSigDb). (B-E) GSEA of the indicated genesets. (F) qPCR of FAO/OXPHOS-related genes in Prkcif/f (n = 6) and Prkcif/f;Alb-Cre (n = 8) livers. (G and H) Plasma ketone body (G) and hepatic triacylglycerol (H) in Prkcif/f and Prkcif/f;Alb-Cre mice (n = 8) after 12 h fasting followed by 2 h of refeeding. (I and J) OCR in primary hepatocytes isolated from Prkcif/f and Prkcif/f;Alb-Cre mice (n = 5). (K) Upstream Regulator Analysis by IPA in Prkcif/f;Alb-Cre livers vs Prkcif/f livers (n = 3). (L) NextBio analysis of gene overlap between genes upregulated in Prkcif/f;Alb-Cre livers vs Prkcif/f livers (n = 3, Bioset1, Bs1) and PPARα binding gene set (Biogroup 1, Bg1). (M and N) Images of DHE assay in Prkcif/f and Prkcif/f;Alb-Cre livers (M) and positive area quantification (N) (n = 4). Scale bar, 100 μm. (O) NextBio analysis of gene overlap between genes upregulated in Prkcif/f;Alb-Cre livers vs Prkcif/f livers (n = 3, Bioset1, Bs1) and NRF2 binding gene set (Biogroup 1, Bg1). (P and Q) NQO1 IHC (P) and immunoblot (Q) in Prkcif/f and Prkcif/f;Alb-Cre livers. Scale bar, 100 μm. (R) qPCR of NRF2 target genes in Prkcif/f (n = 6) and Prkcif/f;Alb-Cre (n = 8) livers. (S) Nfe2l2 expression levels (RNA-seq, FPKM) in Prkcif/f (n = 3 for chow diet and DEN/HFD) and Prkcif/f;Alb-Cre (n = 3 and n = 4 for chow and DEN/HFD, respectively) livers. (T) Immunoblots of indicated proteins in sgPrkci or sgC cells. (U and V) IF images left) and design of the NRF2 reporter (right) (U). Scale bar, 10 μm. Quantification of NRF2 activity (n > 10 cells) (V). Mean ± SEM. *p < 0.05, **p < 0.01, ***p < 0.001. See also Figure S3.
Figure 3.
Figure 3.. Loss of PKCλ/ι in Hepatocytes Enhances Oxidative Phosphorylation
(A) qPCR of FAO/OXPHOS-related genes in sgPrkci (n=6) or sgC (n = 5) cells. (B) Immunoblot of indicated proteins in sgPrkci (#1 and #2) or sgC cells. (C and D) OCR measurement in sgPrkci (#1 and #2) and sgC cells (n = 3 – 5) treated with GW6471 (10 μM) or DMSO (Veh) for 24 h. (E) Immunoblots of indicated proteins in Prkcif/f and Prkcif/f;Alb-Cre livers from 30-week-old mice (n = 3). (F) IHC for PKCζ in Prkcif/f and Prkcif/f;Alb-Cre livers. (G) Immunoblot of PKCζ in sgPrkci or sgC DihXD3 and HepG2 cells. (H) Immunoprecipitation of HA-tagged human PPARα in BNL CL.2 cells treated with Calyculin A (100 nM, 2 h) and immunoblot for the indicated proteins. followed by immunoblot of phospho-Threonine. (I) qPCR of Prkcz in the indicated cells lines. (J and K) OCR measurement in cell lines form (I) (n = 3). (L) Schematic depicting 13C carbon labeling on citrate from [U-13C]palmitate via fatty acid oxidation. (M) Fatty acid oxidation over 6 h depicted as M2 labeling on citrate relative to M16 labeling on intracellular palmitate from [U-13C16]palmitate trace in sgPrkci (#1 and #2) and sgC cells (n = 3). (N) Schematic depicting 13C carbon labeling on palmitate from [U-13C]glucose via de novo lipogenesis. (O) Percent of newly synthesized palmitate from [U-13C6]glucose over 24 h in sgPrkci (#1 and #2) and sgC cells (n = 3). (P) Intracellular metabolite abundance in sgPrkci (#1 and #2) BNL CL.2 cells relative to control (sgC) (n = 3) (Q) 13C incorporation into intracellular metabolites from [U-13C6]glucose over 24h in sgPrkci (#1 and #2) and sgC cells (n = 3). Mean ± SEM with exception of (H), in which mean ± 95% confidence interval. *p < 0.05, **p < 0.01, ***p < 0.001, ****p < 0.0001. See also Figure S4.
Figure 4.
Figure 4.. PKCλ/ι deficiency in hepatocytes Enhances Autophagy Flux
(A) Immunoblot for LC3 and actin in Prkcif/f and Prkcif/f;Alb-Cre livers (n = 3). (B and C) GSEA of the autophagy associated geneset in Prkcif/f;Alb-Cre livers vs Prkcif/f livers (n = 3) (B), and expression of core genes in the signature (FPKM) (C). (D) EM images of sgPrkci and sgC cells in serum supplemented media (Serum) or HBSS. Arrows: autophagosomes (yellow) and autolysosomes (red). Scale bar, 1 μm. (E-F) Images of autophagosomes (APG) and autolysosomes (AUT) (E), and quantification of APG, AUT and autophagic vacuoles (AV) (F). Scale bar, 0.5 μm. (G-H) Immunoblot for LC3 in response to lysosomal inhibitors (PI) (G) and quantification of LC3-II intensity normalized to actin (n = 3) (H), in sgPrkci and sgC cells cultured in FBS-free media. (I) Calculated speed of autophagosome formation (n = 3). (J) Quantification of APG and AUT in sgPrkci and sgC cells in response to 4 h of FBS starvation using tandem fluorescent-tagged LC3B reporter plasmid (n > 20 cells). (K) Volcano plot of biotinylated proteins in PKCλ/ι-BioID2 vs Empty-BioID2 HEK239T cells. (L) Immunoprecipitation for endogenous PKCλ/ι followed by immunoblot for indicated endogenous proteins in HEK293T cells. (M) Interaction between recombinant human PKCλ/ι and human LC3. (N) In vitro kinase assay. Phosphorylated LC3 detection by immunoblot for thiophosphate ester (thioP) and phosphorylated Ser 12 in LC3 (p-LC3S12). (O) Immunoblot of indicated proteins in sgC and sgPRKCI HEK293T cells in response to control (DMSO), bafilomycin A1 (BafA1, 100 nM), FBS and amino acid-depletion (Starv), and BafA1 and Starv treatment for 48 h. (P) Immunoblot of cell lysate and FLAG-tagged immunoprecipitates of HEK293T cells transfected with FLAG-tagged p62 and V5-tagged LC3 in response to BafA1 (200 nM) treatment for 12 h. (Q) Molecular structure of human LC3. (R) Quantification of LC3 positive puncta in LC3 wild-type (WT) or S12A mutant (S12A) BNL CL.2 cells (n > 20 cells) cultured with or without serum for 4 h. (S) Quantification of AUT in BNL CL.2 cells in response to 4 h of FBS starvation using tandem fluorescent-tagged LC3B wild-type (WT) or T12A mutant (T12A) reporter plasmid (n > 20 cells). (T) Immunoblot for LC3 and cleaved caspase-3 in sgC and sgPrkci cells with or without BafA1 (30 nM). (U and V) OCR measurement in sgPrkci (#1 and #2) and sgC cells (n = 3) treated with BafA1 (30 nM) or control (Veh). (W) qPCR for Nqo1 mRNA expression in sgC and sgPrkci cells with or without BafA1 (30 nM) (n = 3). Mean ± SEM. *p < 0.05, **p < 0.01, ***p < 0.001, ****p < 0.0001. See also Figure S5.
Figure 5.
Figure 5.. Loss of PKCλ/ι Enhances the Aggressive Phenotype of Hepatoma Cells
(A) Cell number of sgPrkci or sgC cells treated with etomoxir (Eto, 10 μm) or vehicle control (Veh) for 7 days (n = 3). (B) Cell number of sgPrkci or sgC cells 7 days after siRNA-induced knockdown of Cpt1a (siCpt1a) or control siRNA (siC) (n = 3). (C) Cell number of sgPrkci or sgC cells treated with GW6471 (5 μM) or Veh for 6 days (n = 3). (D) Schematic representation of GW6471 treatment. (E) Quantification of Ki-67 positive hepatocytes by IHC (n = 3–5) in mice treated as in (D). (F and G) Sphere formation assay of sgPRKCI or sgC HepG2 cells treated with GW6471 (10 μM) or Veh. Images (F) and quantification of spheres (n = 4) (G). (H and I) Invasion of sgPrkci or sgC DihXD3 cells treated with chloroquine (CQ, 5 μM) or Veh. Images (H) and quantification of invasive cells (n = 3) (I). (J and K) Invasion of sgPrkci or sgC DihXD3 cells treated with GW6471 (10 μM) or Veh. Images (J) and quantification of invasive cells (n = 3) (K). (L) Schematic representation of sgPrkci or sgC DihXD3 cells transplantation through splenic injection in male NSG mice (sgC, n = 6; sgPrkci, n = 5). (M-N) H&E staining (M) and quantification of lung metastasis (N) in mice treated as in (L). (O-R) Images (O), H&E staining (P), quantification of liver weight normalized to body weight (Q), and metastatic index (R) of livers from mice treated as in (L). (S) IHC for PKCλ/ι in hepatic primary tumors and lung metastasis from the animal injected with sgC DihXD3 cells (T, tumor; NT, non-tumor). (T and U) Cell number of sgPrkci or sgC BNL CL.2 cells treated with butylated hydroxyanisole (BHA, 100 μM) (T) or N-Acetylcysteine (NAC, 2 mM) (U) for 5 days (n = 3). (V) Immunoblot for cleaved caspase-3 and cleaved PARP1 in sgPrkci or sgC BNL CL.2 cells. (W and X) Immunoblot for cleaved caspase-3 in sgPrkci or sgC cells treated with NAC (2 mM) (W) or BHA (200 μM) (X) for 72 h. (Y and Z) Cell number (Y) (n=3), and immunoblot for indicated proteins (Z), 7 days (Y) or 2 (Z) days after knockdown of Nfe2l2 in sgPrkci or sgC cells. Mean ± SEM. *p < 0.05, **p < 0.01, ***p < 0.001, ****p < 0.0001. Scale bar, 100 μm (F, H, J, M, P and S); 1 cm (O). See also Figure S6.
Figure 6.
Figure 6.. PKCλ/ι Deficiency in Non-tumorous Liver Tissue Generates a Pro-tumorigenic Microenvironment
(A) Schematic representation of splenic injection of DihXD3. (B-E) Images of transplanted livers (B), quantification of liver weight normalized to body weight (n = 5) (C) and images (D), and incidence of bloody ascites (E) of mice treated as in (A). (F) Schematic of orthotopic implantation of DihXD3 cells into livers of Prkcif/f and Prkcif/f;Alb-Cre male mice. (G-J) Liver images (G), hepatic tumor volume (Prkcif/f, n = 12; Prkcif/f;Alb-Cre, n = 15 tumors) (H), H&E staining (I) and incidence (J) of lung metastasis (Prkcif/f, n = 4; Prkcif/f;Alb-Cre, n = 5 animals) of mice treated as in (F). Mean ± SEM. *p < 0.05, **p < 0.01. Scale bar, 1 cm (B and G); 100 μm (I).
Figure 7.
Figure 7.. Low PKCλ/ι Expression in Human Liver Tissue is a Risk Factor for Late HCC Recurrence
(A) H&E staining and IHC for PKCλ/ι in clinical HCC sections of different histological grade (n = 271 cases) and surrounding non-tumorous (NT, n = 143 cases) liver tissues. Scale bar, 100 μm. (B) PKCλ/ι expression levels in HCC according to the IHC based classification; none, weak, moderate and strong (NT, n = 143; HCC, n = 271). (C) Univariate and multivariate analyses to determine risk factors associated with HCC grade (odds ratio; poorly differentiated HCC vs HCC of well or moderately differentiated HCC), (n = 143). (D) Kaplan-Meier curves of time to late recurrence in patients who underwent surgical resection of HCC. Patients were classified according to the PKCλ/ι expression level in surrounding non-tumorous liver tissues (n = 82). (E) Negatively correlated pathways to Prkci gene expression in background liver tissues of HCC patients from TCGA dataset using compilation H and C5 (MSigDb). (F-G) GSEA of the indicated genesets. (H) Negative correlation between Prkci gene expression in background liver tissues of HCC patients from TCGA dataset with PPARα and NRF2 targets (C3, MSigDb). *p < 0.05, **p < 0.01.

Comment in

References

    1. Burns KA, and Vanden Heuvel JP (2007). Modulation of PPAR activity via phosphorylation. Biochim Biophys Acta 1771, 952–960. - PMC - PubMed
    1. Duran A, Amanchy R, Linares JF, Joshi J, Abu-Baker S, Porollo A, Hansen M, Moscat J, and Diaz-Meco MT (2011). p62 is a key regulator of nutrient sensing in the mTORC1 pathway. Mol Cell 44, 134–146. - PMC - PubMed
    1. Duran A, Hernandez ED, Reina-Campos M, Castilla EA, Subramaniam S, Raghunandan S, Roberts LR, Kisseleva T, Karin M, Diaz-Meco MT, and Moscat J (2016). p62/SQSTM1 by Binding to Vitamin D Receptor Inhibits Hepatic Stellate Cell Activity, Fibrosis, and Liver Cancer. Cancer Cell 30, 595–609. - PMC - PubMed
    1. Duran A, Linares JF, Galvez AS, Wikenheiser K, Flores JM, Diaz-Meco MT, and Moscat J (2008). The Signaling Adaptor p62 Is an Important NF-[kappa]B Mediator in Tumorigenesis. Cancer Cell 13, 343–354. - PubMed
    1. El-Serag HB (2011). Hepatocellular carcinoma. N Engl J Med 365, 1118–1127. - PubMed

Publication types

MeSH terms