. 2020 Jun 25;181(7):1680-1692.e15.
doi: 10.1016/j.cell.2020.05.002.

Metabolic Dynamics and Prediction of Gestational Age and Time to Delivery in Pregnant Women

Affiliations

Metabolic Dynamics and Prediction of Gestational Age and Time to Delivery in Pregnant Women

Liang Liang et al. Cell. .

Abstract

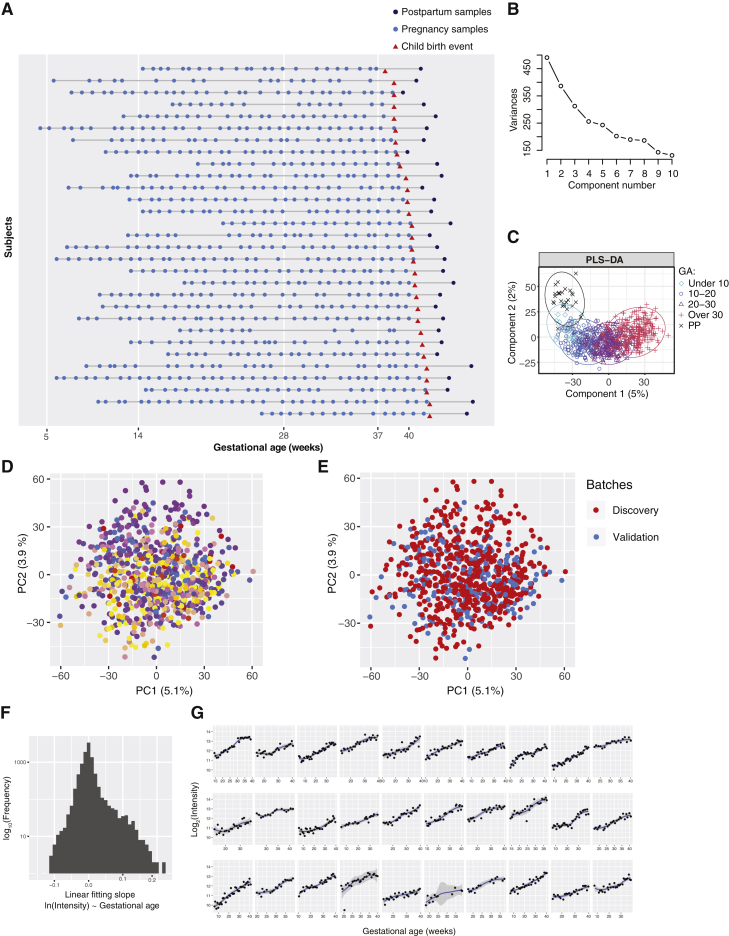
Metabolism during pregnancy is a dynamic and precisely programmed process, the failure of which can bring devastating consequences to the mother and fetus. To define a high-resolution temporal profile of metabolites during healthy pregnancy, we analyzed the untargeted metabolome of 784 weekly blood samples from 30 pregnant women. Broad changes and a highly choreographed profile were revealed: 4,995 metabolic features (of 9,651 total), 460 annotated compounds (of 687 total), and 34 human metabolic pathways (of 48 total) were significantly changed during pregnancy. Using linear models, we built a metabolic clock with five metabolites that time gestational age in high accordance with ultrasound (R = 0.92). Furthermore, two to three metabolites can identify when labor occurs (time to delivery within two, four, and eight weeks, AUROC ≥ 0.85). Our study represents a weekly characterization of the human pregnancy metabolome, providing a high-resolution landscape for understanding pregnancy with potential clinical utilities.

Keywords: delivery prediction; gestational age; human pregnancy; longitudinal profiling; machine learning; metabolic clock; metabolic pathways; metabolomics.


Conflict of interest statement

Declaration of Interests M.S. is a co-founder and member of the scientific advisory boards of the following: Personalis, SensOmics, Filtricine, Qbio, January, Mirvie, and Oralome. He is a member of the scientific advisory board of Jungla. M.M. is a co-founder of Mirvie. L.L., M.S., and M.M. are inventors on the patent application PCT/US2019/052515 related to this work.

Figures

None
Graphical abstract
Figure 1
Figure 1
Untargeted Metabolomics Cluster the Weekly Plasma Samples Precisely According to Gestational Age (A) Sampling scheme. Note that validation cohort refers to test set 1 in Table 1. (B) Principal component analysis (PCA) distributed individual samples according to pregnancy stages (based on 9,651 features). The two PCs explaining the largest part of the variation are shown. (C) Plot shows the top 15 increased (red) and decreased (blue) metabolites (with MSI level 1 or 2 identification) in pregnancy. (D and E) Heatmap displays the metabolite signal intensity averaged across individuals, showing the top 68 altered metabolites (D) increased and (E) decreased by the end of pregnancy. Abbreviations are as follows: PP, postpartum. The gestational ages (GAs) were calculated by scaling delivery events to 40 weeks. The week order, which mostly coincides with the actual order, was ordered by hierarchical clustering on the basis of Manhattan distances. The intensities averaged before 14 weeks of all women were used as the baseline. See also Figure S1 and Table S1.
Figure S1
Figure S1
Untargeted Metabolomics for Longitudinal Pregnancy Samples, Related to Figure 1 (A) High-density longitudinal sampling of pregnancies. (B) The Scree plot of the principal component analysis. (C) The PLS-DA result according to the categories of gestational age. GA: gestational age; PP: postpartum. (D and E) Principal component analysis based on all 9,651 features shows that the samples do not separate according to the 30 subjects (D) samples from individual subjects are represented by different colors or experimental batches of Discovery and Validation (Test Set 1) analyzed across two different years (E) samples of the discovery cohort are presented in red; samples of the validation cohort (Test Set 1) are presented in blue. (F) Histogram shows the distribution of slopes in the linear fitting model of the 9,651 features (intensities against the gestational ages). (G) For each of the 30 women, the intensities of an example metabolic feature are shown over the course of gestation, which reveals consistent increases in abundance according to gestational age among 30 subjects, despite individual differences.
Figure S2
Figure S2
Functional Metabolite Groups Altered during Pregnancy, Related to Figure 2 (A) Correlation matrix colored by the Pearson correlation coefficient of each pair of pregnancy-related compounds across samples. (B) The strength, closeness, and betweenness of metabolites in the regularized partial correlation network indicate how important the metabolites are in the network. Metabolite names are listed on the left side ranked by the closeness, with the names of the seven compounds in the prediction models of Figure 4 and Figure 5 (bold).
Figure 2
Figure 2
Functional Metabolite Groups Altered during Pregnancy (A) Regularized partial correlation network of top altered compounds in pregnancy. Here, each node represents a compound, and each edge represents the strength of partial correlation between two compounds after conditioning on all other compounds in the datasets. Edge weights represent the partial correlation coefficients. Note that the seven nodes with red circles with central positions were also the predictors in the models of Figures 4 and 5. (B–E) The average levels of the metabolite changes against the gestational progression in the clusters of steroid hormone biosynthesis (B), phospholipids and DHEA-S (C), long-chain fatty acids (D), and caffeine metabolism (E). The intensities were normalized to the baseline, which was defined by averaging all samples before 14 weeks. The standard errors, derived from 30 subjects, are shown. The GAs were standardized by scaling delivery events to 40 weeks. Abbreviation is as follows: PP, postpartum. Note that the y axis scale is much larger for steroids than for other compounds. See also Figure S2.
Figure 3
Figure 3
System-Wide Reconfiguration of Metabolic Pathways during Pregnancy (A) Metabolic pathways undergoing significant changes during pregnancy. Red dots denote pregnancy-related pathways with FDR < 0.05, which were further analyzed in (B). The topological pathway effects were quantified by using published methods (Xia and Wishart, 2010a). (B) Heatmap shows the temporal changes of pregnancy-related pathway activities during pregnancy and postpartum (PP). To quantify pathway activity, the average intensity of metabolites in each pathway at each time window was calculated. Note that although some pathways contained mainly the metabolites increasing or decreasing during pregnancy, many pregnancy-related pathways contained both metabolites increasing and decreasing. Thus, their average values would not show large changes in the heatmap. For each pathway, the average values from samples earlier than 14 weeks (marked as week 14) were used as the baseline. (C) Human disease states that correlated with pregnancy-related metabolites on the basis of published metabolomics data (Chong et al., 2018). See also Figure S3.
Figure S3
Figure S3
Pregnancy-Related Metabolic Pathways and Metabolite Origin Analysis, Related to Figure 3 (A) Steroid hormone biosynthesis pathway, with metabolite increases (in red) or decreases (in blue) over the course of gestation. (B) Numerous metabolites in plasma that were altered during pregnancy can be traced back to organs by metabolite set enrichment analysis (MSEA). (C) Arachidonic acid metabolism pathway, with metabolite increases (in red) or decreases (in blue) over the course of gestation. (D) The average levels of the 20-HETE and 5-HETE changes against the gestational progression. The intensities were normalized to the baseline, which was defined by averaging all samples before 14 weeks. The standard errors, derived from 30 subjects, are shown. The gestational ages were adjusted by scaling delivery events to 40 weeks. PP, postpartum.
Figure 4
Figure 4
Metabolic Clock Of Pregnancy: Five Metabolites Selected by Machine Learning Can Accurately Predict the Timing of Normal Pregnancy Progression in Both a Discovery and Two Validation Cohorts (A) Design of the analytical pipeline. (B and C) Gestational age (GA) predicted by the linear model consisting of five identified metabolites (GAmetabolic, y axis) highly correlates with clinical values determined by the standard of care (by first-trimester ultrasound [GAultrasound] x axis) in the Discovery (B) and the validation cohort (test set 1) (C). Note that two samples presented as outliers in the validation cohort, possibly because of occasional mass-spectrometry signal instability in given samples. The 95% confidence interval for the linear regression is represented by the gray area. (D) Contribution of the five metabolites to the gestational age prediction model. (E) Gestational age predicted by the five metabolites (GAmetabolic, y axis, scaled) correlates with clinical values determined by the standard of care (by first-trimester ultrasound [GAultrasound] x axis) in the test set 2 cohort. The 95% confidence interval for the linear regression is represented by the gray area. (F–H) Confirmation of the metabolites predicting gestational age in the metabolic clock model by standard compounds, THDOC (F), estriol-16-glucuronide (G), and progesterone (H) (see two additional compounds PE(P-16:0e/0:0) and DHEA-S in Figures S4E and S4F). Measured MS/MS spectral fragmentation profiles (top, in black) matching chemical standards (bottom, in red). Note that the discovery results were from the 10-fold CV to avoid over-fitting (see STAR Methods). See also Figures S4 and S5 and Tables S2–S4.
Figure S4
Figure S4
Metabolites Predict Gestational Age in Machine-Learning Models, Related to Figure 4 (A) Feature selection for predicting gestational age (GA) using metabolomic features. (B and C) GA predicted by metabolic features (GAmetabolic, y axis) highly correlates with clinical values determined by standard of care (by first-trimester ultrasound, GAultrasound, x axis) in the Discovery (B) and the validation cohort (Test Set 1) (C). The 95% confidence interval for the linear regression is represented by the gray area. (D) Feature selection for predicting GA using identified metabolites. (E and F) Measured MS/MS fragmentation profiles (upper) matching of PE(P-16:0e/0:0) (E) and DHEA-S (F) with the MS/MS of standard compounds (lower). GA, gestational age.
Figure S5
Figure S5
Metabolites Selected by Machine Learning Can Accurately Predict Gestational Age before or after 20, 24, 28, 32, and 37 Weeks in Both the Discovery and Validation Cohort (Test Set 1), Related to Figure 4 (A) Summary of prediction models of gestational age (GA) before or after 20, 24, 28, 32, and 37 weeks, using two to three metabolites. Note that the prediction models for 20, 24, and 28 gestational weeks were built using samples from all three trimesters and the ones for late pregnancy (32 and 37 weeks) were build using third-trimester samples. The contribution rank of each predictor in every model is listed as number 1, 2, and 3. Area under the curves (AUCs) in the validation cohort (Test Set 1) are listed. (B) The logistic regression model based on three metabolites can accurately distinguish the third-trimester plasma samples before or after 37 weeks. (C) Contribution of the three metabolites to the prediction model of gestational age before or after 37 weeks. (D) Estriol-16-Glucuronide shows intensity range separations before and after 37 weeks. (E and F) THDOC and androstane-3,17-diol show intensity range separations before/after 37 weeks. (G–J) The logistic regression models can accurately distinguish pregnancy samples before or after 20 (G) 24 (H), and 28 (I) weeks, and the third trimester plasma samples before or after 32 weeks (J). GA, gestational age.
Figure 5
Figure 5
Personal Metabolic Clock of Pregnancy Linked with Timing of Delivery and Fetal Growth (A and B) Highly correlated patterns of the metabolic-clock-predicted gestational age (GAmetabolic) of the five-metabolite model with the gestational age estimated by the first-trimester ultrasound (GAultrasound) at the individual level in the cross validation (A) and test set 1 (B). Note that the outlier sample with negative prediction value in Figure 4C belonged to the last subject of the test set 1 and did not show in the current plot with the y axis scale limitation. (C) The average discrepancies between metabolic-clock-predicted gestational age and ultrasound-estimated gestational age (Δ(GAmetabolic-GAultrasound)) were significantly correlated with the fetal growth deviation from the population by person. All 29 subjects who had baby birth weight information are included here. The 95% confidence interval for the linear regression is represented by the gray area. (D) Average discrepancies between GAmetabolic and GAultrasound (Δ(GAmetabolic-GAultrasound)) were negatively correlated with the actual delivery weeks (by ultrasound-estimation). All 18 subjects who had natural labor onset are included here. Dashed lines marked the ultrasound estimated GA at 40 weeks (due date, black), GAmetabolic one week earlier than the GAultrasound (blue), and GAmetabolic one week later than the GAultrasound (red). The 95% confidence interval for the linear regression is represented by the gray area. (E) Summary of prediction models of 2, 4, and 8 weeks approaching delivery, using two to three metabolites. The contribution rank of each predictor in every model is listed as number 1, 2, and 3. The weeks to delivery were built using samples of the third trimester (> 28 weeks). AUCs in the validation cohort (test set 1) are listed. (F) The logistic regression model based on three metabolites can accurately identify the third-trimester plasma samples approaching the delivery (weeks to delivery [WD] < 2w; only women with natural labor onset included). (G) Contribution of the three metabolites to the prediction model of 2 weeks approaching delivery. (H) Metabolite THDOC showed abundance separations before or after 2 weeks approaching the delivery, except in one subject. See Figure S6 for other metabolites in the model. Note that the discovery results were from the 10-fold CV instead of direct fitting to avoid over-fitting. See also Figure S6 and Table S4.
Figure S6
Figure S6
Identified Compounds Predict Gestational Age and 4 and 8 Weeks Approaching Delivery, Related to Figure 5 (A and B) Histogram shows the distribution of prediction deviation (RMSE) in the cross-validation of the discovery cohort (A) and the validation cohort (B) Test Set 1. (C) The baby birth weight shows correlation with the gestational length (gestational age at childbirth). All 29 subjects who had baby birth weight information are included here. The 95% confidence interval for the linear regression is represented by the gray area. (D and E) Androstane-3,17-diol (D) and estriol-16-Glucuronide (E) show intensity range separations before or after 2 weeks approaching the delivery. (F and G) Measured MS/MS fragmentation profiles (upper) matching of androstane-3,17-diol (F) and 17α-hydroxyprogesterone (G) with the MS/MS of standard compounds (lower). (H and I) The logistic regression models can accurately identify the third trimester plasma samples approaching delivery (weeks to delivery, WD < 4w (H), WD < 8w (I); only includes women with natural labor onset). Note that the discovery results were from the 10-fold cross-validation (CV) instead of direct fitting to avoid over-fitting.

References

    1. Alkema L., Chou D., Hogan D., Zhang S., Moller A.B., Gemmill A., Fat D.M., Boerma T., Temmerman M., Mathers C., Say L., United Nations Maternal Mortality Estimation Inter-Agency Group collaborators and technical advisory group Global, regional, and national levels and trends in maternal mortality between 1990 and 2015, with scenario-based projections to 2030: a systematic analysis by the UN Maternal Mortality Estimation Inter-Agency Group. Lancet. 2016;387:462–474. - PMC - PubMed
    1. Altman N.S. An Introduction to Kernel and Nearest-Neighbor Nonparametric Regression. Am. Stat. 1992;46:175–185.
    1. Bahado-Singh R.O., Akolekar R., Mandal R., Dong E., Xia J., Kruger M., Wishart D.S., Nicolaides K. Metabolomics and first-trimester prediction of early-onset preeclampsia. J Matern Fetal Neonatal Med. 2012;25:1840–1847. - PubMed
    1. Bahado-Singh R.O., Ertl R., Mandal R., Bjorndahl T.C., Syngelaki A., Han B., Dong E., Liu P.B., Alpay-Savasan Z., Wishart D.S. Metabolomic prediction of fetal congenital heart defect in the first trimester. A J Obstet Gynecol. 2014;211:e1–e14. - PubMed
    1. Baumann D., Baumann K. Reliable estimation of prediction errors for QSAR models under model uncertainty using double cross-validation. J. Cheminform. 2014;6:47. - PMC - PubMed

Publication types