. 2020 Aug 20;79(4):546-560.e7.
doi: 10.1016/j.molcel.2020.06.004. Epub 2020 Jun 25.

Selective Translation Complex Profiling Reveals Staged Initiation and Co-translational Assembly of Initiation Factor Complexes

Affiliations

Selective Translation Complex Profiling Reveals Staged Initiation and Co-translational Assembly of Initiation Factor Complexes

Susan Wagner et al. Mol Cell. .

Abstract

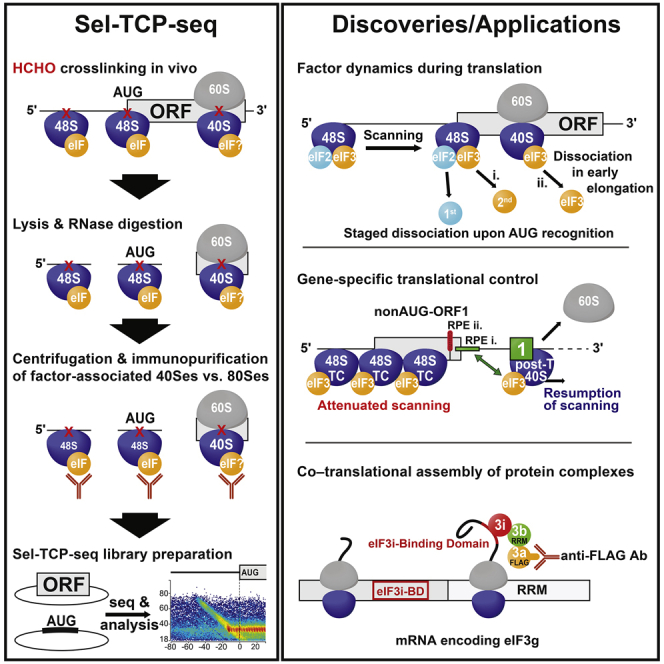
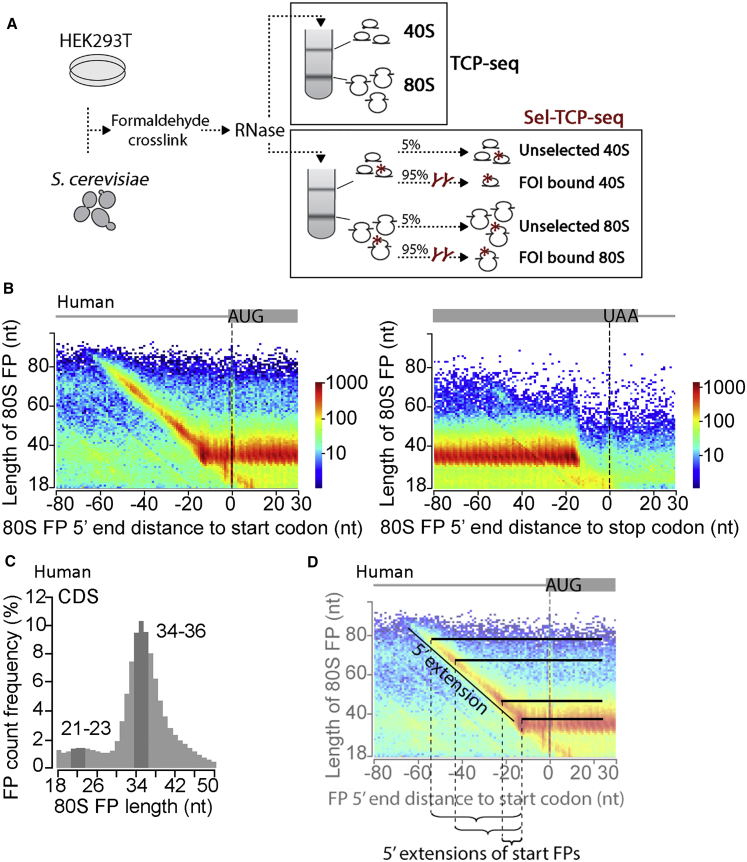
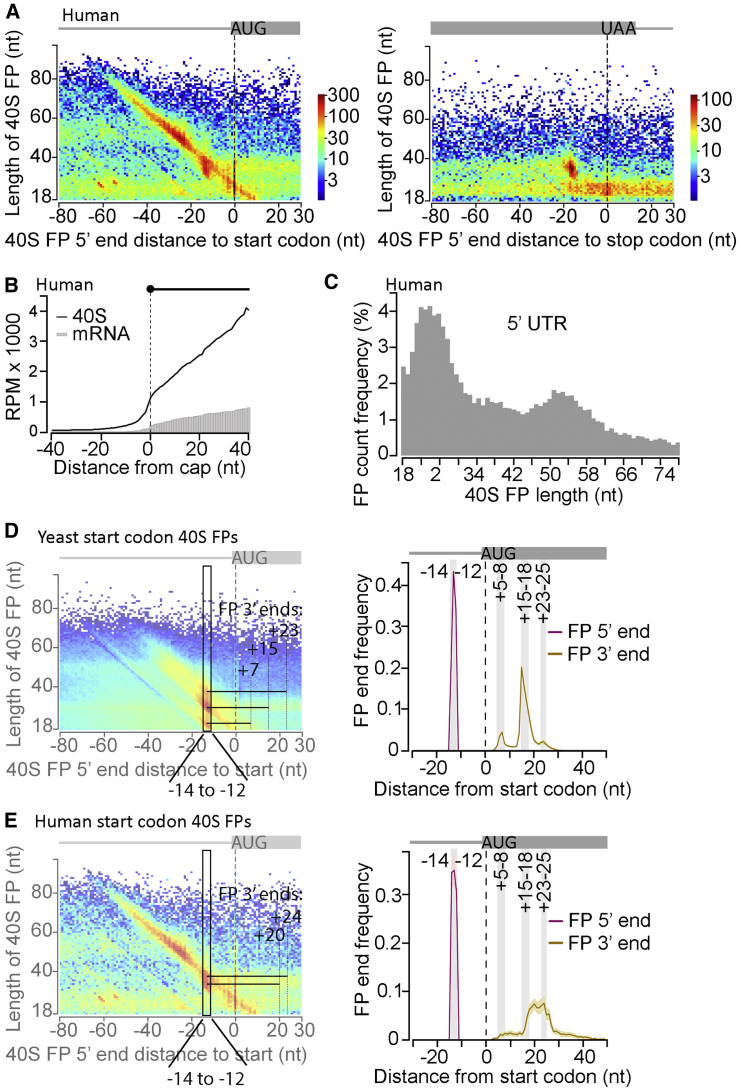
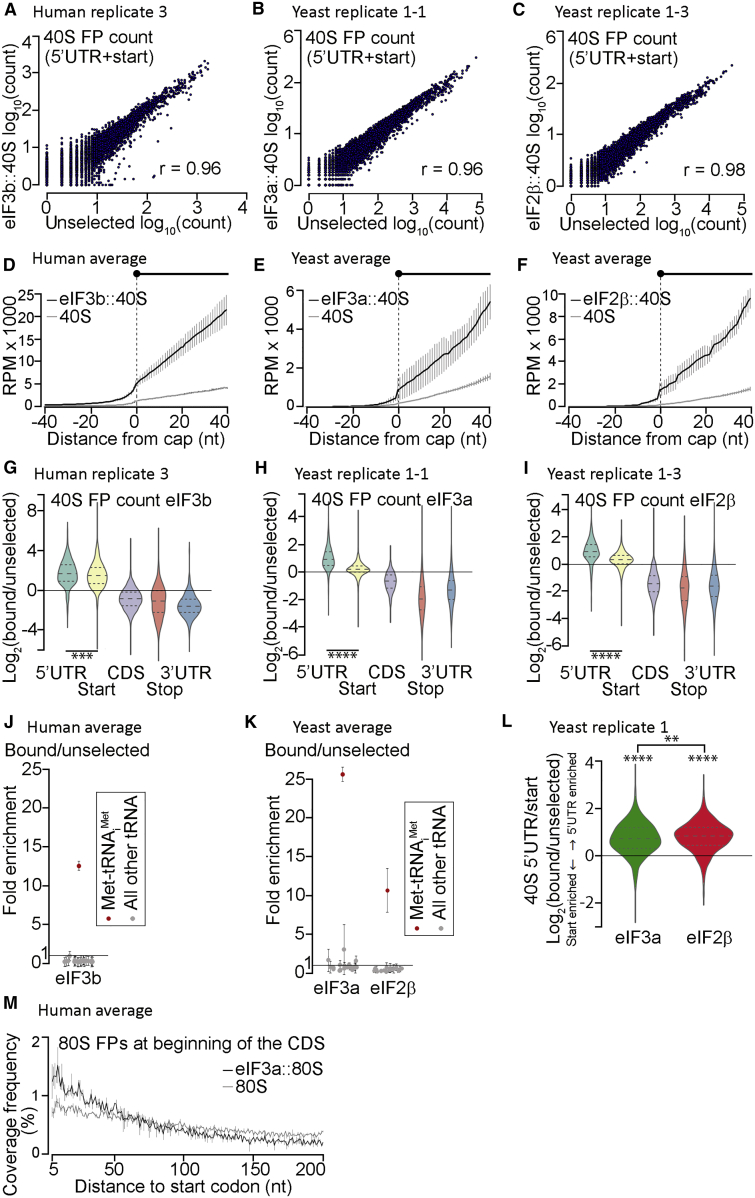
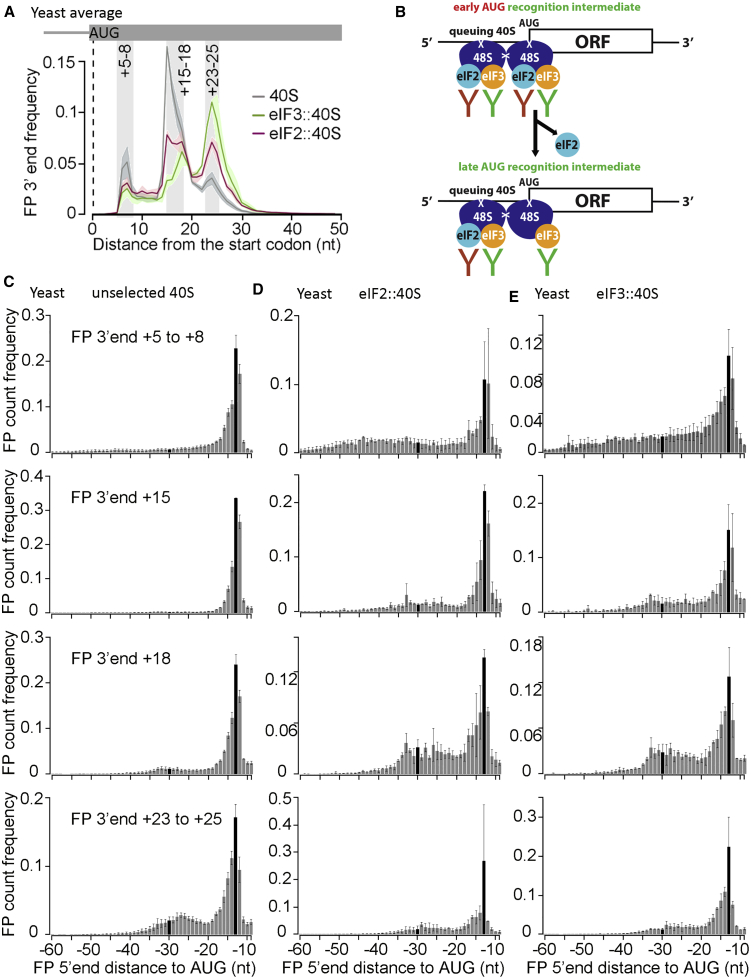
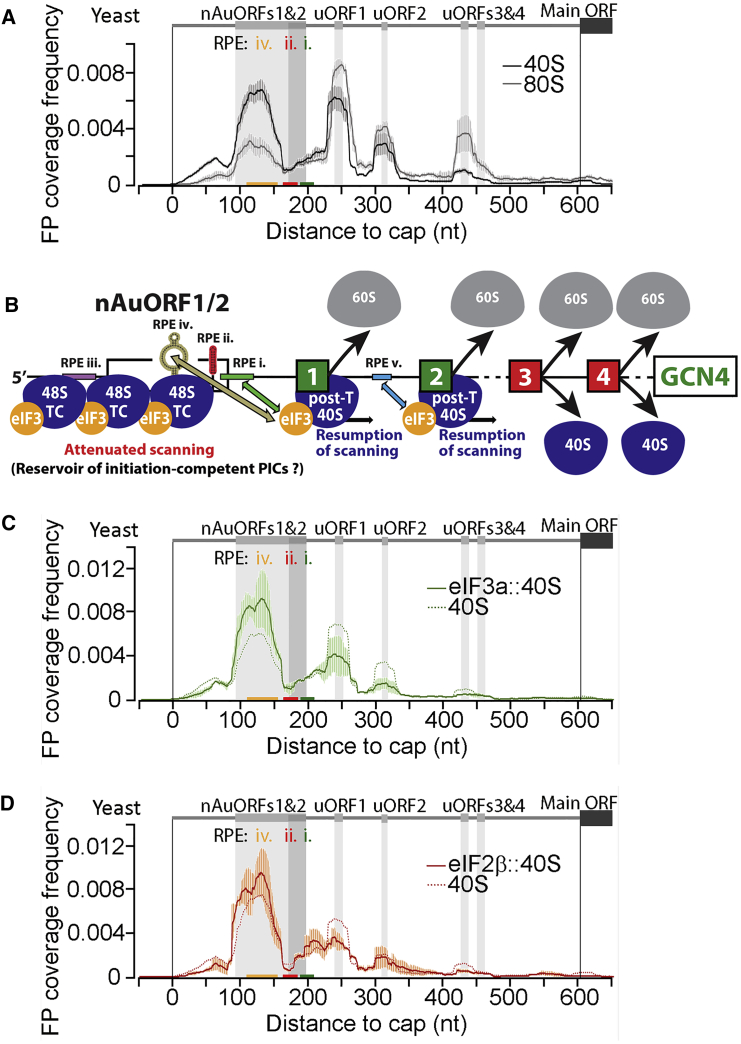
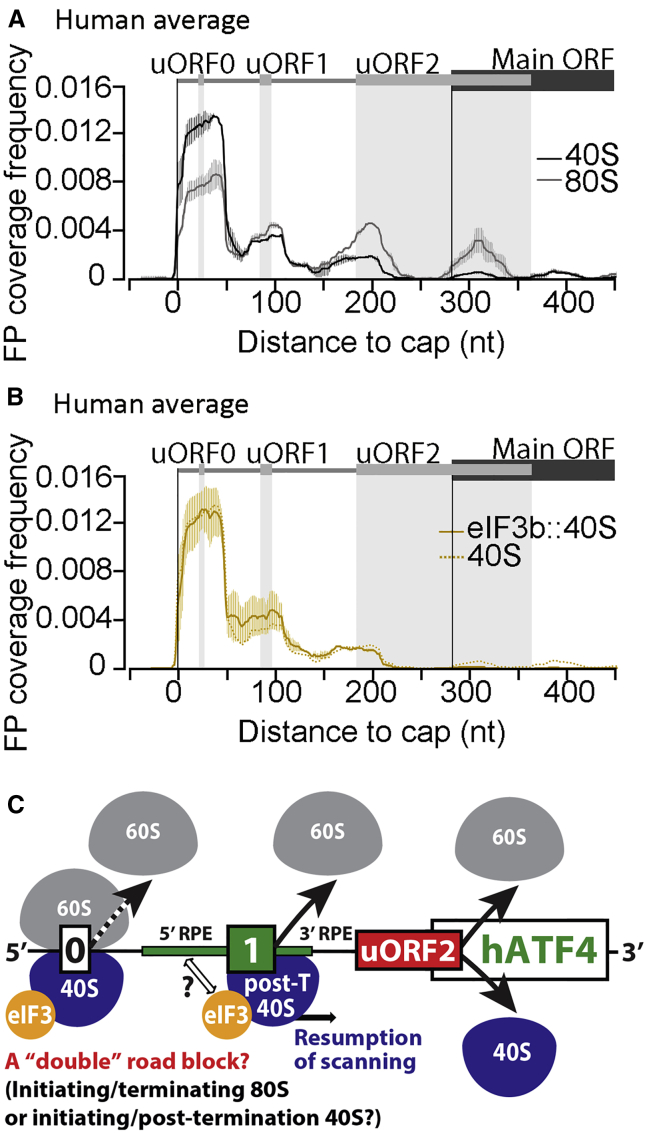
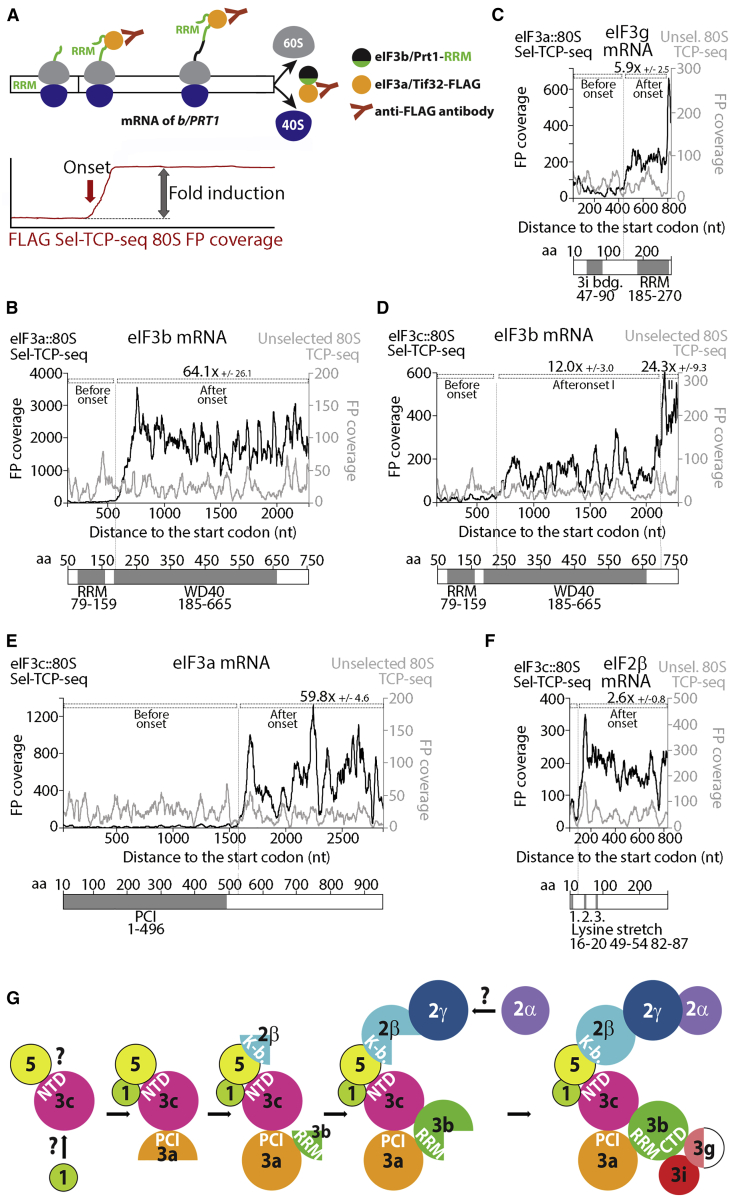
Translational control targeting the initiation phase is central to the regulation of gene expression. Understanding all of its aspects requires substantial technological advancements. Here we modified yeast translation complex profile sequencing (TCP-seq), related to ribosome profiling, and adapted it for mammalian cells. Human TCP-seq, capable of capturing footprints of 40S subunits (40Ss) in addition to 80S ribosomes (80Ss), revealed that mammalian and yeast 40Ss distribute similarly across 5'TRs, indicating considerable evolutionary conservation. We further developed yeast and human selective TCP-seq (Sel-TCP-seq), enabling selection of 40Ss and 80Ss associated with immuno-targeted factors. Sel-TCP-seq demonstrated that eIF2 and eIF3 travel along 5' UTRs with scanning 40Ss to successively dissociate upon AUG recognition; notably, a proportion of eIF3 lingers on during the initial elongation cycles. Highlighting Sel-TCP-seq versatility, we also identified four initiating 48S conformational intermediates, provided novel insights into ATF4 and GCN4 mRNA translational control, and demonstrated co-translational assembly of initiation factor complexes.

Keywords: ATF4; GCN4; Ribo-seq; TCP-seq; UTR; co-translational assembly; eIF2; eIF3; gene expression; mRNA; ribosome; ribosome profiling; translational control.


Conflict of interest statement

Declaration of Interests The authors declare no competing interests.

Figures

None
Graphical abstract
Figure 1
Figure 1
TCP-Seq in Human Cells: Full Ribosome FPs (A) Outline of translation complex profile sequencing (TCP-seq) and selective (Sel)-TCP-seq. 40S, small ribosomal subunit; 80S, ribosome; FOI, factor of interest. (B) Human 80S footprint (FP) length versus 5′ end position relative to the first nucleotide (position 0) of start (left, 10,778 sites) or stop codons (right, 16,803 sites). The color scale represents FP count as indicated on the right. (C) Length distribution of human 80S FPs within 9,241 coding sequences (CDS; excluding start and stop codon-associated FPs). (D) Schematic to facilitate interpretation of (B). Bars illustrate FP lengths as opposed to 5′ end position only. Shown are representative data from biological replicate 3 (see Table S1 for a full listing).
Figure 2
Figure 2
TCP-Seq in Human Cells: Small Ribosomal Subunit FPs (A) Human 40S FP length versus FP 5′ end positions relative to start (left, 10,778 sites) or stop codons (right, 16,803 sites) and count (color scale). (B) Human 40S FP coverage and mRNA coverage (from “regular” RNA-seq) versus distance from transcription start sites (cap; 1,046 mRNAs, excluding start codon-assigned FPs). RPM, reads per million. (C) Length distribution of human 40S FPs assigned to the 5′ UTR of 9,241 mRNAs (excluding start codon-assigned FPs). (D) Yeast start codon-aligned 40S FP 5′ and 3′ end positions (5,994 sites). FPs with 5′ ends between the −14 to −12 positions (black rectangle in left plot) were chosen to display their 3′ end distribution (right; shading around the line indicates the 95th percentiles of random gene-wise resampling). Gray vertical bars on the right indicate discernible 3′ end peaks; see illustrative black bars on the left. (E) As (D) but for human 40S FPs (11,174 start sites). Gray vertical bars in the right plot show yeast 3′ end positions. Human 3′ end distribution peaks at +20 and +24 nt, cf. illustrative black FP bars on the left. Shown are representative data from human biological replicate 3 and yeast replicate 1-1.
Figure 3
Figure 3
Sel-TCP-Seq Detects Staged Dissociation of eIFs from Translation Initiation Complexes (A) Human unselected 40S FP versus eIF3b::40S FP counts per mRNA. r, Pearson correlation coefficient. (B) As (A) but for yeast unselected 40S versus eIF3a::40S. (C) As (A) but for yeast unselected 40S versus eIF2β::40S. (D) Human eIF3b::40S FP and unselected 40S FP coverage aligned to annotated transcription start sites (cap; 1,046 mRNAs, excluding start codon-associated FPs). Averages of replicates 1 and 3 are shown. (E) As (D) but for yeast eIF3a::40S and unselected 40S (198 mRNAs). (F) As (E) but for yeast eIF2β::40S and unselected 40S (198 mRNAs). (E and F) Averages of replicates 1 and 2 are shown. (G) Human eIF3b::40S versus unselected 40S FP count ratios within indicated mRNA regions (n = 1,389; dashed line, median; dotted lines, first and third quartiles; ∗∗∗p < 0.001, two-sample t test). Data from human replicate 3 are shown. (H) As (G) but for yeast eIF3a::40S versus unselected 40S FP count ratios (n = 2,096, ∗∗∗∗p < < 0.0001). Data from yeast replicate 1-1 are shown. (I) As (H) but for yeast eIF2β::40S versus unselected 40S FP count ratios (n = 1,734). Data from yeast replicate 1-3 are shown. (J) Enrichment of tRNA read counts in human eIF3b::40S versus an unselected 40S library. Averages of human replicates 1 and 3 are shown. (K) As (J) but for yeast eIF3a::40S and eIF2β::40S versus the corresponding unselected 40S libraries. Averages of replicates 1 and 2 are shown. (L) Differences in FOI (indicated below the x axis) persistence upon initiation complex arrival at start codons. The ratio of FOI::40S FP counts in the 5′ UTR versus start codon regions of 1,218 mRNAs was divided by the equivalent ratio of unselected 40S FP counts. Both FOI::40S complexes redistribute to 5′ UTRs relative to the unselected 40S (∗∗∗∗p < < 0.0001, one-sample t test), but this is more pronounced for eIF2β than eIF3a (∗∗p < 0.005, two-sample t test). Data from yeast replicate 1 are shown. (M) Human unselected 80S FP and eIF3b::80S FP coverage frequency at the beginning of the CDS of 10,778 mRNAs. Averages of replicates 1 and 3 are plotted. Error bars in (D)–(F), (J), (K), and (M) represent ± standard deviation.
Figure 4
Figure 4
Sel-TCP-Seq Resolves Individual Start Codon Recognition Steps (A) Yeast start codon-aligned, unselected, and FOI::40S FP 3′ end position frequencies (5,994 sites; shading around lines indicates ± standard deviation). Gray vertical bars are shown as in Figure 2D. (B) Suggested influence of queuing 40Ses on co-immunoprecipitation (coIP) efficiency. (C) 5′ end position frequencies of unselected 40S FPs ending at specific 3′ end positions, as indicated to the right of each row. Selection matches the gray bars in (A) but respects partition of the +15 to +18 area into two peaks. For orientation, bars representing the −30 and −13 positions are highlighted in black. Error bars indicate ± standard deviation. (D) As (C) but for eIF2β::40Ss. (E) As (C) but for eIF3a::40Ss. Shown are averages of yeast replicates 1 and 2.
Figure 5
Figure 5
Sel-TCP-Seq Dissects REI-Mediated Control of GCN4 mRNA Translation (A) Yeast unselected 40S and 80S FP coverage frequency along the 5′ UTR of GCN4 mRNA (schematic with regulatory elements shown on top). uORF locations are emphasized by vertical gray shading; positions of REI-promoting elements (RPEs) i, ii, and iv are further indicated by colored bars on the x axis. Averages of replicates 1-1, 1-2, and 1-3 are shown. (B) Schematic of the yeast GCN4 translational control mechanism. (C) As (A) but showing eIF3a::40S FP coverage frequency (the unselected 40S track is indicated as a dashed line). Averages of replicates 1 and 2 are shown. (D) As (C), but eIF2β::40S and unselected 40S tracks are shown. Error bars in (A), (C), and (D) indicate ± standard deviation.
Figure 6
Figure 6
Sel-TCP-Seq Dissects REI-Mediated Control of ATF4 mRNA Translation (A) Human unselected 40S and 80S FP coverage frequency along the ATF4 5′ UTR (schematic with regulatory elements shown on top). uORF locations are emphasized by vertical gray shading. Averages of replicates 1, 2, and 3 are shown. (B) As (A) but showing eIF3b::40S FP coverage frequency (the unselected 40S track is indicated as a dashed line). Averages of replicates 1 and 3 are shown. (C) Schematic of ATF4 translational control. Error bars in (A) and (B) indicate ± standard deviation.
Figure 7
Figure 7
Sel-TCP-Seq Detects Co-translational Assembly within the MFC in Yeast (A) Co-translational interactions between a tagged “bait” FOI (e.g., FLAG-tagged eIF3a) and its nascent assembly “target” (e.g., yeast eIF3b via its RNA recognition motif [RRM]) lead to a characteristic increase of selected 80S FP coverage within the assembly partner CDS. (B–F) FP coverage tracks for selected (black; bait protein indicated on top of the left axis) and unselected 80S FP (gray; right axis) across mRNAs encoding target proteins within the yeast multifactor complex (MFC): eIF3b (B and D), eIF3g (C), eIF3a (E), and eIF2β (F). Domain structures of target MFC subunits are shown under the graphs. Dotted lines indicate the selected 80S FP coverage increase. Tracks from replicate 1 are shown, and average fold induction from 4 or 2 replicates (replicates 1–4 or 1+2) with standard deviation is given for eIF3a-FLAG or eIF3c-FLAG as bait, respectively. Fold induction of the 80S Sel-TCP-seq coverage was normalized to that seen with unselected 80S. (G) Speculative MFC assembly model. Question marks indicate an unknown mode of factor assembly.

Comment in

Similar articles

Cited by

References

    1. Anders S., Pyl P.T., Huber W. HTSeq--a Python framework to work with high-throughput sequencing data. Bioinformatics. 2015;31:166–169. - PMC - PubMed
    1. Archer S.K., Shirokikh N.E., Beilharz T.H., Preiss T. Dynamics of ribosome scanning and recycling revealed by translation complex profiling. Nature. 2016;535:570–574. - PubMed
    1. Asano K., Phan L., Anderson J., Hinnebusch A.G. Complex formation by all five homologues of mammalian translation initiation factor 3 subunits from yeast Saccharomyces cerevisiae. J. Biol. Chem. 1998;273:18573–18585. - PubMed
    1. Asano K., Phan L., Valásek L., Schoenfeld L.W., Shalev A., Clayton J., Nielsen K., Donahue T.F., Hinnebusch A.G. A multifactor complex of eIF1, eIF2, eIF3, eIF5, and tRNA(i)Met promotes initiation complex assembly and couples GTP hydrolysis to AUG recognition. Cold Spring Harb. Symp. Quant. Biol. 2001;66:403–415. - PubMed
    1. Asano K., Shalev A., Phan L., Nielsen K., Clayton J., Valásek L., Donahue T.F., Hinnebusch A.G. Multiple roles for the C-terminal domain of eIF5 in translation initiation complex assembly and GTPase activation. EMBO J. 2001;20:2326–2337. - PMC - PubMed

Publication types

MeSH terms

Substances