. 2020 Sep;190(9):1971-1981.
doi: 10.1016/j.ajpath.2020.06.004. Epub 2020 Jun 23.

The Renin-Angiotensin-Aldosterone System (RAAS) Is One of the Effectors by Which Vascular Endothelial Growth Factor (VEGF)/Anti-VEGF Controls the Endothelial Cell Barrier

Affiliations

The Renin-Angiotensin-Aldosterone System (RAAS) Is One of the Effectors by Which Vascular Endothelial Growth Factor (VEGF)/Anti-VEGF Controls the Endothelial Cell Barrier

Yueru Li et al. Am J Pathol. 2020 Sep.

Abstract

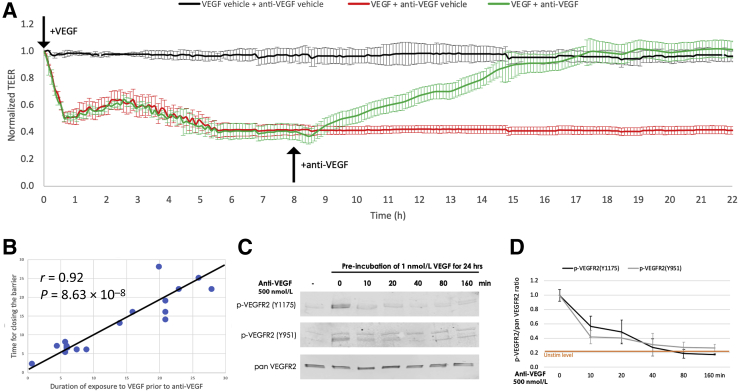
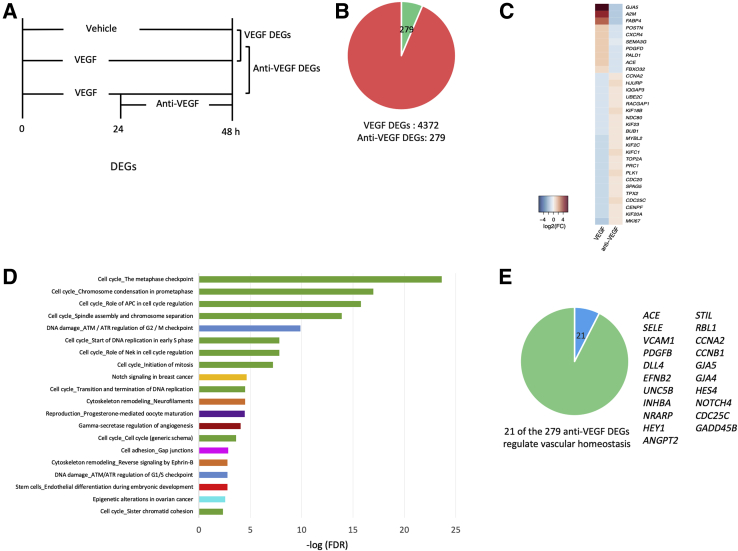
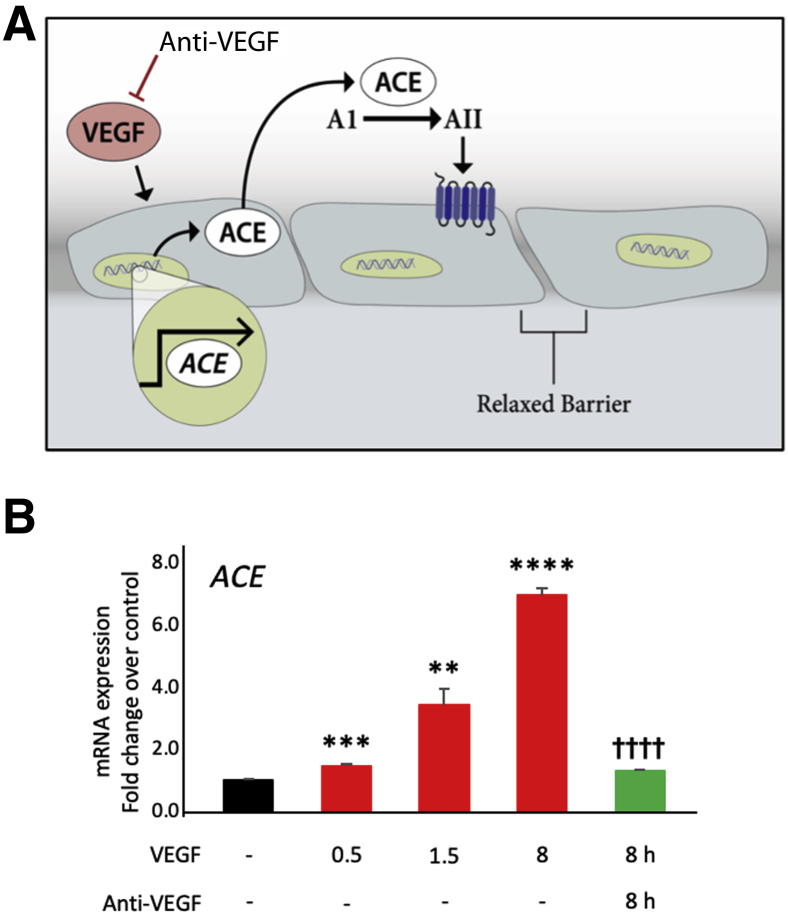
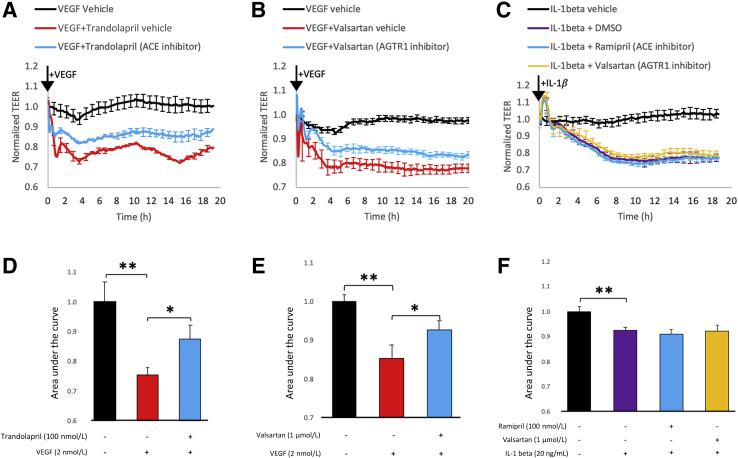
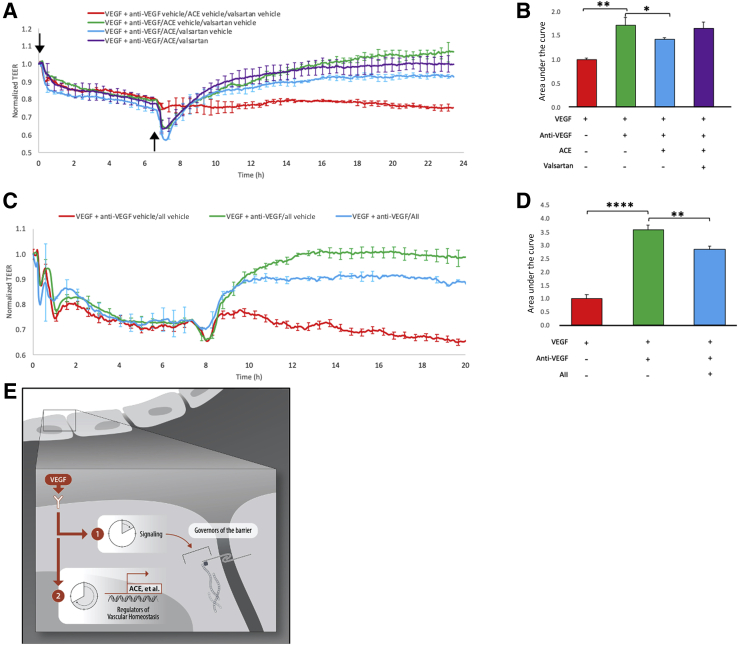
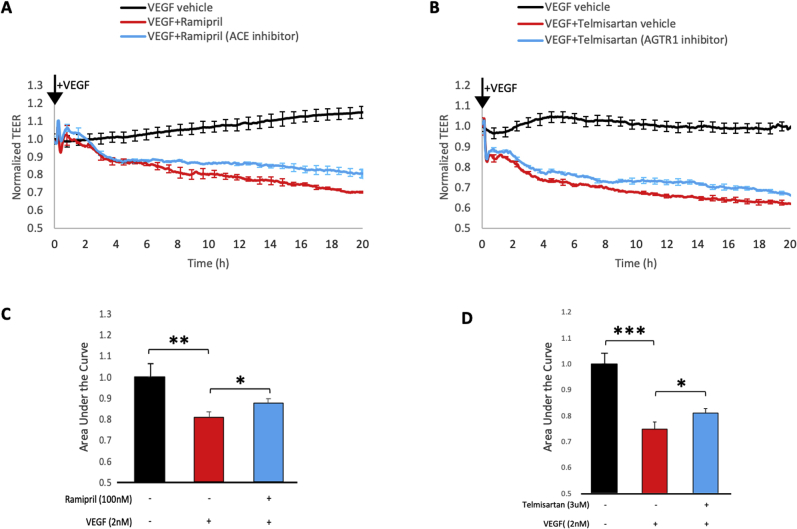
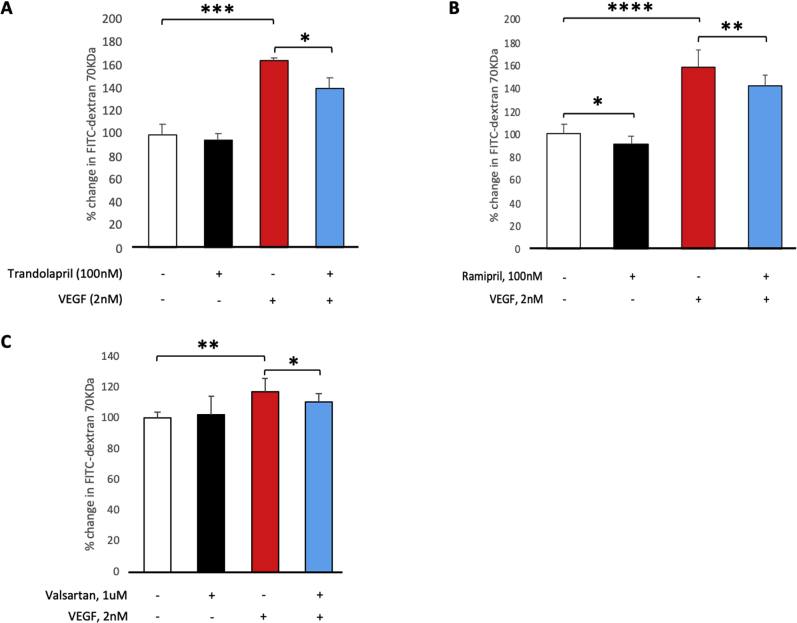
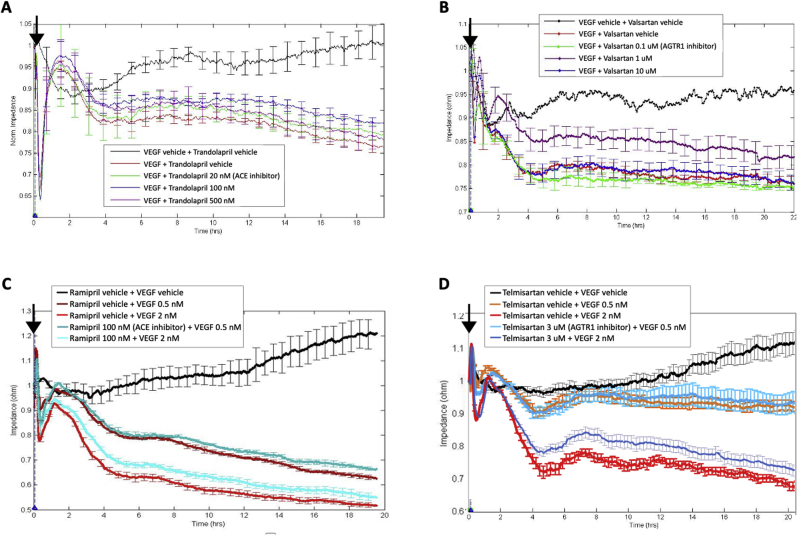
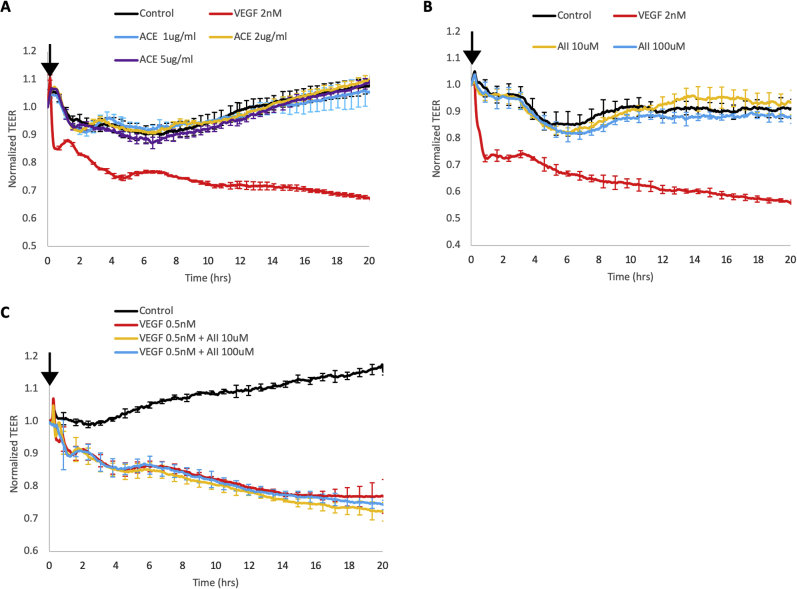
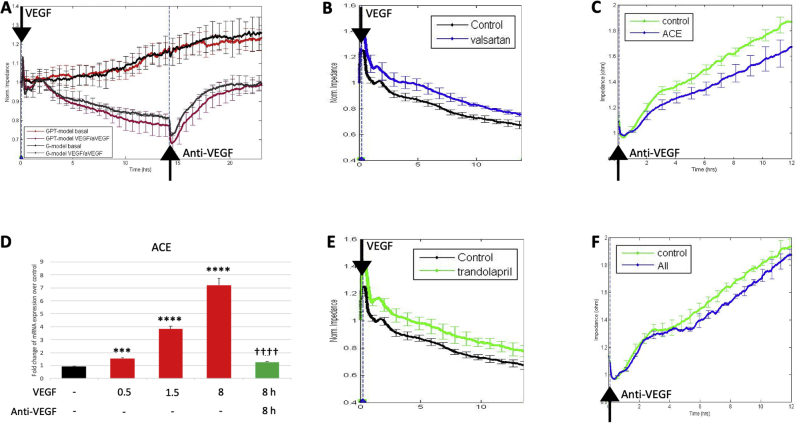
Leakage of retinal blood vessels, which is an essential element of diabetic retinopathy, is driven by chronic elevation of vascular endothelial growth factor (VEGF). VEGF quickly relaxes the endothelial cell barrier by triggering signaling events that post-translationally modify pre-existing components of intercellular junctions. VEGF also changes expression of genes that are known to regulate barrier function. Our goal was to identify effectors by which VEGF and anti-VEGF control the endothelial cell barrier in cells that were chronically exposed to VEGF (hours instead of minutes). The duration of VEGF exposure influenced both barrier relaxation and anti-VEGF-mediated closure. Most VEGF-induced changes in gene expression were not reversed by anti-VEGF. Those that were constitute VEGF effectors that are targets of anti-VEGF. Pursuit of such candidates revealed that VEGF used multiple, nonredundant effectors to relax the barrier in cells that were chronically exposed to VEGF. One such effector was angiotensin-converting enzyme, which is a member of the renin-angiotensin-aldosterone system (RAAS). Pharmacologically antagonizing either the angiotensin-converting enzyme or the receptor for angiotensin II attenuated VEGF-mediated relaxation of the barrier. Finally, activating the RAAS reduced the efficacy of anti-VEGF. These discoveries provide a plausible mechanistic explanation for the long-standing appreciation that RAAS inhibitors are beneficial for patients with diabetic retinopathy and suggest that antagonizing the RAAS improves patients' responsiveness to anti-VEGF.


Figures

Figure 1
Figure 1
Signaling events did not appear to fully account for how vascular endothelial growth factor (VEGF)/anti-VEGF governed the barrier in response to prolonged exposure to VEGF. A: The transendothelial electrical resistance (TEER) of confluent monolayers of human retinal endothelial cells (HRECs) was measured for 8 hours following the addition of either VEGF vehicle or VEGF (1 nmol/L). At the 8-hour timepoint, cells received either anti-VEGF (500 nmol/L aflibercept), or aflibercept buffer, and then TEER was monitored for an additional 14 hours. A high TEER value indicates effective barrier function, that is, low permeability. B: The type of experiment shown in A was repeated, varying the duration of exposure to VEGF prior to addition of anti-VEGF. Plotting the resulting data reveals a linear relationship between the duration of exposure to VEGF and how long it took the barrier to close after adding anti-VEGF; Pearson correlation test: r = 0.92, P = 8.63 × 10⁻⁸. C and D: Confluent monolayers of cells were exposed to VEGF (1 nmol/L) for 24 hours, whereupon anti-VEGF (500 nmol/L aflibercept) was added for the indicated length of time. The cells were lysed, and total cell lysates were subjected to Western blot analysis using the indicated antibodies. A representative experiment is shown in C. The extent of vascular endothelial growth factor receptor 2 (VEGFR2) phosphorylation was quantified and normalized to the level of total VEGFR2. Data are expressed as means ± SD (A and D). n = 3 to 4 (A and D); n = 3 independent experiments (D).
Figure 2
Figure 2
Vascular endothelial growth factor (VEGF) changes the expression of vascular homeostasis genes, and such changes are overcome by anti-VEGF. A: Outline of the experimental strategy. Triplicate dishes of confluent human retinal endothelial cells (HRECs) were exposed to VEGF vehicle, VEGF (1 nmol/L), or VEGF followed by anti-VEGF (500 nmol/L aflibercept) for the indicated duration, whereupon cells were harvested, and RNA was isolated and subjected to RNAseq analysis. Differentially expressed genes (DEGs) were identified by pairwise comparison between experimental groups as indicated in the diagram. B: The resulting RNAseq data are presented as a pie chart. VEGF induces a statistically significant (P < 0.05) change in expression of 4372 genes; these are VEGF DEGs. Anti-VEGF overcame the VEGF-driven change for 279 of these genes; these are the anti-VEGF DEGs. C: A heatmap of the top 32 anti-VEGF DEGs, which are arranged according to the level of fold change (FC). The expression level is indicated by color: blue is low and red is high. D: The 279 anti-VEGF DEGs were subjected to MetaCore-based pathway analysis. The top 20 pathways, sorted according to statistical significance, are presented. The colors designate a type of pathway, for instance, green is for cell cycle. E: The 21 of the 279 anti-VEGF DEGs that are known to govern vascular homeostasis are listed. FDR, false discovery rate.
Figure 3
Figure 3
Temporal alignment of vascular endothelial growth factor (VEGF)/anti-VEGF–induced changes in gene expression and barrier function. A: Diagram of the working hypothesis. VEGF increases expression of angiotensin-converting enzyme (ACE) and thereby converts angiotensin I (AI) into angiotensin II (AII), which binds to its receptor (encoded by the AGTR1 gene) and relaxes the barrier. By neutralizing VEGF, anti-VEGF reduces expression of ACE and thereby restores barrier function. B: Triplicate dishes of cells treated as described in the legend of Figure 1A were harvested, and RNA was extracted and subjected to quantitative RT-PCR using primers specific for ACE. The level of expression in unstimulated cells (black bar) was set to 1.0. For VEGF-treated cells (red bars), the data are expressed as fold increase over unstimulated cells. The green bars indicate the expression in cells that were first treated with VEGF and then anti-VEGF. Similar results are observed in three independent experiments. Data are expressed as means ± SD (B). n = 3 (B). ∗∗P < 0.01, ∗∗∗P < 0.001, and ∗∗∗∗P < 0.0001 versus unstimulated cells; ††††P < 0.0001 versus anti-VEGF.
Figure 4
Figure 4
Antagonizing renin-angiotensin-aldosterone system (RAAS) attenuates vascular endothelial growth factor (VEGF)-induced relaxation of the endothelial barrier. Transendothelial electrical resistance (TEER) measurements of VEGF-stimulated human retinal endothelial cells (HRECs) pretreated with trandolapril (ACE inhibitor) (A and D) or valsartan (AGTR1 inhibitor) (B and E). Following a 2-hour pre-treatment with trandolapril (100 nmol/L), valsartan (1 μmol/L), or drug vehicle [dimethyl sulfoxide (DMSO)], 2 nmol/L of VEGF was added (black arrows), and TEER recorded for 20 hours. Data are expressed as a fraction of basal TEER, which was measured at the 0 time point. D and E: The area under the curve for the entire time course was quantified, normalized to the VEGF vehicle-treated cells. C and F: Same as panels A, B, D, and E, except that the cells were exposed to IL-1β (20 ng/mL) instead of VEGF. Similar results are observed in at least three independent experiments. Data are expressed as the means ± SD for a single representative experiment. ∗P < 0.05, ∗∗P < 0.01. ACE, angiotensin I converting enzyme; AGTR1, angiotensin II receptor type 1.
Figure 5
Figure 5
Activating the renin-angiotensin-aldosterone system (RAAS) diminishes anti-vascular endothelial growth factor (VEGF)–mediated closure of the barrier. A and C: The transendothelial electrical resistance (TEER) was measured as described in the legend of Figure 1A for cells exposed to VEGF (2 nmol/L) for about 7 hours followed by either anti-VEGF vehicle, anti-VEGF, anti-VEGF together with purified angiotensin I converting enzyme (ACE) (A) and valsartan (C), or anti-VEGF together with angiotensin II (AII; 100 μmol/L). Data are expressed as fraction of the starting (basal) TEER value (0 time point). Arrows indicate when VEGF and anti-VEGF were added. B and D: The area under the curve in A and C was quantified and normalized to the group that received VEGF alone. E: VEGF activates its receptor and quickly engages signaling events that act on preexisting components of intracellular junctions to relax the barrier. Continued exposure to VEGF leads to changes in expression of genes that code for proteins that are also capable of regulating barrier function. Data are expressed as means ± SD. ∗P < 0.05, ∗∗P < 0.01, and ∗∗∗∗P < 0.0001. n = 3 (AD).
Supplemental Figure S1
Renin-angiotensin-aldosterone system (RAAS) inhibitors prevent maximal barrier relaxation in response to vascular endothelial growth factor (VEGF). Transendothelial electrical resistance (TEER) measurements of VEGF-stimulated human retinal endothelial cells (HRECs) pre-treated with ramipril (ACE inhibitor) (A and C) or telmisartan (AGTR1 inhibitor) (B and D). Following a 2-hour pre-treatment with ramipril (100 nmol/L), telmisartan (3 μmol/L), or drug vehicle (dimethyl sulfoxide), 2 nmol/L VEGF was added (arrows), and TEER recorded for 20 hours. Data are expressed as a fraction of basal TEER, which was measured at the 0 time point. The area under the curve for the entire time course was quantified and then normalized to the VEGF vehicle–treated cells (C and D). Similar results are observed in at least three independent experiments. Data are expressed as means ± SD for a single representative experiment. ∗P < 0.05, ∗∗P < 0.01, and ∗∗∗P < 0.001. ACE, angiotensin I converting enzyme; AGTR1, angiotensin II receptor type 1.
Supplemental Figure S2
Fluorescein isothiocyanate (FITC)-dextran-based evaluation of permeability confirms that renin-angiotensin-aldosterone system (RAAS) antagonists attenuate vascular endothelial growth factor (VEGF)-dependent relaxation of the endothelial barrier. Confluent monolayers of human retinal endothelial cells (HRECs) in Transwell chambers were pretreated with trandolapril (100 nmol/L) (A), ramipril (100 nmol/L) (B), or valsartan (1 μmol/L) (C) for 2 hours, VEGF (2 nmol/L) was added and permeability to FITC-dextran (70 kDa) was measured after 15-18 hours as described in Materials and Methods. The data are expressed as a percentage of unstimulated cells. At least three independent experiments demonstrated that all three of RAAS antagonists attenuate VEGF-induced permeability. In contrast to the transendothelial electrical resistance (TEER)-based studies, that trandolapril (not significantly) and ramipril (significantly) reduce basal permeability. Cells in basal conditions are cultured in complete Lonza medium that contains a low amount of VEGF (0.05 nmol/L; 2 ng/mL), which slightly improves the barrier function of cells (data not shown). Consequently, the effect of RAAS pathway inhibition on basal permeability may be due to antagonizing VEGF-driven relaxation of the barrier under these conditions. Data are expressed as means ± SD. n = 8 replicates from a representative experiment. ∗P < 0.05, ∗∗P < 0.01, ∗∗∗P < 0.001, and ∗∗∗∗P < 0.0001.
Supplemental Figure S3
Increasing or decreasing the dose of the renin-angiotensin-aldosterone system (RAAS) inhibitors (A and B) or lowering the dose of vascular endothelial growth factor (VEGF), so that the barrier was only partially compromised (C and D), did not increase the magnitude of their effect. A and B: Transendothelial electrical resistance (TEER) measurements of VEGF-stimulated human retinal endothelial cells (HRECs) pre-treated with different dosage of trandolapril (ACE inhibitor) (A) or valsartan (AGTR1 inhibitor) (B). Following a 2-hour pre-treatment with trandolapril (20, 100, and 500 nmol/L), valsartan (0.1, 1, and 10 μmol/L), or drug vehicle (dimethyl sulfoxide), 2 nmol/L of VEGF was added (indicated by the arrow) and TEER recorded for about 20 hours. C and D: TEER measurements of pre-treated HRECs induced by a submaximal level of VEGF (0.5 nmol/L). Following a 2 hours pre-treatment with ramipril (100 nmol/L) (C) or telmisartan (3 μmol/L) (D), 0.5 nmol/L of VEGF was added (arrows) and TEER recorded for about 20 hours. Data are expressed as a fraction of basal TEER, which was measured at the 0 time point. Data are expressed as means ± SD. ACE, angiotensin I converting enzyme; AGTR1, angiotensin II receptor type 1.
Supplemental Figure S4
Activators of the renin-angiotensin-aldosterone system (RAAS) were unable to relax the barrier or enhance vascular endothelial growth factor (VEGF)-driven permeability. A: Transendothelial electrical resistance (TEER) measurements of human retinal endothelial cells (HRECs) stimulated with either vehicle, 2 nmol/L of VEGF, or different concentrations of purified ACE. B: TEER measurements of HRECs stimulated with either vehicle, 2 nmol/L of VEGF, or different concentrations of purified angiotensin II (AII). C: TEER measurements of HRECs stimulated with either vehicle, 0.5 nmol/L VEGF, or 0.5 nmol/L of VEGF together with different concentrations of exogenous AII. Black arrows indicate the time when the drugs were added. Data are expressed as a fraction of the starting (basal) TEER value (0 time point). Data are expressed as means ± SD. n = 3 (AC). ACE, angiotensin I converting enzyme.
Supplemental Figure S5
The renin-angiotensin-aldosterone system (RAAS) contributes to vascular endothelial growth factor (VEGF)/anti-VEGF–mediated control of barrier function in an alternative in vitro model of diabetes mellitus (DM)-induced endothelial dysfunction. A: High-glucose–treated cells were stimulated and transendothelial electrical resistance (TEER) was measured exactly as described in Figure 1A (G-model basal; G-model VEGF/aVEGF). Alternatively, high-glucose–treated cells were pre-exposed for 24 hours to palmitate (50 μmol/L) and tumor necrosis factor-beta (TNFβ) (0.1 ng/mL) (GPT-model basal; GPT-model VEGF/aVEGF), then stimulated, and TEER was measured. B and E: Same as Figure 4, A and B, except that cells were subjected to the GPT model instead of the G model as was done in Figure 4. C and F: Same as Figure 5 and Supplemental Figure S3, except cells were subjected to the GPT model instead of the G model as was done in Figure 5 and Supplemental Figure S3. D: Quantitative RT-PCR analysis of angiotensin I converting enzyme (ACE) was performed, and the resulting data were analyzed exactly as for Figure 3B, except instead of the G-model (exposure for at least 10 days of 30 mmol/L glucose), cells were subjected to the GPT model (at least 10 days of high glucose followed by exposure for 24 hours to palmitate (50 μmol/L) and TNFβ (0.1 ng/mL). The level of expression in unstimulated cells (black bars) was set to 1.0. For VEGF-treated cells (red bars), the data are expressed as fold increase over unstimulated cells. Green bars indicate the expression in cells that were first treated with VEGF and then anti-VEGF. Similar results were observed in three independent experiments. Data are expressed as a fraction of the starting (basal) TEER value (0 time point) (A). Data are expressed as means ± SD (A). n = 3 (A). ∗∗∗P < 0.001, ∗∗∗∗P < 0.0001 versus unstimulated cells; ††††P < 0.0001 versus anti-VEGF group.

Similar articles

Cited by

References

    1. Stitt A.W., Curtis T.M., Chen M., Medina R.J., McKay G.J., Jenkins A., Gardiner T.A., Lyons T.J., Hammes H.P., Simo R., Lois N. The progress in understanding and treatment of diabetic retinopathy. Prog Retin Eye Res. 2016;51:156–186. - PubMed
    1. Hamilton S.J., Watts G.F. Endothelial dysfunction in diabetes: pathogenesis, significance, and treatment. Rev Diabet Stud. 2013;10:133–156. - PMC - PubMed
    1. Cheung N., Mitchell P., Wong T.Y. Diabetic retinopathy. Lancet. 2010;376:124–136. - PubMed
    1. Yau J.W.Y., Rogers S.L., Kawasaki R., Lamoureux E.L., Kowalski J.W., Bek T., Meta-Analysis for Eye Disease (META-EYE) Study Group Global prevalence and major risk factors of diabetic retinopathy. Diabetes Care. 2012;35:556–564. - PMC - PubMed
    1. UK Prospective Diabetes Study Group Tight blood pressure control and risk of macrovascular and microvascular complications in type 2 diabetes: UKPDS 38. UK Prospective Diabetes Study Group. BMJ. 1998;317:703–713. - PMC - PubMed

Publication types

MeSH terms

Substances