

Evaluation of Opportunities and Limitations of Mid-Infrared Skin Spectroscopy for Noninvasive Blood Glucose Monitoring
- PMID: 32590911
- PMCID: PMC7780363
- DOI: 10.1177/1932296820936224
Evaluation of Opportunities and Limitations of Mid-Infrared Skin Spectroscopy for Noninvasive Blood Glucose Monitoring
Abstract
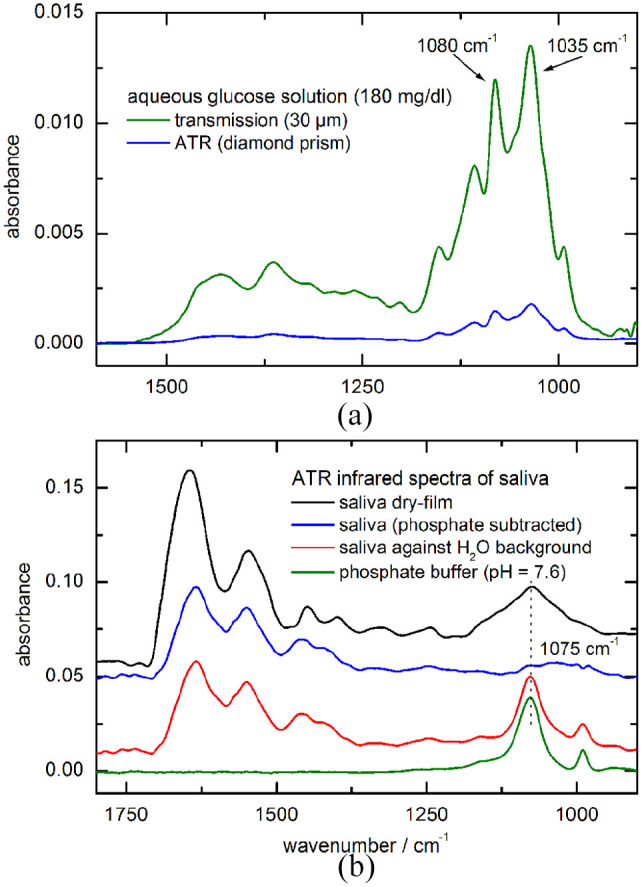
Background: A wide range of optical techniques has recently been presented for the development of noninvasive methods for blood glucose sensing based on multivariate skin spectrum analysis, and most recent studies are reviewed in short by us. The vibrational spectral fingerprints of glucose, as especially found in the mid-infrared or Raman spectrum, have been suggested for achieving largest selectivity for the development of noninvasive blood glucose methods.
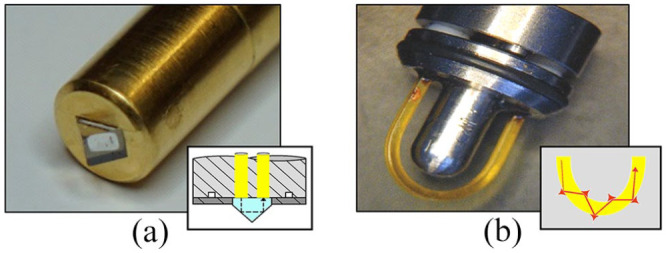
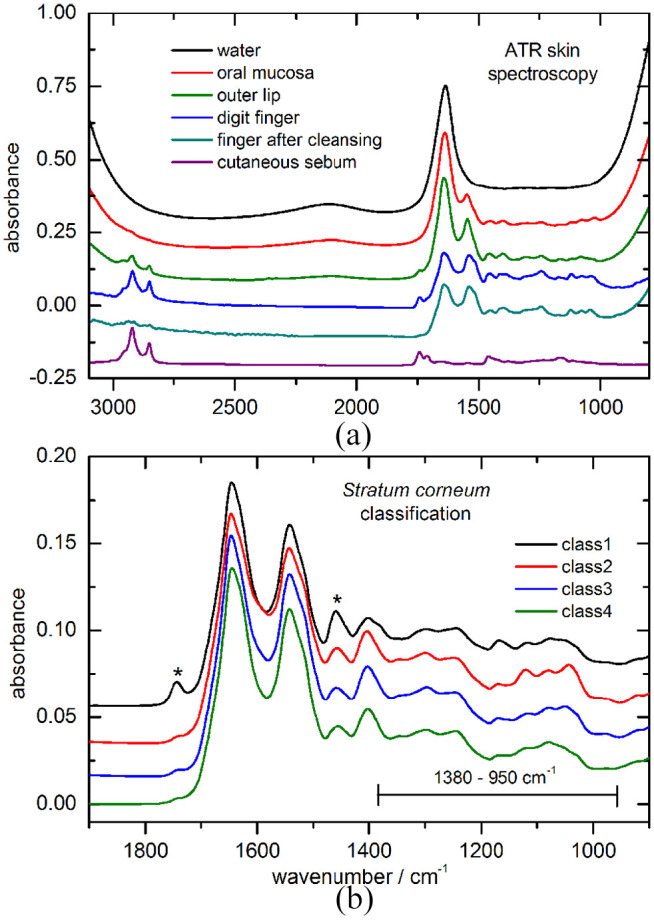
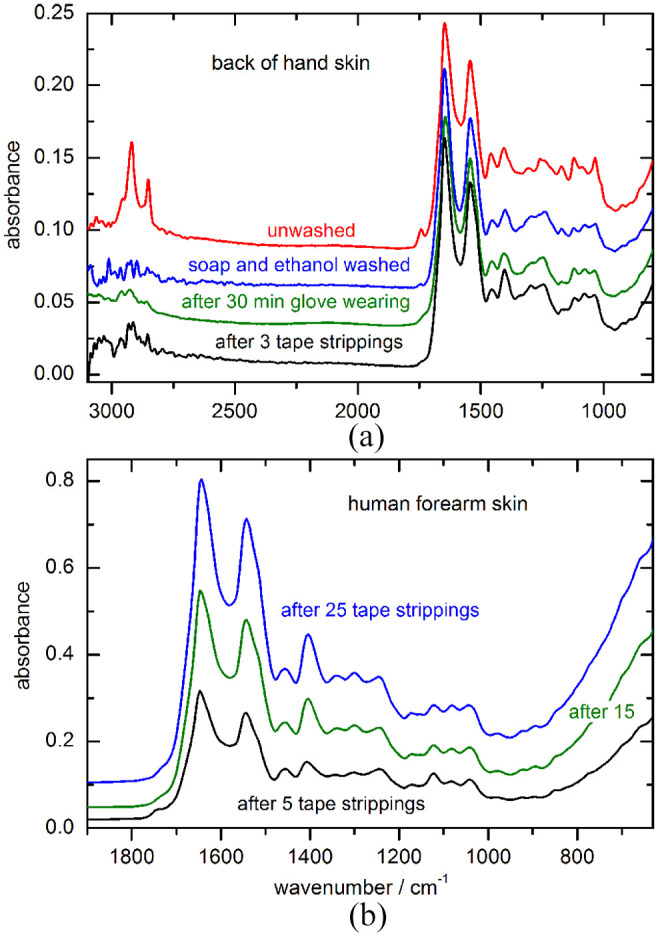
Methods: Here, the different aspects on integral skin measurements are presented, which are much dependent on the absorption characteristics of water as the main skin constituent. In particular, different mid-infrared measurement techniques as realized recently are discussed. The limitations of the use of the attenuated total reflection technique in particular are elaborated, and confounding skin or saliva spectral features are illustrated and discussed in the light of recently published works, claiming that the attenuated total reflection technique can be utilized for noninvasive measurements.
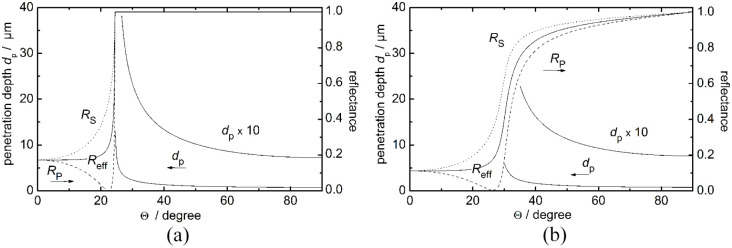
Results: It will be shown that the penetration depth of the infrared radiation with wavelengths around 10 µm is the essential parameter, which can be modulated by different measurement techniques as with photothermal or diffuse reflection. However, the law of physics is limiting the option of using the attenuated total reflection technique with waveguides from diamond or similar optical materials.
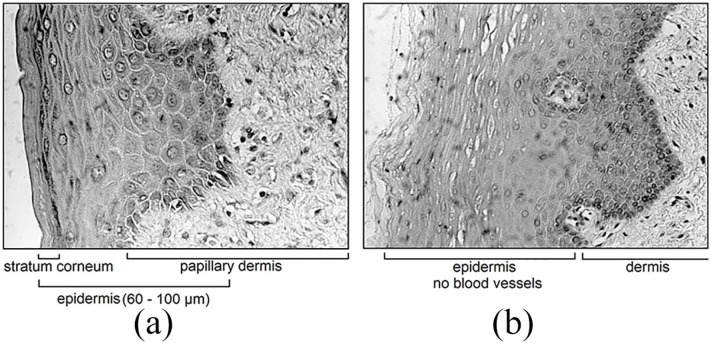
Conclusions: There are confounding features from mucosa, stratum corneum, or saliva, which have been misinterpreted for glucose measurements. Results of an earlier study with multivariate evaluation based on glucose fingerprint features are again referred to as a negative experimental proof.
Keywords: attenuated total reflection; in vivo spectroscopy; mid-infrared spectroscopy; noninvasive blood glucose assays; penetration depth simulation; skin and oral mucosa.
Conflict of interest statement
Figures
References
-
- Heise HM. Glucose measurements by vibrational spectroscopy. In: Chalmers JM, Griffiths PR. (eds) Handbook of Vibrational Spectroscopy, Vol. 5 (Applications in Life, Pharmaceutical and Natural Sciences). Chichester: Wiley; 2002:3280-3294.
-
- Delbeck S, Vahlsing T, Leonhardt S, Steiner G, Heise HM. Non-invasive monitoring of blood glucose using optical methods for skin spectroscopy – opportunities and recent advances. Anal Bioanal Chem. 2019;411:63-77. - PubMed
-
- Yadav J, Rani A, Singh V, Murari BM. Prospects and limitations of non-invasive blood glucose monitoring using near-infrared spectroscopy. Biomed Signal Process Control. 2015;18:214-227.
Publication types
MeSH terms
Substances
LinkOut - more resources
Full Text Sources
Medical
