. 2020 Jun 26;5(48):eabd2071.
doi: 10.1126/sciimmunol.abd2071.

Phenotype and kinetics of SARS-CoV-2-specific T cells in COVID-19 patients with acute respiratory distress syndrome

Affiliations

Phenotype and kinetics of SARS-CoV-2-specific T cells in COVID-19 patients with acute respiratory distress syndrome

Daniela Weiskopf et al. Sci Immunol. .

Abstract

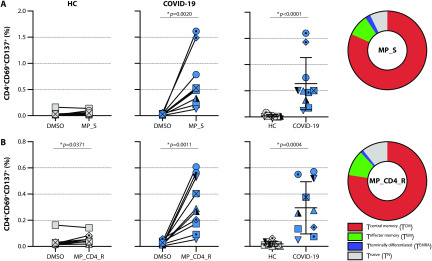
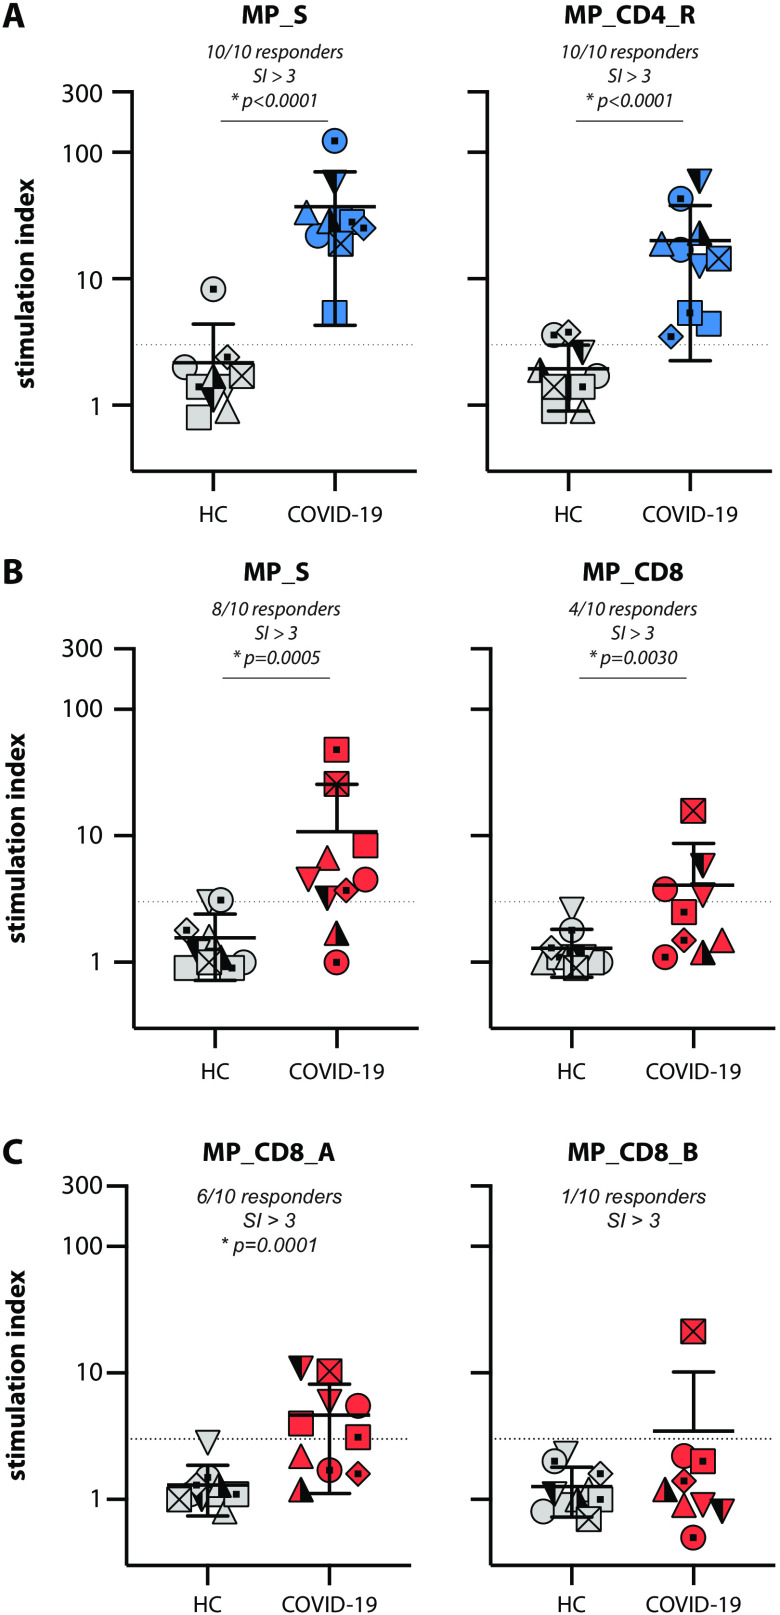
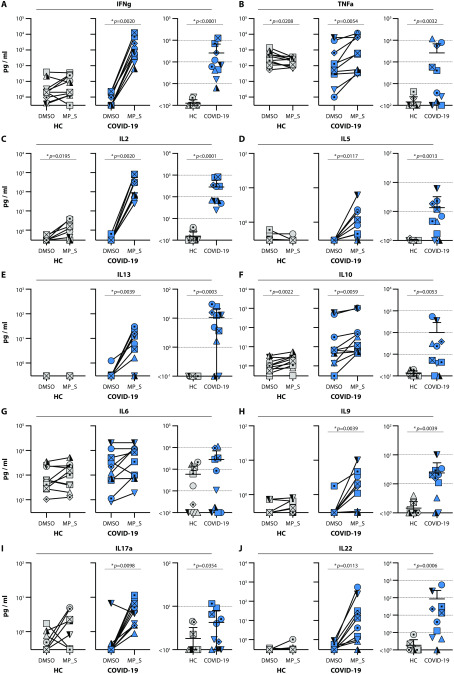
SARS-CoV-2 has been identified as the causative agent of a global outbreak of respiratory tract disease (COVID-19). In some patients the infection results in moderate to severe acute respiratory distress syndrome (ARDS), requiring invasive mechanical ventilation. High serum levels of IL-6, IL-10 and an immune hyperresponsiveness referred to as a 'cytokine storm' have been associated with poor clinical outcome. Despite the large numbers of COVID-19 cases and deaths, information on the phenotype and kinetics of SARS-CoV-2-specific T cells is limited. Here, we studied 10 COVID-19 patients who required admission to an intensive care unit and detected SARS-CoV-2-specific CD4+ and CD8+ T cells in 10 out of 10 and 8 out of 10 patients, respectively. We also detected low levels of SARS-CoV-2-reactive T cells in 2 out of 10 healthy controls not previously exposed to SARS-CoV-2, which is indicative of cross-reactivity due to past infection with 'common cold' coronaviruses. The strongest T-cell responses were directed to the spike (S) surface glycoprotein, and SARS-CoV-2-specific T cells predominantly produced effector and Th1 cytokines, although Th2 and Th17 cytokines were also detected. Furthermore, we studied T-cell kinetics and showed that SARS-CoV-2-specific T cells are present relatively early and increase over time. Collectively, these data shed light on the potential variations in T-cell responses as a function of disease severity, an issue that is key to understanding the potential role of immunopathology in the disease, and also inform vaccine design and evaluation.


Figures

Fig. 1
Fig. 1. Clinical overview of moderate to severe COVID-19 ARDS patients.
(A) Onset of symptoms, hospitalization status, treatment and follow-up of n=10 COVID-19 ARDS patients included in this study. PBMC samples were obtained weekly after admission to the study. Symbols shown next to the cases match throughout all figures. (B) Percentages of CD3+ T cells within the total LIVE gate measured by flow cytometry performed on PBMC collected 14 days post inclusion. (C) CD4:CD8 ratios measured by flow cytometry performed on PBMC collected 14 days post inclusion. Panels b and c show individual values for n=10 patients versus n=10 HC, as well as the mean ± SD. Asterisk denotes a significant difference. HC = healthy control.
Fig. 2
Fig. 2. SARS-CoV-2-specific CD4+ T-cell responses in COVID-19 ARDS patients.
(A, B) Antigen-specific activation of CD4+ T cells after stimulation for 20 hours with MP_S (A) and MP_CD4_R (B), measured via cell surface expression of CD69 and CD137 (gating in Fig. S1). Two left panels show activation percentages (within CD3+CD4+) obtained with the vehicle control (DMSO) and specific stimulation (MP) for HC and COVID-19 patients. The third panel shows the specific activation percentages corrected by subtracting the background present in the DMSO stimulation to allow comparison of both groups. The fourth panel shows the memory phenotype of the CD69+CD137+ responder cells in a donut diagram. Panels show individual values for n=10 patients versus n=10 HC, as well as the mean ± SD. Asterisk denotes a significant difference. HC = healthy control. Symbol shapes of COVID-19 patients are identical between panels, and refer back to Fig. 1.
Fig. 3
Fig. 3. SARS-CoV-2-specific CD8+ T-cell responses in COVID-19 ARDS patients.
(A, B, C, D) Antigen-specific activation of CD8+ T cells after stimulation for 20 hours with MP_S (A), MP_CD8_A (C), and MP_CD8_B, measured via cell surface expression of CD69 and CD137 (gating in Fig. S1). MP_CD8 panels (B) show the concatenated responses from panels C and D. Two left panels show activation percentages (within CD3+CD8+ gate) obtained with the vehicle control (DMSO) and specific stimulation (MP) for HC and COVID-19 patients. The third panel shows the specific activation percentages corrected by subtracting the background present in the DMSO stimulation to allow comparison of both groups. The fourth panel shows the memory phenotype of the CD69+CD137+ responder cells in a donut diagram. Panels show individual values for n=10 patients versus n=10 HC, as well as the mean ± SD. Asterisk denotes a significant difference. HC = healthy control. Symbol shapes of COVID-19 patients are identical between panels, and refer back to Fig. 1.
Fig. 4
Fig. 4. Stimulation index identifies specific responders.
Antigen-specific activation of CD4+ (A) and CD8+ T cells (B,C) in COVID-19 patients after stimulation for 20 hours with peptide MegaPools (MP) shown as stimulation index (SI). Stimulation index is derived by dividing the percentage obtained with specific stimulation (MP) by the percentage obtained with the vehicle control (DMSO). Values for respective stimulations are shown in Fig. 2 (CD4+, color coded in blue) and Fig. 3 (CD8+, color coded in red). Donors with a SI > 3 (dotted line) are regarded as responders to MP stimulation. Panels show individual values for n=10 patients vs. n=10 HC, as well as the mean ± SD. Asterisk denotes a significant difference. HC = healthy control. Symbol shapes of COVID-19 patients are identical between panels, and refer back to Fig. 1.
Fig. 5
Fig. 5. SARS-CoV-2-specific cytokine production in COVID-19 ARDS patients.
(A-J) Antigen-specific production of cytokines measured in cell culture supernatants from PBMC obtained 14 days post ICU admission stimulated (20 hours) with MP_S. Two left panels show quantities obtained with the vehicle control (DMSO) and specific stimulation (MP) for HC and COVID-19 patients. The third panel shows the quantity corrected by subtracting the background present in the DMSO stimulation to allow comparison of both groups. Panels show individual values for n=10 patients versus n=10 HC, as well as the geometric mean. Asterisk denotes a significant difference. HC = healthy control. Additional cytokines (IL-4, IL-17F and IL-21) are shown in Fig. S2. Symbol shapes of COVID-19 patients are identical between panels, and refer back to Fig. 1.
Fig. 6
Fig. 6. SARS-CoV-2 replication and humoral and cellular immune response kinetics in COVID-19 ARDS patients.
(A, B, C, D) Sequential measurements of SARS-CoV-2 genomes detected in upper respiratory tract samples by real-time RT-PCR (40-ct, A), SARS-CoV-2-specific serum RBD IgG antibody levels detected by ELISA (OD450, B) and percentage SARS-CoV-2-specific CD4+ and CD8+ T cells after MP_S stimulation of PBMC (C, D), plotted against days post onset of symptoms. Genome levels showed a significant decrease over time, antibody levels and specific CD4+ T-cell frequencies significantly increased (p<0.001, ANOVA repeated measures). A specific increase or decrease of specific CD8+ T cells over time was not detected (p=0.1001, ANOVA repeated measures). Symbol shapes of COVID-19 patients are identical between panels, and refer back to Fig. 1.
Fig. 7
Fig. 7. Expression of activation markers in representative samples.
(A, B, C) Representative activation plots showing CD69 and CD137 up-regulation from a non-responder HC (A), cross-reactive HC (B) and reactive COVID-19 sample (C). Each panel shows activation after stimulation with DMSO (negative control) or MP_S. Top row shows CD4+ T cell responses, bottom row shows CD8+ T cell responses. Percentages indicate activated CD69+CD137+ cells as a fraction of either CD4+ or CD8+ T cells.

References

    1. Chan J. F., Yuan S., Kok K.-H., To K. K.-W., Chu H., Yang J., Xing F., Liu J., Yip C. C.-Y., Poon R. W.-S., Tsoi H.-W., Lo S. K.-F., Chan K.-H., Poon V. K.-M., Chan W.-M., Ip J. D., Cai J.-P., Cheng V. C.-C., Chen H., Hui C. K.-M., Yuen K.-Y., A familial cluster of pneumonia associated with the 2019 novel coronavirus indicating person-to-person transmission: A study of a family cluster. Lancet 395, 514–523 (2020). 10.1016/S0140-6736(20)30154-9 - DOI - PMC - PubMed
    1. Huang C., Wang Y., Li X., Ren L., Zhao J., Hu Y., Zhang L., Fan G., Xu J., Gu X., Cheng Z., Yu T., Xia J., Wei Y., Wu W., Xie X., Yin W., Li H., Liu M., Xiao Y., Gao H., Guo L., Xie J., Wang G., Jiang R., Gao Z., Jin Q., Wang J., Cao B., Clinical features of patients infected with 2019 novel coronavirus in Wuhan, China. Lancet 395, 497–506 (2020). 10.1016/S0140-6736(20)30183-5 - DOI - PMC - PubMed
    1. Chen G., Wu D., Guo W., Cao Y., Huang D., Wang H., Wang T., Zhang X., Chen H., Yu H., Zhang X., Zhang M., Wu S., Song J., Chen T., Han M., Li S., Luo X., Zhao J., Ning Q., Clinical and immunological features of severe and moderate coronavirus disease 2019. J. Clin. Invest. 130, 2620–2629 (2020). 10.1172/JCI137244 - DOI - PMC - PubMed
    1. Mehta P., McAuley D. F., Brown M., Sanchez E., Tattersall R. S., Manson J. J.; HLH Across Speciality Collaboration, UK , COVID-19: Consider cytokine storm syndromes and immunosuppression. Lancet 395, 1033–1034 (2020). 10.1016/S0140-6736(20)30628-0 - DOI - PMC - PubMed
    1. Xu Z., Shi L., Wang Y., Zhang J., Huang L., Zhang C., Liu S., Zhao P., Liu H., Zhu L., Tai Y., Bai C., Gao T., Song J., Xia P., Dong J., Zhao J., Wang F.-S., Pathological findings of COVID-19 associated with acute respiratory distress syndrome. Lancet Respir. Med. 8, 420–422 (2020). 10.1016/S2213-2600(20)30076-X - DOI - PMC - PubMed

Publication types

MeSH terms