. 2020 Jul 14;95(2):e140-e154.
doi: 10.1212/WNL.0000000000009760. Epub 2020 Jun 26.

Longitudinal structural and metabolic changes in frontotemporal dementia

Affiliations

Longitudinal structural and metabolic changes in frontotemporal dementia

Alexandre Bejanin et al. Neurology. .

Abstract

Objective: To compare the sensitivity of structural MRI and 18F-fludeoxyglucose PET (18FDG-PET) to detect longitudinal changes in frontotemporal dementia (FTD).

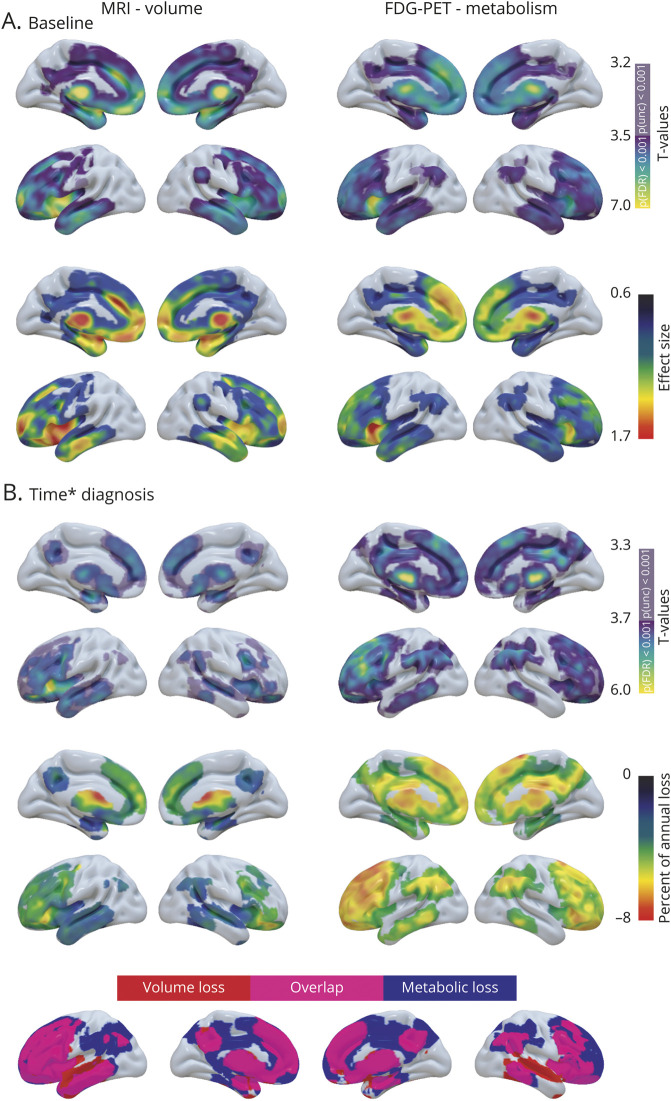
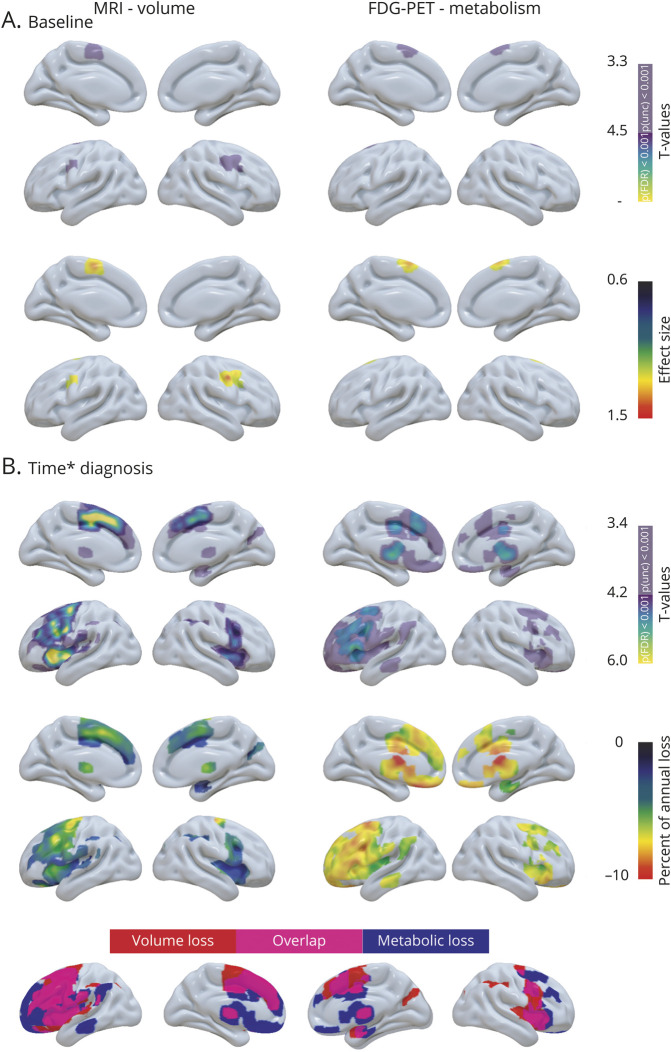
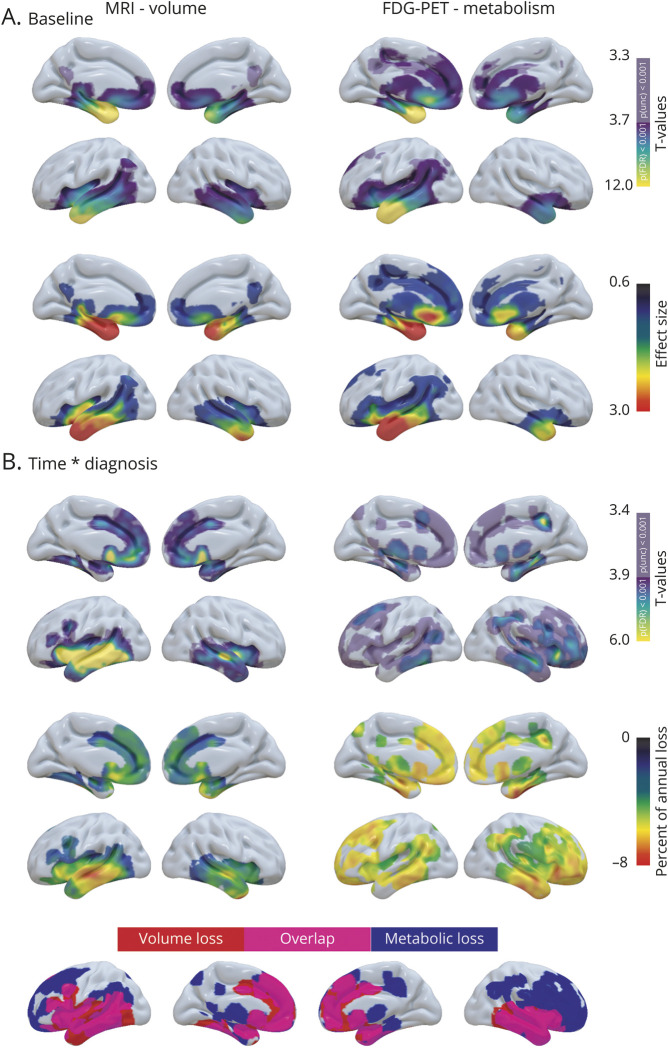
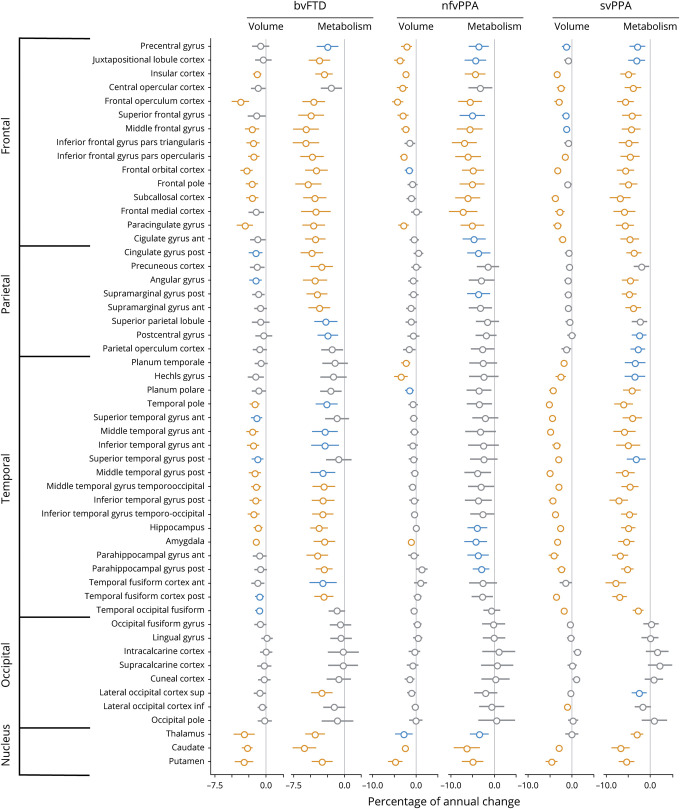
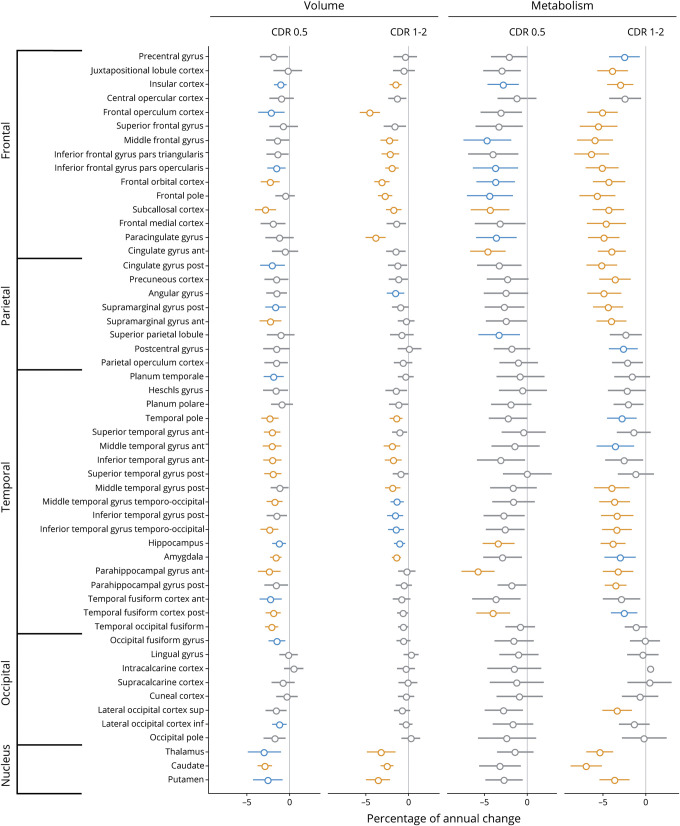
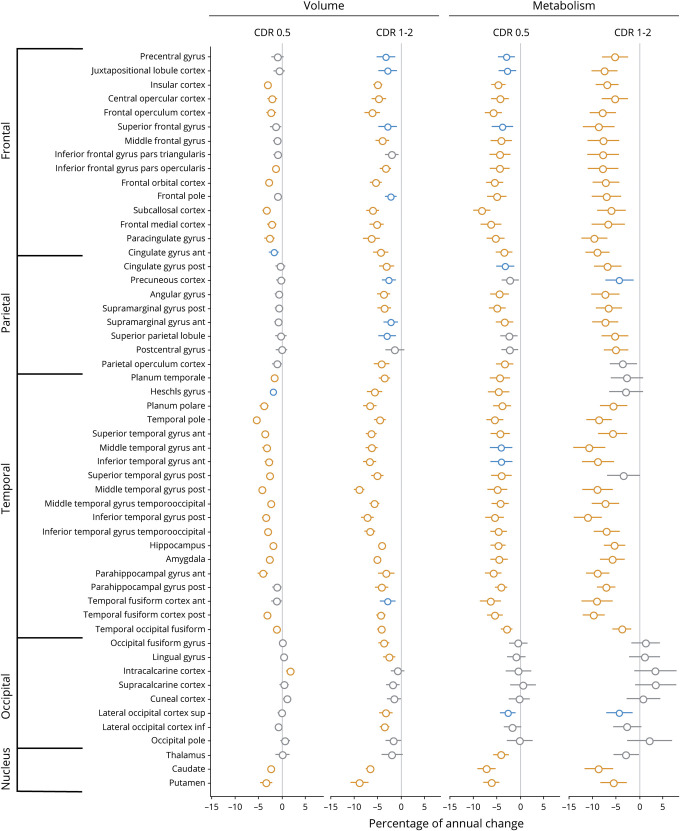
Methods: Thirty patients with behavioral variant FTD (bvFTD), 7 with nonfluent/agrammatic variant primary progressive aphasia (nfvPPA), 16 with semantic variant primary progressive aphasia (svPPA), and 43 cognitively normal controls underwent 2-4 MRI and 18FDG-PET scans (total scans/visit = 270) as part of the Frontotemporal Lobar Degeneration Neuroimaging Initiative study. Linear mixed-effects models were carried out voxel-wise and in regions of interest to identify areas showing decreased volume or metabolism over time in patients as compared to controls.

Results: At baseline, patients with bvFTD showed bilateral temporal, dorsolateral, and medial prefrontal atrophy/hypometabolism that extended with time into adjacent structures and parietal lobe. In nfvPPA, baseline atrophy/hypometabolism in supplementary motor cortex extended with time into left greater than right precentral, dorsolateral, and dorsomedial prefrontal cortex. In svPPA, baseline atrophy/hypometabolism encompassed the anterior temporal and medial prefrontal cortex and longitudinal changes were found in temporal, orbitofrontal, and lateral parietal cortex. Across syndromes, there was substantial overlap in the brain regions showing volume and metabolism loss. Even though the pattern of metabolic decline was more extensive, metabolic changes were also more variable and sample size estimates were similar or higher for 18FDG-PET compared to MRI.

Conclusion: Our findings demonstrated the sensitivity of 18FDG-PET and structural MRI for tracking disease progression in FTD. Both modalities showed highly overlapping patterns of longitudinal change and comparable sample size estimates to detect longitudinal changes in future clinical trials.


Figures

Figure 1
Figure 1. Baseline and longitudinal changes in volume and metabolism in patients with behavioral variant frontotemporal dementia (bvFTD)
(A) Results of voxel-wise 2-sample t tests showing brain regions with less volume (left panel) and metabolism (right panel) at baseline in patients with bvFTD vs cognitively normal (CN) participants. The upper panel shows the significance of the results (T values), and the lower panel shows the effect size. (B) Results of voxel-wise linear mixed effect models showing brain region with greater decreased volume (left panel) and metabolism (right panel) over time in bvFTD vs CN. The upper panel shows the significance of the results (T values), the middle panel shows the percentage of annual volume/metabolic loss in patients compared to CN, and the lower panel shows the overlap in the patterns of volume and metabolic decline.
Figure 2
Figure 2. Baseline and longitudinal changes in volume and metabolism in patients with nonfluent variant primary progressive aphasia (nfvPPA)
(A) Results of voxel-wise 2-sample t tests showing brain regions with less volume (left panel) and metabolism (right panel) at baseline in patients with nfvPPA vs cognitively normal (CN) participants. The upper panel shows the significance of the results (T values), and the lower panel shows the effect size. (B) Results of voxel-wise linear mixed effect models showing brain region with greater decreased volume (left panel) and metabolism (right panel) over time in nfvPPA vs CN. The upper panel shows the significance of the results (T values), the middle panel shows the percentage of annual volume/metabolic loss in patients compared to CN, and the lower panel shows the overlap in the patterns of volume and metabolic decline.
Figure 3
Figure 3. Baseline and longitudinal changes in volume and metabolism in patients with semantic variant primary progressive aphasia (svPPA)
(A) Results of voxel-wise two-sample t tests showing brain regions with less volume (left panel) and metabolism (right panel) at baseline in patients with svPPA vs cognitively normal (CN) participants. The upper panel shows the significance of the results (T values), and the lower panel shows the effect size. (B) Results of voxel-wise linear mixed effect models showing brain region with greater decreased volume (left panel) and metabolism (right panel) over time in svPPA vs CN. The upper panel shows the significance of the results (T values), the middle panel shows the percentage of annual volume/metabolic loss in patients compared to CN, and the lower panel shows the overlap in the patterns of volume and metabolic decline.
Figure 4
Figure 4. Percentage of annual volume and metabolic loss in patients with behavioral variant frontotemporal dementia (bvFTD), nonfluent variant primary progressive aphasia (nfvPPA), and semantic variant primary progressive aphasia (svPPA) compared to cognitively normal (CN) participants
Results of robust linear mixed effect models comparing patients to CN participants for their changes in volume and metabolism in each brain region of the Harvard-Oxford atlas. Values represent the percentage of annual changes, with 95% Wald confidence intervals, in volume and metabolism in patients compared to CN. Colors represent the significance of the results: orange = surviving Bonferroni correction for multiple comparisons (α = 0.05, p < 0.0009, 53 models considered); blue = p < 0.01; gray = p > 0.01.
Figure 5
Figure 5. Percentage of annual volume and metabolic loss in patients with behavioral variant frontotemporal dementia (bvFTD) at mild (Clinical Dementia Rating [CDR] 0.5) and moderate (CDR 1–2) stages of the disease
Results of robust linear mixed effect models comparing patients with bvFTD to cognitively normal (CN) participants for their changes in volume and metabolism in each brain region of the Harvard-Oxford atlas. Values represent the percentage of annual volume changes, with 95% Wald confidence intervals, in patients at mild (n = 10 and n visit = 22) and moderate (n = 20 and n visit = 58) stages of the disease compared to CN. Colors represent the significance of the results: orange: surviving Bonferroni correction for multiple comparisons (α = 0.05, p < 0.0009, 53 models considered); blue: p < 0.01 uncorrected; gray: p > 0.01.
Figure 6
Figure 6. Percentage of annual volume and metabolic loss in patients with semantic variant primary progressive aphasia (svPPA) at mild (Clinical Dementia Rating [CDR] 0.5) and moderate (CDR 1–2) stages of the disease
Results of robust linear mixed effect models comparing patients with svPPA to cognitively normal (CN) participants for their changes in volume and metabolism in each brain region of the Harvard-Oxford atlas. Values represent the percentage of annual volume changes, with 95% Wald confidence intervals, in patients at mild (n = 10 and n visit = 28) and moderate (n = 6 and n visit = 20) stages of the disease compared to CN. Colors represent the significance of the results: orange: surviving Bonferroni correction for multiple comparisons (α = 0.05, p < 0.0009, 53 models considered); blue: p < 0.01 uncorrected; gray: p > 0.01.

References

    1. Bang J, Spina S, Miller BL. Frontotemporal dementia. Lancet 2015;386:1672–1682. - PMC - PubMed
    1. Agosta F, Canu E, Sarro L, Comi G, Filippi M. Neuroimaging findings in frontotemporal lobar degeneration spectrum of disorders. Cortex 2012;48:389–413. - PubMed
    1. Staffaroni AM, Ljubenkov PA, Kornak J, et al. Longitudinal multimodal imaging and clinical endpoints for frontotemporal dementia clinical trials. Brain 2019;142:443–459. - PMC - PubMed
    1. Bouwman F, Orini S, Gandolfo F, et al. Diagnostic utility of FDG-PET in the differential diagnosis between different forms of primary progressive aphasia. Eur J Nucl Med Mol Imaging 2018;45:1526–1533. - PMC - PubMed
    1. Mosconi L, Tsui WH, Herholz K, et al. Multicenter standardized 18F-FDG PET diagnosis of mild cognitive impairment, Alzheimer's disease, and other dementias. J Nucl Med 2008;49:390–398. - PMC - PubMed

Publication types

Substances