. 2020 Jun 26;10(6):72.
doi: 10.1038/s41408-020-0339-9.

Repurposing anthelmintic agents to eradicate resistant leukemia

Affiliations

Repurposing anthelmintic agents to eradicate resistant leukemia

Caterina Mezzatesta et al. Blood Cancer J. .

Abstract

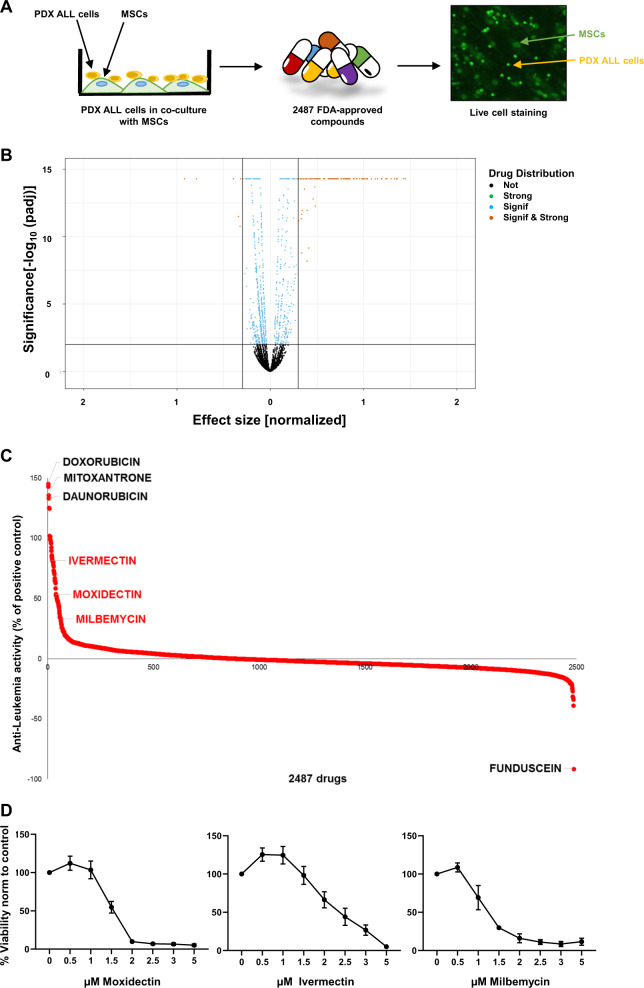
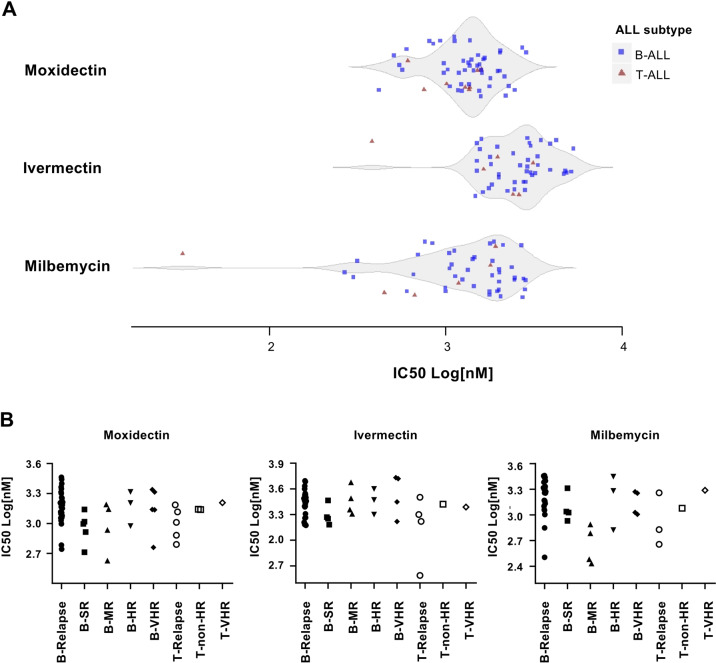
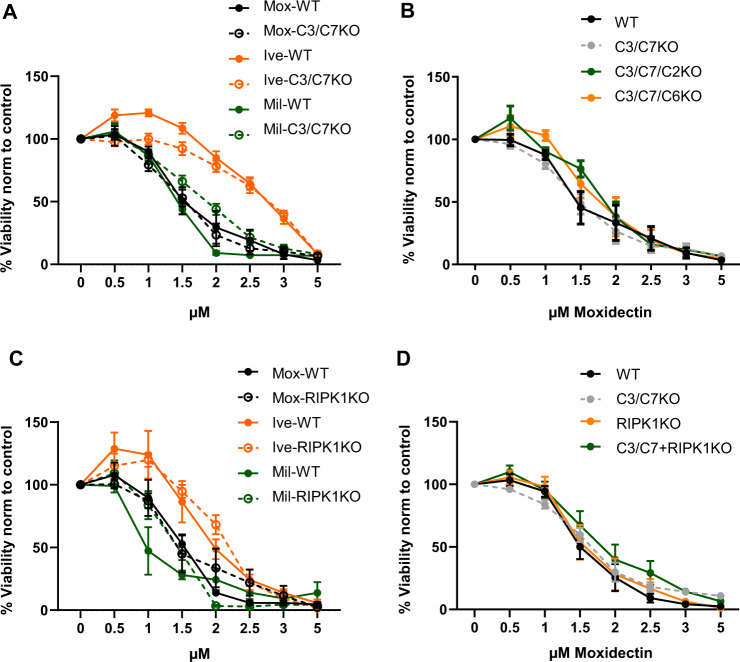
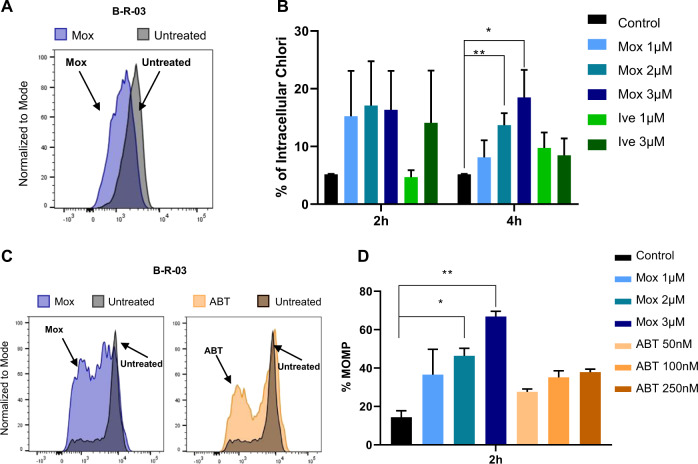
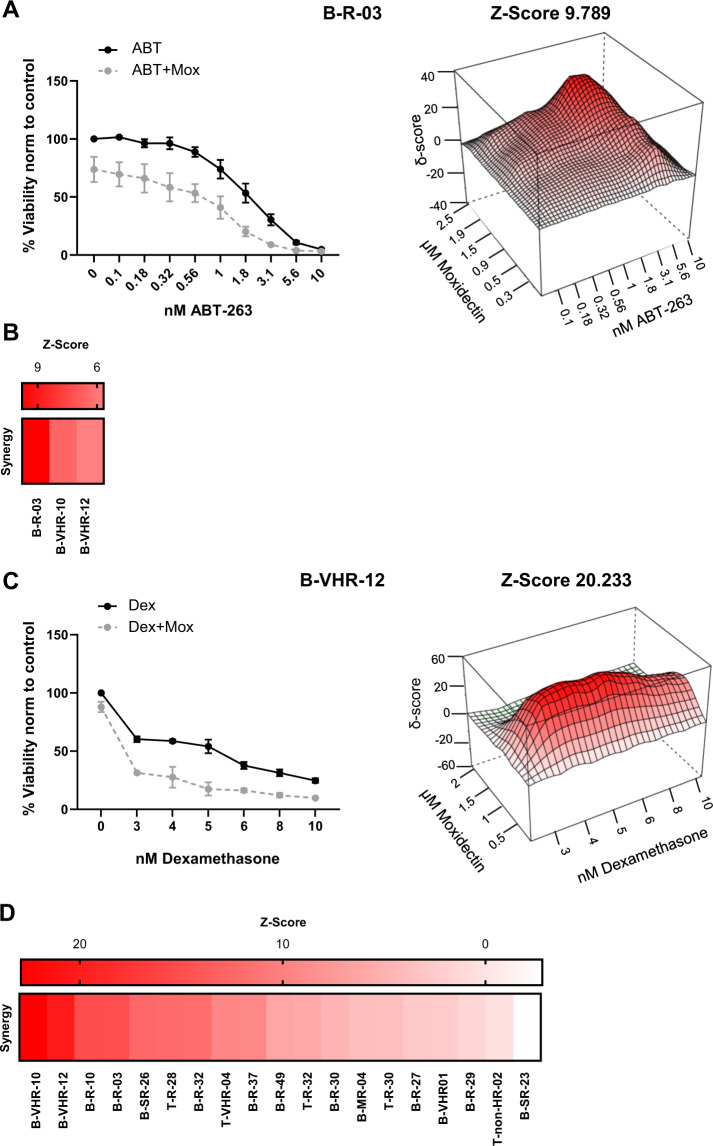
Despite rapid progress in genomic profiling in acute lymphoblastic leukemia (ALL), identification of actionable targets and prediction of response to drugs remains challenging. To identify specific vulnerabilities in ALL, we performed a drug screen using primary human ALL samples cultured in a model of the bone marrow microenvironment combined with high content image analysis. Among the 2487 FDA-approved compounds tested, anthelmintic agents of the class of macrocyclic lactones exhibited potent anti-leukemia activity, similar to the already known anti-leukemia agents currently used in induction chemotherapy. Ex vivo validation in 55 primary ALL samples of both precursor B cell and T-ALL including refractory relapse cases confirmed strong anti-leukemia activity with IC50 values in the low micromolar range. Anthelmintic agents increased intracellular chloride levels in primary leukemia cells, inducing mitochondrial outer membrane depolarization and cell death. Supporting the notion that simultaneously targeting cell death machineries at different angles may enhance the cell death response, combination of anthelmintic agents with the BCL-2 antagonist navitoclax or with the chemotherapeutic agent dexamethasone showed synergistic activity in primary ALL. These data reveal anti-leukemia activity of anthelmintic agents and support exploiting drug repurposing strategies to identify so far unrecognized anti-cancer agents with potential to eradicate even refractory leukemia.


Conflict of interest statement

The authors declare that they have no conflict of interest.

Figures

Fig. 1
Fig. 1. Ex vivo drug repurposing screen identifies anthelmintic agents as a new option for anti-leukemia therapy.
a Strategy for ex vivo drug screening of patient-derived xenograft (PDX) cells in co-culture with mesenchymal stroma cells (MSCs), which were treated with 2487 compounds (each at 1 µM concentration) with FDA approval. Fluorescent live cell staining using CyQuant and automated image analysis was used to quantify living ALL. b Volcano plot of the resulting drug activity. The horizontal line corresponds to FDR = 0.01 and compounds below this line are labeled “not significant”. The two vertical lines correspond to a change of ±0.3 in activity as compared to vehicle control and compounds outside this range are labeled “strong”. The legend refers to “not” (black)—not significant and weak effect; “signif & strong” (light brown)—significant and strong effect; “signif” (light blue)—significant but weak effect; “strong” (green)—not significant but strong effect. c Rank order of anti-leukemia activity of the 2487 FDA-approved compounds in percentage of the positive control idarubicin. On the left the top drugs with the highest anti-leukemia activity doxorubicin, mitoxantrone, and daunorubicin are indicated in black. In red, the anthelmintic agents, ivermectin, moxidectin, and milbemycin are indicated. Funduscein, a drug with high fluorescent characteristics, leads to seemingly proliferative activity revealing a false negative example. d Validation of anthelmintic compounds, moxidectin, ivermectin, and milbemycin. Dose–response curves of the three drugs for B-R-03 are given normalized to vehicle treated control. N = 3 independent experiments. All quantifications represent mean ± s.e.m.
Fig. 2
Fig. 2. Primary B- and T-ALL samples are sensitive towards anthelmintic compounds.
a Violin plot indicating the response of B-ALL (n = 47) and T-ALL (n = 8) samples to moxidectin, ivermectin, and milbemycin, as indicated by IC50 values. On the ordinate, the three drugs are indicated with the respective IC50 (Log nM) distribution. Blue squares represent precursor B-ALL and red triangles represent T-ALL samples. b Distribution of IC50 values in primary ALL with respect to their risk classification. IC50 values are given in Log (nM) of moxidetin, ivermectin, and milbemycin, and classification of primary ALL samples in standard risk (B-SR; n = 5), medium risk (B-MR; n = 4), high risk (B-HR; n = 3), very high risk (B-VHR; n = 5), and relapse (B-Relapse; n = 30). Classification of T-ALL samples in non-high risk (T-non-HR; n = 2), very high risk (T-VHR; n = 1), and relapse (T-Relapse; n = 5). Classification of samples at diagnosis in accordance to the criteria used in the ALL-BFM study.
Fig. 3
Fig. 3. Anthelmintic agents induce cell death independent of caspases and RIPK1.
Dose response curves of B-R-03 wild type (WT) and indicated gene knockout (KO) ALL are given. a Moxidectin (Mox; black), ivermectin (Ive; orange), and milbemycin (Mil; green) induce cell death in WT (continuous lines) and Caspases-3 and -7 KO (C3/C7KO; dotted lines) ALL. b Moxidectin induces cell death in WT (black), C3/C7KO (gray), Caspases-3/-7/-2 triple knockout (C3/C7/C2KO; green), and Caspases-3/-7/-6 triple knockout (C3/C7/C6KO; orange) ALL. c Moxidectin (black), ivermectin (orange), and milbemycin (green) induce cell death in WT (continuous lines) and RIPK1KO (dotted lines) ALL. d Moxidectin induces cell death in WT (black), C3/C7KO (gray), RIPK1KO (orange), and combination of C3/C7 and RIPK1 knockout (C3/C7+RIPK1KO; green). All the dose response curves were normalized to vehicle control, and performed in N = 3 independent experiments. Quantifications represent mean ± s.e.m.
Fig. 4
Fig. 4. Moxidectin induces leukemia cell death by increasing intracellular chloride and inducing mitochondrial outer membrane permeabilization (MOMP).
a Levels of intracellular chloride in B-R-03 PDX cells as measured by quenching of the MQAE fluorescent signal upon treatment with 3 µM moxidectin (Mox, blue), compared to vehicle control (black). Representation of one experiment after 4 h treatment. b Quantification of intracellular chloride in vehicle treated B-R-03 (black) compared to cells treated with moxidectin (Mox) 1 µM (light blue), 2 µM (blue), and 3 µM (dark blue) or ivermectin (Ive) 1 µM (light green) and 3 µM (green) for 2 or 4 h. Quantifications of N = 6 independent experiments representing mean ± s.e.m., Paired t-test, *p value ≤ 0.008; **p value ≤ 0.002. c MOMP levels in B-R-03 PDX cells. Light color histograms represent cells treated with 2 µM Moxidectin (Mox; blue) or 100 nM ABT-263 (ABT; orange) compared to control cells (black). Representation of one experiment after 2 h treatment. d MOMP quantification in control B-R-03 (black) ALL cells compared to cells treated with moxidectin (Mox) 1 µM (light blue), 2 µM (blue), and 3 µM (dark blue) or ABT-263 (ABT) 50 nM (light pink), 100 nM (orange), and 250 nM (brown) for 2 h. Quantifications of N = 3 independent experiments representing mean ± s.e.m. Paired t-test, *p value ≤ 0.02; **p value ≤ 0.01.
Fig. 5
Fig. 5. Synergic activity of moxidectin and ABT-263 or dexamethasone.
a On the left, the viability curve of the B-R-03 sample treated with ABT-263 (ABT; black) or ABT-263 in combination with 0.9 µM moxidectin (ABT+Mox; gray). The dose response curve was performed in N = 3 independent experiments, and quantifications represent mean ± s.e.m. On the right, a 3D representation map of the B-R-03 sample with the calculated synergy (Z-score = 9.789) between moxidectin and ABT-263. b Heatmap representing the synergy between moxidectin and ABT-263 of B-ALL samples (n = 3). The samples (columns) were ordered, from the left to the right, according to their decreasing Z-score values. c On the left, the viability curve of the B-VHR-12 sample treated with dexamethasone (Dex; black) or dexamethasone in combination with 0.5 µM moxidectin (Dex+Mox; gray). The dose response curve was performed in N = 3 independent experiments, and quantifications represent mean ± s.e.m. On the right, a 3D representation map of the B-VHR-12 sample with the calculated synergy (Z-score = 20.233) between moxidectin and dexamethasone. d Heatmap representing the synergy between moxidectin and dexamethasone of B-ALL (n = 14) and T-ALL (n = 5) samples. The samples (columns) were ordered, from the left to the right, according to their decreasing Z-score values.

References

    1. Pui CH, et al. Childhood acute lymphoblastic leukemia: progress through collaboration. J. Clin. Oncol. 2015;33:2938–2948. - PMC - PubMed
    1. Schrappe M, et al. Key treatment questions in childhood acute lymphoblastic leukemia: results in 5 consecutive trials performed by the ALL-BFM study group from 1981 to 2000. Klin. Padiatr. 2013;225(Suppl 1):S62–S72. - PubMed
    1. Bhojwani D, Pui CH. Relapsed childhood acute lymphoblastic leukaemia. Lancet Oncol. 2013;14:e205–e217. - PubMed
    1. Chen KH, et al. Preclinical targeting of aggressive T-cell malignancies using anti-CD5 chimeric antigen receptor. Leukemia. 2017;31:2151–2160. - PMC - PubMed
    1. Pan J, et al. High efficacy and safety of low-dose CD19-directed CAR-T cell therapy in 51 refractory or relapsed B acute lymphoblastic leukemia patients. Leukemia. 2017;31:2587–2593. - PubMed

Publication types

MeSH terms