. 2020 Jun 26;10(1):10422.
doi: 10.1038/s41598-020-67162-8.

Individual differences in local functional brain connectivity affect TMS effects on behavior

Affiliations

Individual differences in local functional brain connectivity affect TMS effects on behavior

Carsten Gießing et al. Sci Rep. .

Abstract

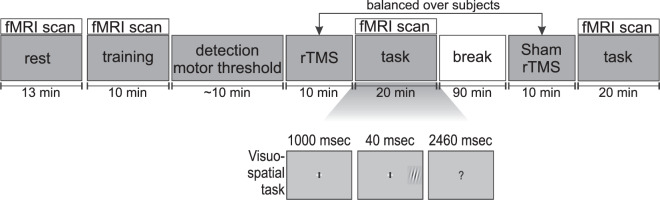
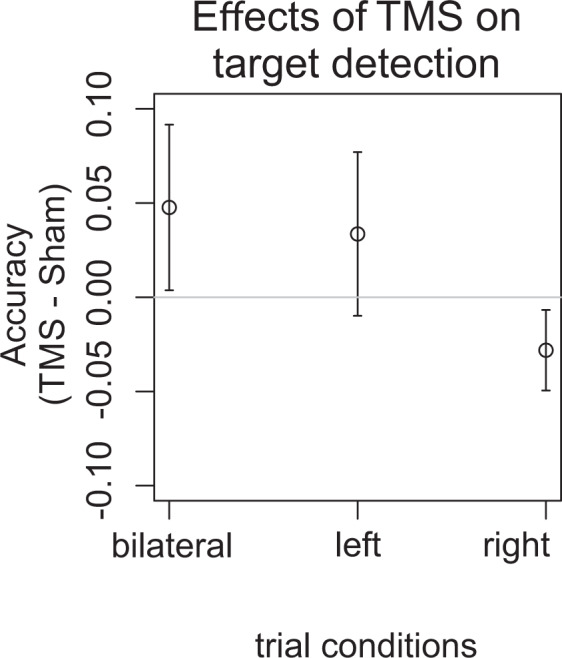
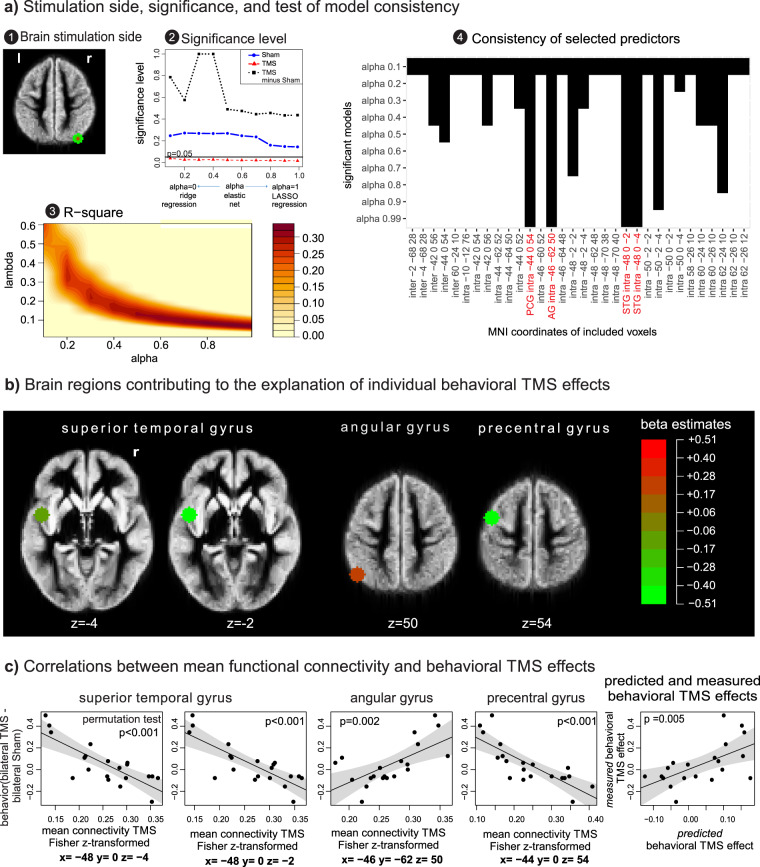
Behavioral effects of transcranial magnetic stimulation (TMS) often show substantial differences between subjects. One factor that might contribute to these inter-individual differences is the interaction of current brain states with the effects of local brain network perturbation. The aim of the current study was to identify brain regions whose connectivity before and following right parietal perturbation affects individual behavioral effects during a visuospatial target detection task. 20 subjects participated in an fMRI experiment where their brain hemodynamic response was measured during resting state, and then during a visuospatial target detection task following 1 Hz rTMS and sham stimulation. To select a parsimonious set of associated brain regions, an elastic net analysis was used in combination with a whole-brain voxel-wise functional connectivity analysis. TMS-induced changes in accuracy were significantly correlated with the pattern of functional connectivity during the task state following TMS. The functional connectivity of the left superior temporal, angular, and precentral gyri was identified as key explanatory variable for the individual behavioral TMS effects. Our results suggest that the brain must reach an appropriate state in which right parietal TMS can induce improvements in visual target detection. The ability to reach this state appears to vary between individuals.


Conflict of interest statement

The authors declare no competing interests.

Figures

Figure 1
Figure 1
Experimental design and task. Following a resting state measurement, training, and an assessment of TMS motor threshold, participants received either repetitive transcranial magnetic stimulation (rTMS) or sham stimulation on the posterior parietal cortex, counterbalanced across subjects. The stimulation was followed by performing a visuospatial detection task inside the MRI scanner. Subjects were instructed to detect small Gabor patches that were presented either on the left, right, or both sides of the peripheral visual field. Following a break of 90 minutes and a period of, alternatively, TMS or sham stimulation, participants performed the task for the second time.
Figure 2
Figure 2
Effects of posterior parietal repetitive transcranial magnetic stimulation (TMS) on visual target detection. Mean TMS effects (TMS minus Sham) on the accuracy during bilateral, left and right target detection trials are shown with standard error of means (SEMs). The strongest behavioral improvements of TMS on target detection were found for bilateral trials and were weaker for unilateral targets presented in the left or right visual hemi-field.
Figure 3
Figure 3
Connectivity states associated with behavioral TMS effects. An elastic net analysis was performed to explain the variation in behavioral TMS effects by the voxel-wise mean connectivity measured following (i) Sham, (ii) TMS stimulation, and (iii) by the change of mean connectivity following TMS. (a) Stimulation side, significance, and test of model consistency. Plot 1: The position of the TMS coil on P4 showed the smallest average distance to the right angular gyrus. Plot 2: Mean functional connectivity following TMS showed a significant association with behavioral TMS effects. Data points below the black horizontal line indicate significant p-values (p < 0.05). Plot 3: Proportion of variance explained by the model, as estimated by cross-validation as function of alpha and lambda. Models with a large relative contribution from the lasso ℓ1 norm penalty (large alpha), and therefore only few regressor variables, tended to show better associations. Plot 4: For each of the ten significant models, brain regions that received non-zero regression coefficients and contributed to the model are graphically illustrated by black bars. All significant models include the same four regressor variables with non-zero coefficients that were also selected for the model with the best significance level. The corresponding voxel positions are presented in MNI coordinates. STG: superior temporal gyrus, AG: angular gyrus, PCG: precentral gyrus, inter: interhemispheric connectivity, intra: intrahemispheric connectivity. (b) Brain regions contributing to the explanation of individual behavioral TMS effects. The anatomical positions of the four selected regressors included within the model with the smallest p-value are illustrated. For each of these brain regions, only the mean intra-hemispheric functional connectivity (and not the inter-hemispheric connectivity) was selected as regressor. The size of the estimated regression coefficients is color-coded. Voxel sizes of the explanatory brain regions were increased for illustrative reasons and plotted on co-registered and normalized T1 group mean images. (c) Correlations between mean functional connectivity and behavioral TMS effects. The single correlation between mean functional connectivity following TMS and the behavioral TMS effects are illustrated for each brain region selected in the elastic net analysis. Right plot: The correlation between predicted and measured behavioral TMS effects is shown.

References

    1. Cocchi L, et al. Dissociable effects of local inhibitory and excitatory theta-burst stimulation on large-scale brain dynamics. J. Neurophysiol. 2015;113:3375–3385. doi: 10.1152/jn.00850.2014. - DOI - PMC - PubMed
    1. Gollo LL, Roberts JA, Cocchi L. Mapping how local perturbations influence systems-level brain dynamics. NeuroImage. 2017 doi: 10.1016/j.neuroimage.2017.01.057. - DOI - PubMed
    1. Zrenner C, Belardinelli P, Muller-Dahlhaus F, Ziemann U. Closed-Loop Neuroscience and Non-Invasive Brain Stimulation: A Tale of Two Loops. Front. Cell. Neurosci. 2016;10:92. doi: 10.3389/fncel.2016.00092. - DOI - PMC - PubMed
    1. Ridding MC, Rothwell JC. Is there a future for therapeutic use of transcranial magnetic stimulation? Nat. Rev. Neurosci. 2007;8:559–567. doi: 10.1038/nrn2169. - DOI - PubMed
    1. Silvanto J, Pascual-Leone A. State-dependency of transcranial magnetic stimulation. Brain Topogr. 2008;21:1–10. doi: 10.1007/s10548-008-0067-0. - DOI - PMC - PubMed

Publication types