. 2020 Dec 8;36(19):4854-4859.
doi: 10.1093/bioinformatics/btaa599.

BnpC: Bayesian non-parametric clustering of single-cell mutation profiles

Affiliations

BnpC: Bayesian non-parametric clustering of single-cell mutation profiles

Nico Borgsmüller et al. Bioinformatics. .

Abstract

Motivation: The high resolution of single-cell DNA sequencing (scDNA-seq) offers great potential to resolve intratumor heterogeneity (ITH) by distinguishing clonal populations based on their mutation profiles. However, the increasing size of scDNA-seq datasets and technical limitations, such as high error rates and a large proportion of missing values, complicate this task and limit the applicability of existing methods.

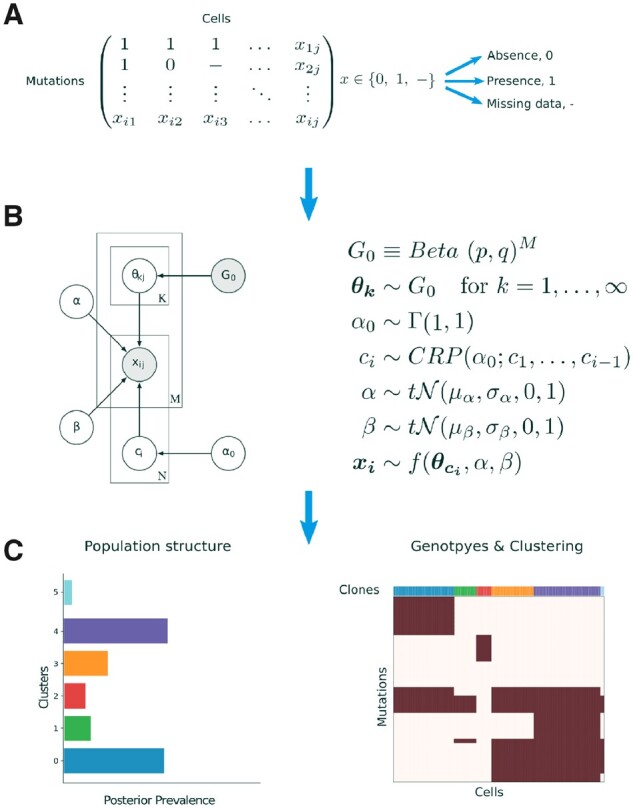
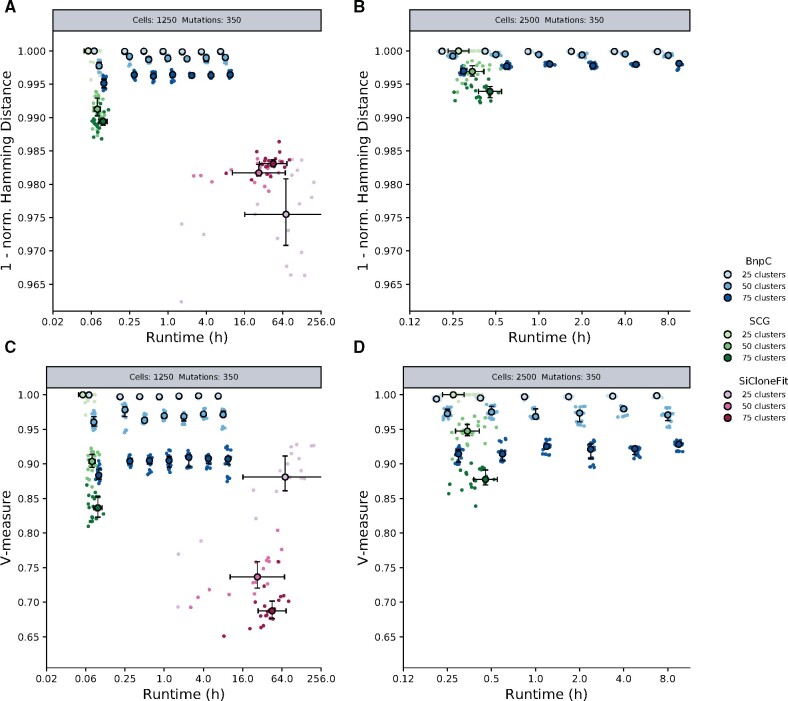
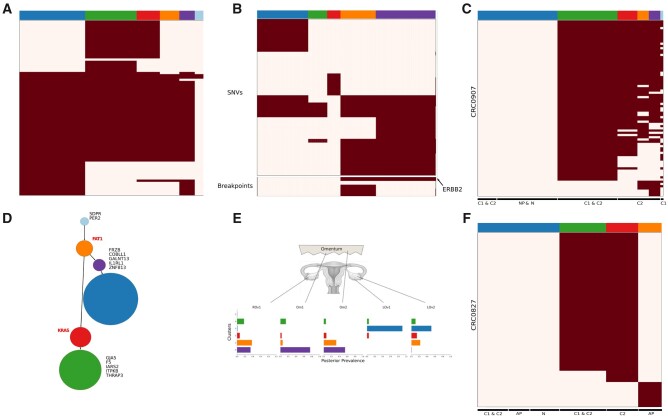
Results: Here, we introduce BnpC, a novel non-parametric method to cluster individual cells into clones and infer their genotypes based on their noisy mutation profiles. We benchmarked our method comprehensively against state-of-the-art methods on simulated data using various data sizes, and applied it to three cancer scDNA-seq datasets. On simulated data, BnpC compared favorably against current methods in terms of accuracy, runtime and scalability. Its inferred genotypes were the most accurate, especially on highly heterogeneous data, and it was the only method able to run and produce results on datasets with 5000 cells. On tumor scDNA-seq data, BnpC was able to identify clonal populations missed by the original cluster analysis but supported by Supplementary Experimental Data. With ever growing scDNA-seq datasets, scalable and accurate methods such as BnpC will become increasingly relevant, not only to resolve ITH but also as a preprocessing step to reduce data size.

Availability and implementation: BnpC is freely available under MIT license at https://github.com/cbg-ethz/BnpC.

Supplementary information: Supplementary data are available at Bioinformatics online.


Figures

Fig. 1.
Fig. 1.
BnpC model overview. (A) The model’s input is a binary mutation matrix, where each row represents a mutation and each column represents a single cell. Possible values are 0, indicating the absence of a mutation, 1, indicating the presence of a mutation and missing values. (B) BnpC’s probabilistic graphical model. The binary input data X, consisting of N cells and M clones, contains a fraction of FP and FN entries, indicated by α and β respectively. G0 is a base distribution over the genotypes θ of an infinite number of clones. c is the assignment of cells to the clones, sampled from a CRP with concentration parameter α0, and f(·) is the model’s likelihood. Shaded nodes represent observed or fixed values, while the values of unshaded nodes are learned using MCMC. (C) BnpC predicts clonal composition, corresponding genotypes and the population structure
Fig. 2.
Fig. 2.
Performance of BnpC, SCG and SiCloneFit on synthetic data. (A, B) Genotyping accuracy measured by 1 - Hamming distance/(#cells. #mutations). (C, D) Clustering accuracy measured by the V-Measure. Simulated datasets contained 350 mutations and (A, C) 1250 cells or (B, D) 2500 cells, clustered into 25, 50 or 75 distinct clones. For all datasets, the FN rate was fixed at 30%, the FP rate at 0.1% and the missing value fraction at 20%. Each cell and clone number combination was simulated five times; algorithms were run four times on every simulated dataset
Fig. 3.
Fig. 3.
Analysis of real datasets by BnpC. (A, D) Patient 4 of the Gawad dataset. (A) Clones and genotypes inferred by BnpC. (D) Resulting minimum spanning tree from the clonal genotypes as obtained in Gawad et al. Gene labels in the tree determine either mutations leading to a new clone (black) or known ALL driver genes (red). Node size corresponds with the clonal size. (B, E) Patient 9 of the McPherson dataset. (B) Clones and genotypes inferred by BnpC. (E) Estimated prevalence of clones across samples from the posterior distribution estimated by the model. (C, F) Analysis for patients. CRC0827 (C) and CRC0907 (F) of the Wu dataset. Heatmaps depict absence (white) or presence (red) of mutations for every mutation (row) in every cell (column)

References

    1. Burrell R.A. et al. (2013) The causes and consequences of genetic heterogeneity in cancer evolution. Nature, 501, 338–345. - PubMed
    1. Ciccolella S. et al. (2018) Inferring cancer progression from single cell sequencing while allowing loss of mutations. bioRxiv. - PMC - PubMed
    1. Ciccolella S. et al. (2019) Benchmarking clustering methods for single cell sequencing cancer data. bioRxiv.
    1. Davis A. et al. (2017) Tumor evolution: linear, branching, neutral or punctuated? Biochim. Biophys. Acta Rev. Cancer, 1867, 151–161. - PMC - PubMed
    1. El-Kebir M. (2018) SPhyR: tumor phylogeny estimation from single-cell sequencing data under loss and error. Bioinformatics, 34, i671–i679. - PMC - PubMed

Publication types