

Evaluation of human cartilage endplate composition using MRI: Spatial variation, association with adjacent disc degeneration, and in vivo repeatability
- PMID: 32592504
- PMCID: PMC7765737
- DOI: 10.1002/jor.24787
Evaluation of human cartilage endplate composition using MRI: Spatial variation, association with adjacent disc degeneration, and in vivo repeatability
Abstract
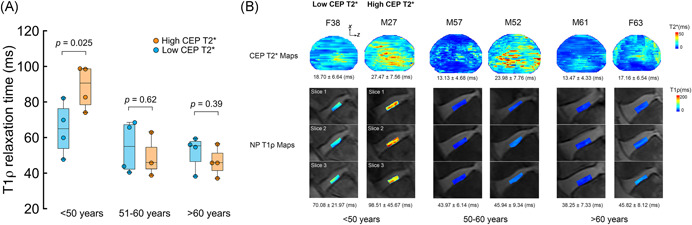
Cartilage endplate (CEP) biochemical composition may influence disc degeneration and regeneration. However, evaluating CEP composition in patients remains a challenge. We used T2* mapping from ultrashort echo-time (UTE) magnetic resonance imaging (MRI), which is sensitive to CEP hydration, to investigate spatial variations in CEP T2* values and to determine how CEP T2* values correlate with adjacent disc degeneration. Thirteen human cadavers (56.4 ± 12.7 years) and seven volunteers (36.9 ± 10.9 years) underwent 3T MRI, including UTE and T1ρ mapping sequences. Spatial mappings of T2* values in L4-S1 CEPs were generated from UTE images and compared between subregions. In the abutting discs, mean T1ρ values in the nucleus pulposus were compared between CEPs with high vs low T2* values. To assess in vivo repeatability, precision errors in mean T2* values, and intraclass correlation coefficients (ICC) were measured from repeat scans. Results showed that CEP T2* values were highest centrally and lowest posteriorly. In the youngest individuals (<50 years), who had mild-to-moderately degenerated Pfirrmann grade II-III discs, low CEP T2* values associated with severer disc degeneration: T1ρ values were 26.7% lower in subjects with low CEP T2* values (P = .025). In older individuals, CEP T2* values did not associate with disc degeneration (P = .39-.62). Precision errors in T2* ranged from 1.7 to 2.6 ms, and reliability was good-to-excellent (ICC = 0.89-0.94). These findings suggest that deficits in CEP composition, as indicated by low T2* values, associate with severer disc degeneration during the mild-to-moderate stages. Measuring CEP T2* values with UTE MRI may clarify the role of CEP composition in patients with mild-to-moderate disc degeneration.
Keywords: T2*; cartilage endplate; intervertebral disc degeneration; low back pain; magnetic resonance imaging (MRI).
© 2020 The Authors. Journal of Orthopaedic Research® published by Wiley Periodicals LLC on behalf of Orthopaedic Research Society.
Figures


Similar articles
-
Quantitative assessment of lumbar intervertebral disc degeneration and its correlation with clinical symptoms: a study utilizing ultrashort time-of-echo and T2 mapping as biomarkers.BMC Musculoskelet Disord. 2025 Sep 1;26(1):829. doi: 10.1186/s12891-025-09039-3. BMC Musculoskelet Disord. 2025. PMID: 40890680 Free PMC article.
-
Risk factors for progression of nucleus pulposus degeneration in the lumbar intervertebral disc: a retrospective analysis using the disc signal intensity index.Spine J. 2025 Jul;25(7):1466-1473. doi: 10.1016/j.spinee.2025.01.036. Epub 2025 Feb 1. Spine J. 2025. PMID: 39900250
-
The "horizon gray band" represents normal nucleus pulposus cells condense rather than intervertebral disc degeneration signal.Int J Surg. 2025 Jul 1;111(7):4339-4353. doi: 10.1097/JS9.0000000000002532. Epub 2025 May 26. Int J Surg. 2025. PMID: 40422293
-
The correlation between the lumbar disc MRI high-intensity zone and discogenic low back pain: a systematic review and meta-analysis.J Orthop Surg Res. 2023 Oct 7;18(1):758. doi: 10.1186/s13018-023-04187-5. J Orthop Surg Res. 2023. PMID: 37805519 Free PMC article.
-
Total disc replacement for chronic back pain in the presence of disc degeneration.Cochrane Database Syst Rev. 2012 Sep 12;(9):CD008326. doi: 10.1002/14651858.CD008326.pub2. Cochrane Database Syst Rev. 2012. PMID: 22972118
Cited by
-
Comprehensive assessment of in vivo lumbar spine intervertebral discs using a 3D adiabatic T1ρ prepared ultrashort echo time (UTE-Adiab-T1ρ) pulse sequence.Quant Imaging Med Surg. 2022 Jan;12(1):269-280. doi: 10.21037/qims-21-308. Quant Imaging Med Surg. 2022. PMID: 34993077 Free PMC article.
-
Non-enzymatic glycation reduces glucose transport in the human cartilage endplate independently of matrix porosity or proteoglycan content.JOR Spine. 2023 Oct 24;7(1):e1297. doi: 10.1002/jsp2.1297. eCollection 2024 Mar. JOR Spine. 2023. PMID: 38222801 Free PMC article.
-
Intervertebral disc degeneration and regeneration: a motion segment perspective.Eur Cell Mater. 2021 Mar 24;41:370-380. doi: 10.22203/eCM.v041a24. Eur Cell Mater. 2021. PMID: 33763848 Free PMC article. Review.
-
The contributions of cartilage endplate composition and vertebral bone marrow fat to intervertebral disc degeneration in patients with chronic low back pain.Eur Spine J. 2022 Jul;31(7):1866-1872. doi: 10.1007/s00586-022-07206-x. Epub 2022 Apr 20. Eur Spine J. 2022. PMID: 35441890 Free PMC article.
-
Qualitative and Quantitative MR Imaging of the Cartilaginous Endplate: A Review.J Magn Reson Imaging. 2025 Apr;61(4):1552-1571. doi: 10.1002/jmri.29562. Epub 2024 Aug 20. J Magn Reson Imaging. 2025. PMID: 39165086 Review.
References
-
- Urban JP, Smith S, Fairbank JC. Nutrition of the intervertebral disc. Spine. 2004;29:2700‐2709. - PubMed
-
- Huang YC, Urban JP, Luk KD. Intervertebral disc regeneration: do nutrients lead the way? Nat Rev Rheumatol. 2014;10:561‐566. - PubMed
-
- Roberts S, Menage J, Duance V, Wotton S, Ayad S. 1991 Volvo Award in basic sciences. Collagen types around the cells of the intervertebral disc and cartilage end plate: an immunolocalization study. Spine. 1991;16:1030‐1038. - PubMed
