. 2020 Aug 5;107(3):470-486.e11.
doi: 10.1016/j.neuron.2020.05.029. Epub 2020 Jun 26.

Precision Calcium Imaging of Dense Neural Populations via a Cell-Body-Targeted Calcium Indicator

Affiliations

Precision Calcium Imaging of Dense Neural Populations via a Cell-Body-Targeted Calcium Indicator

Or A Shemesh et al. Neuron. .

Abstract

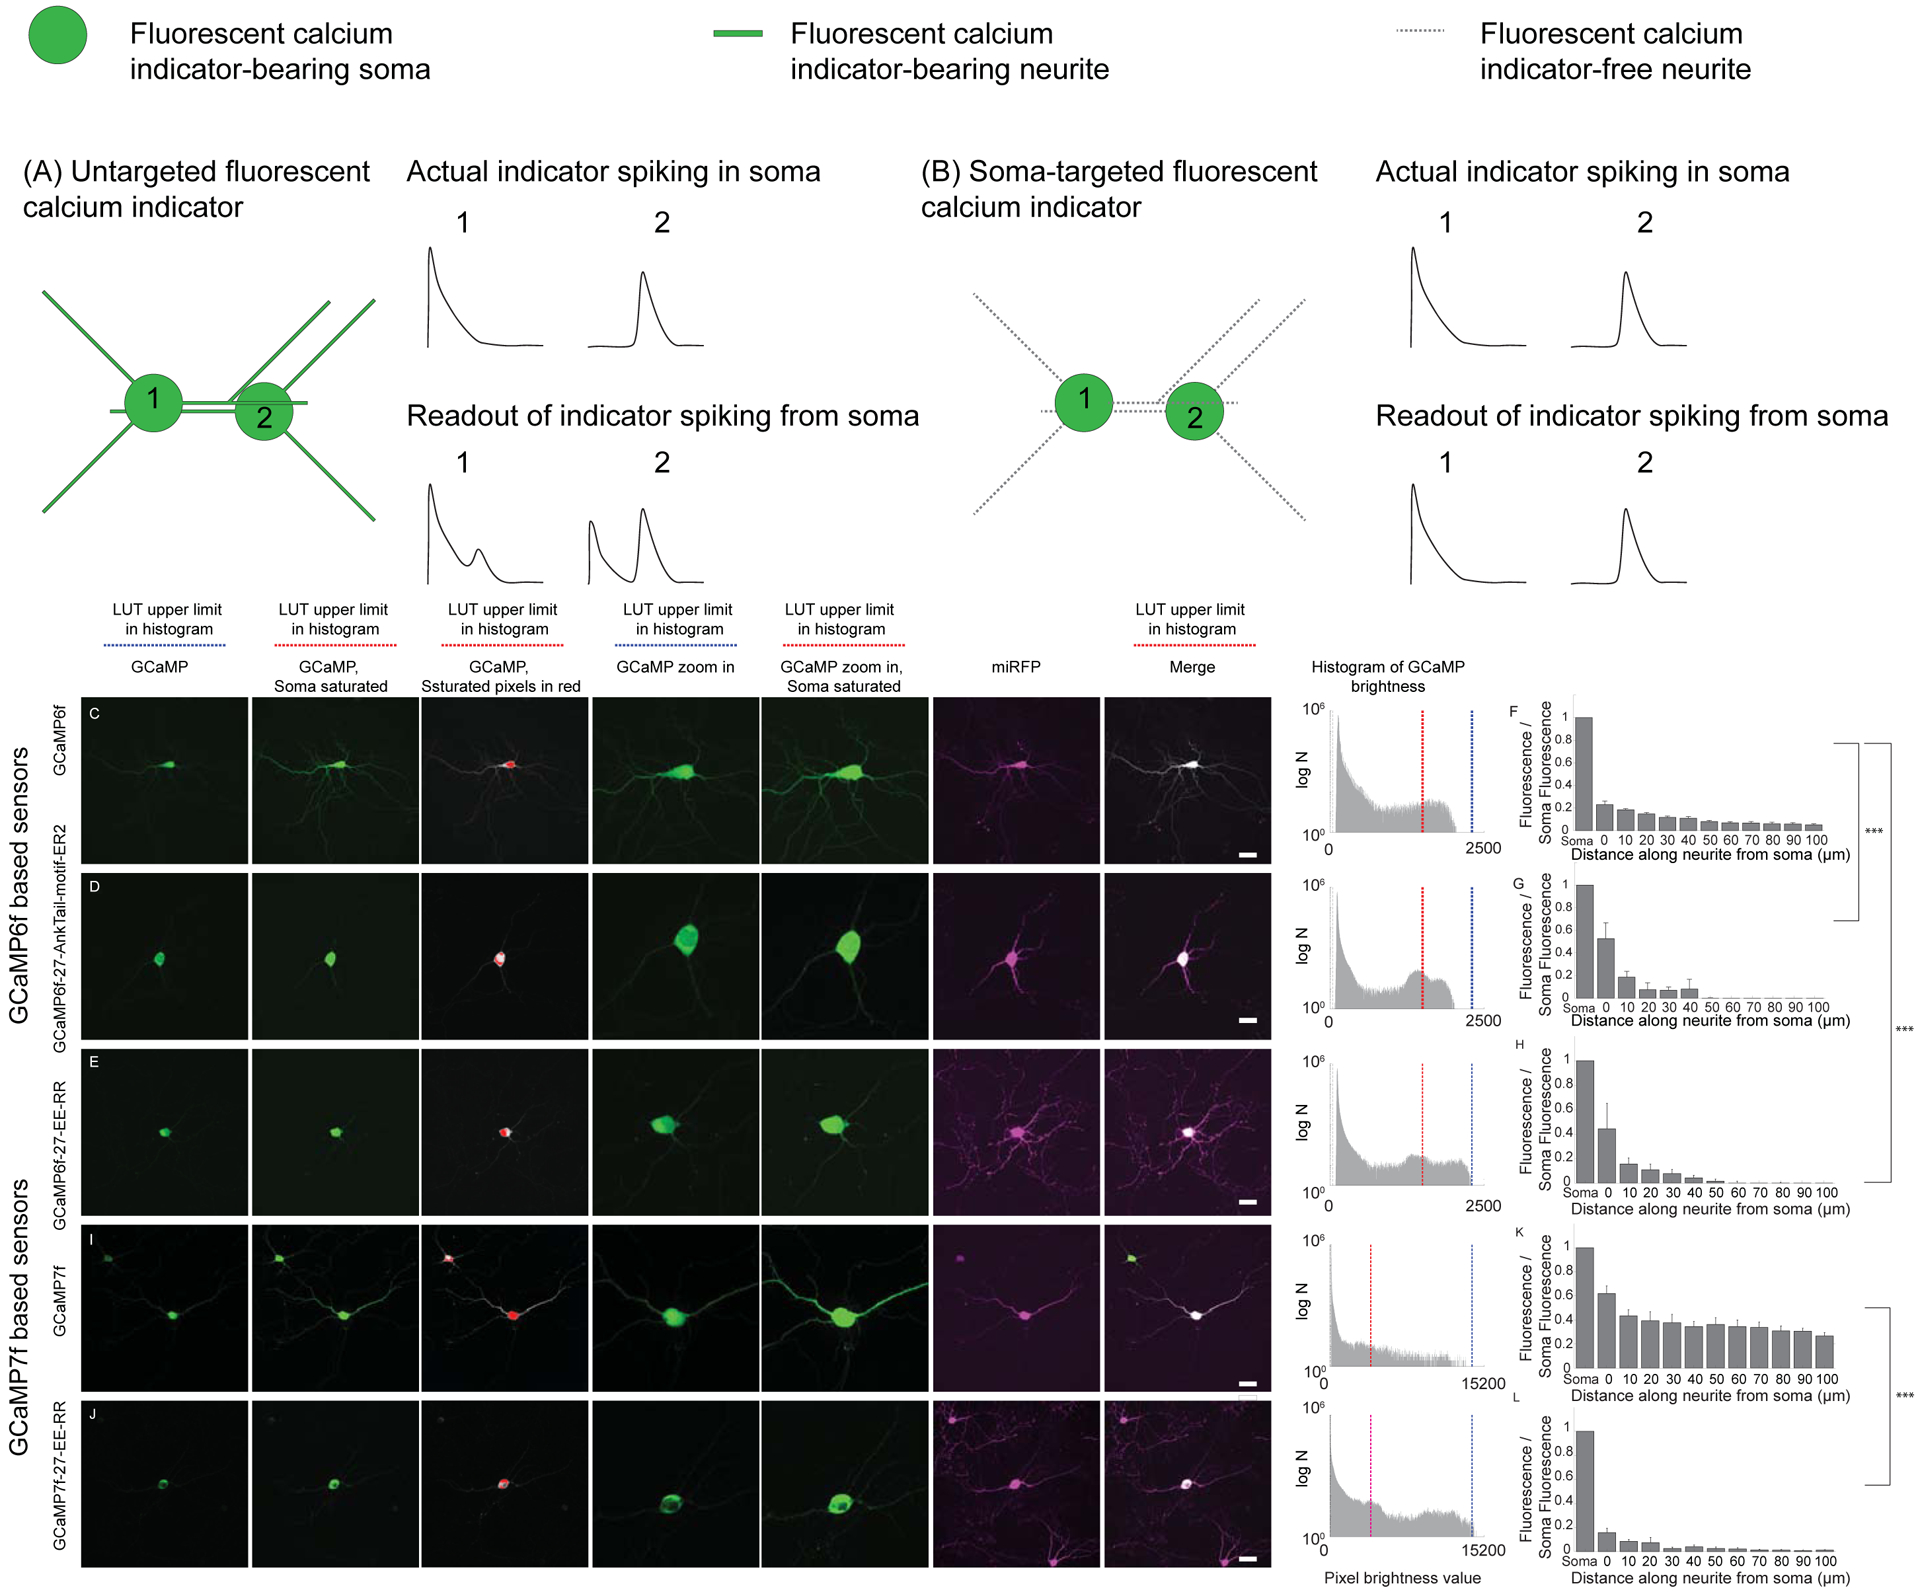
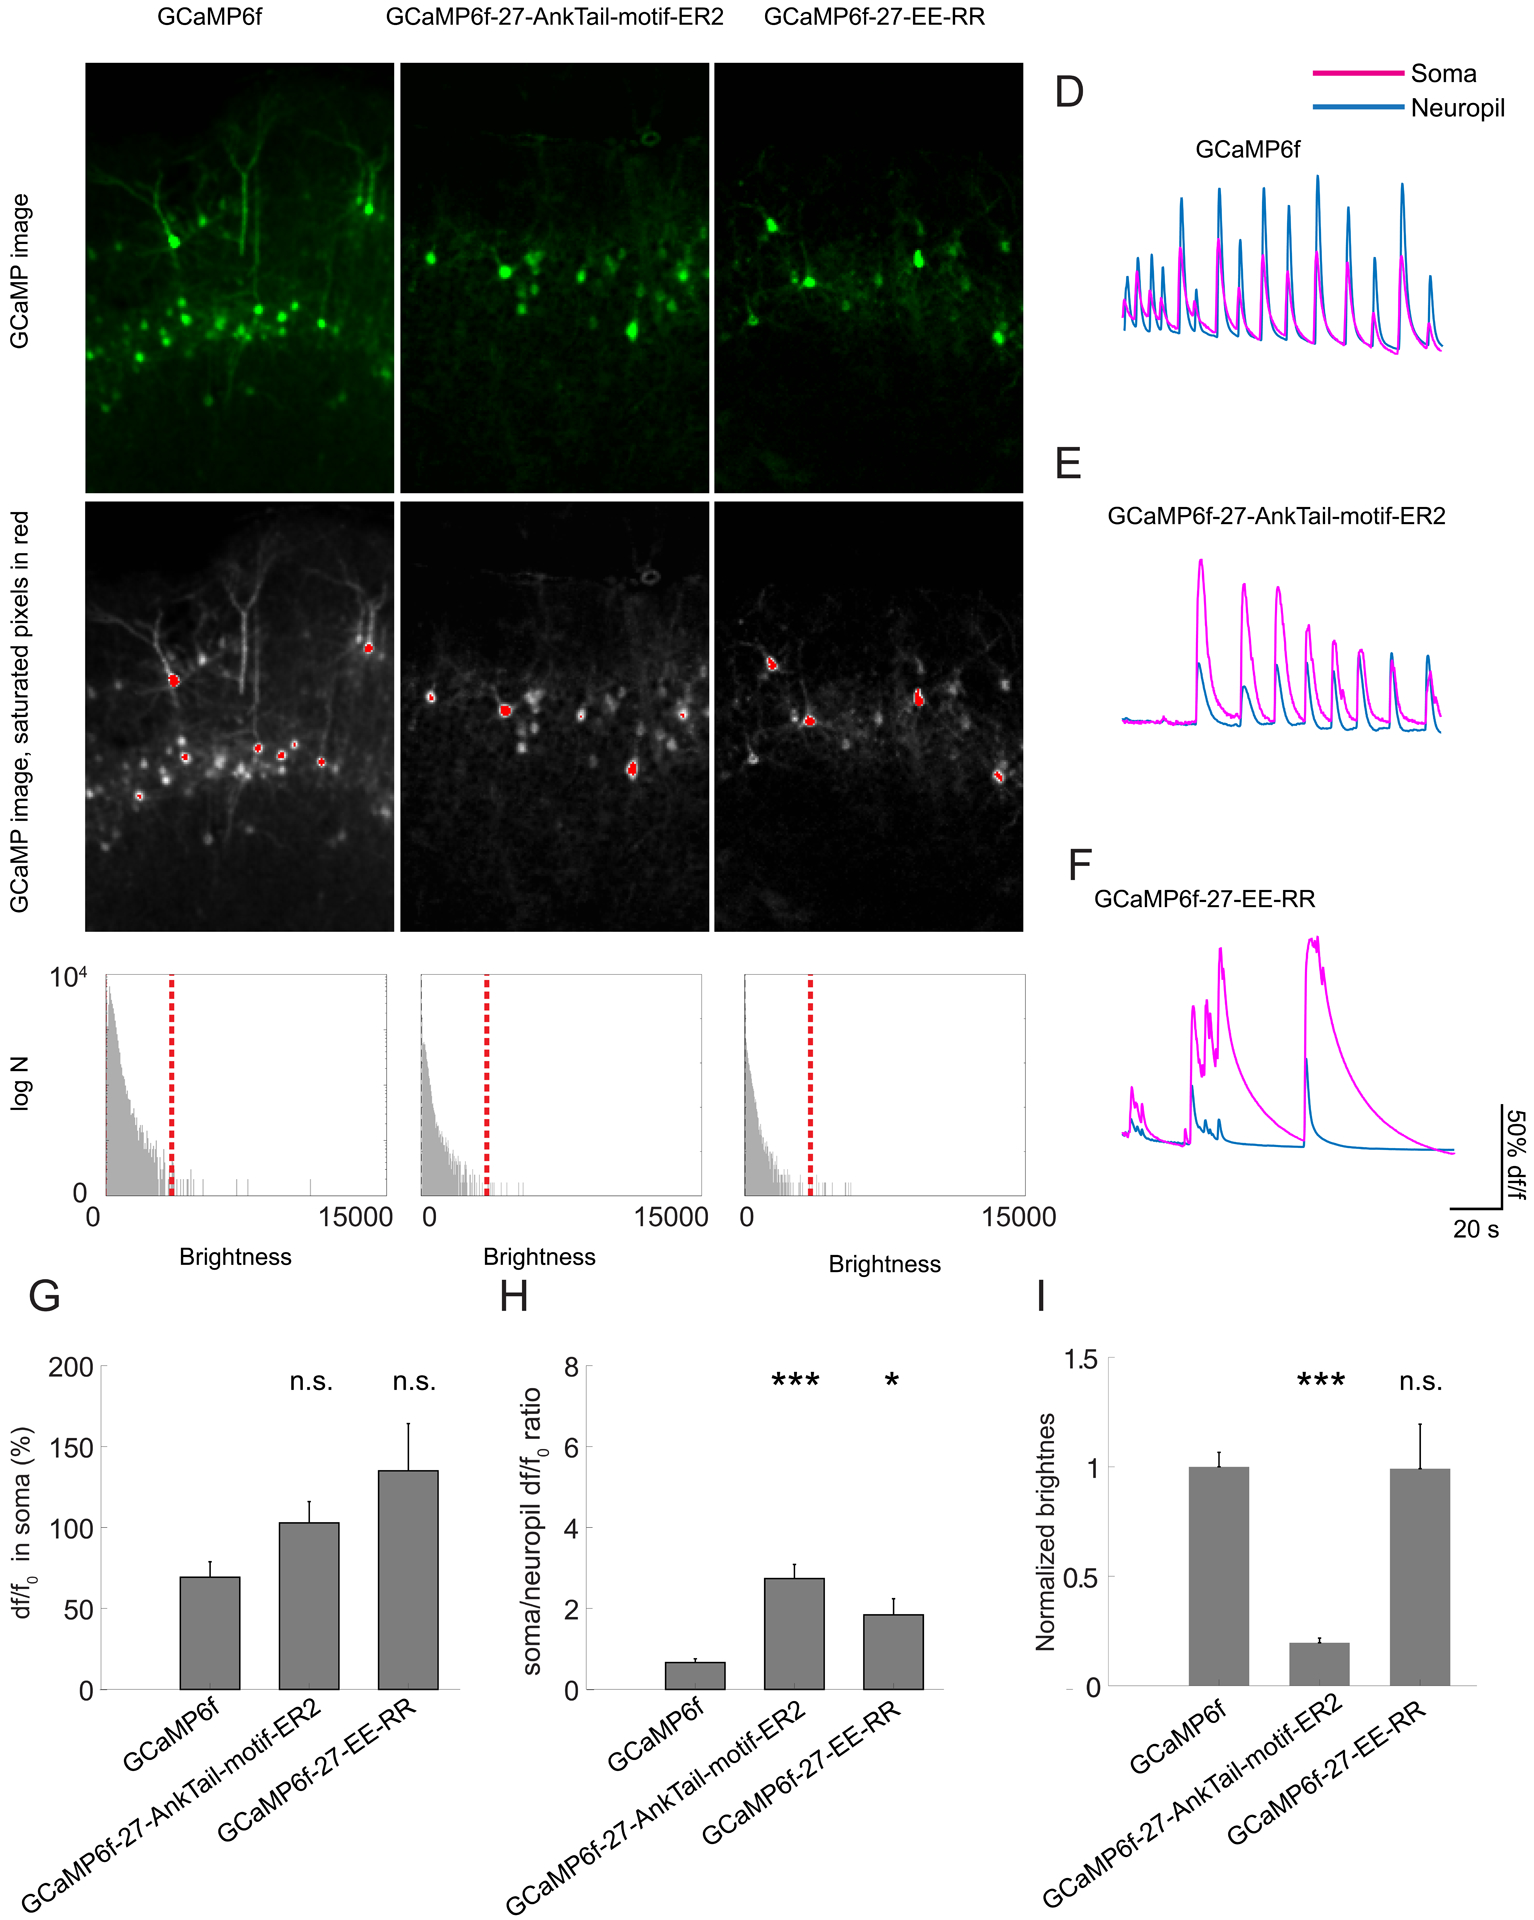
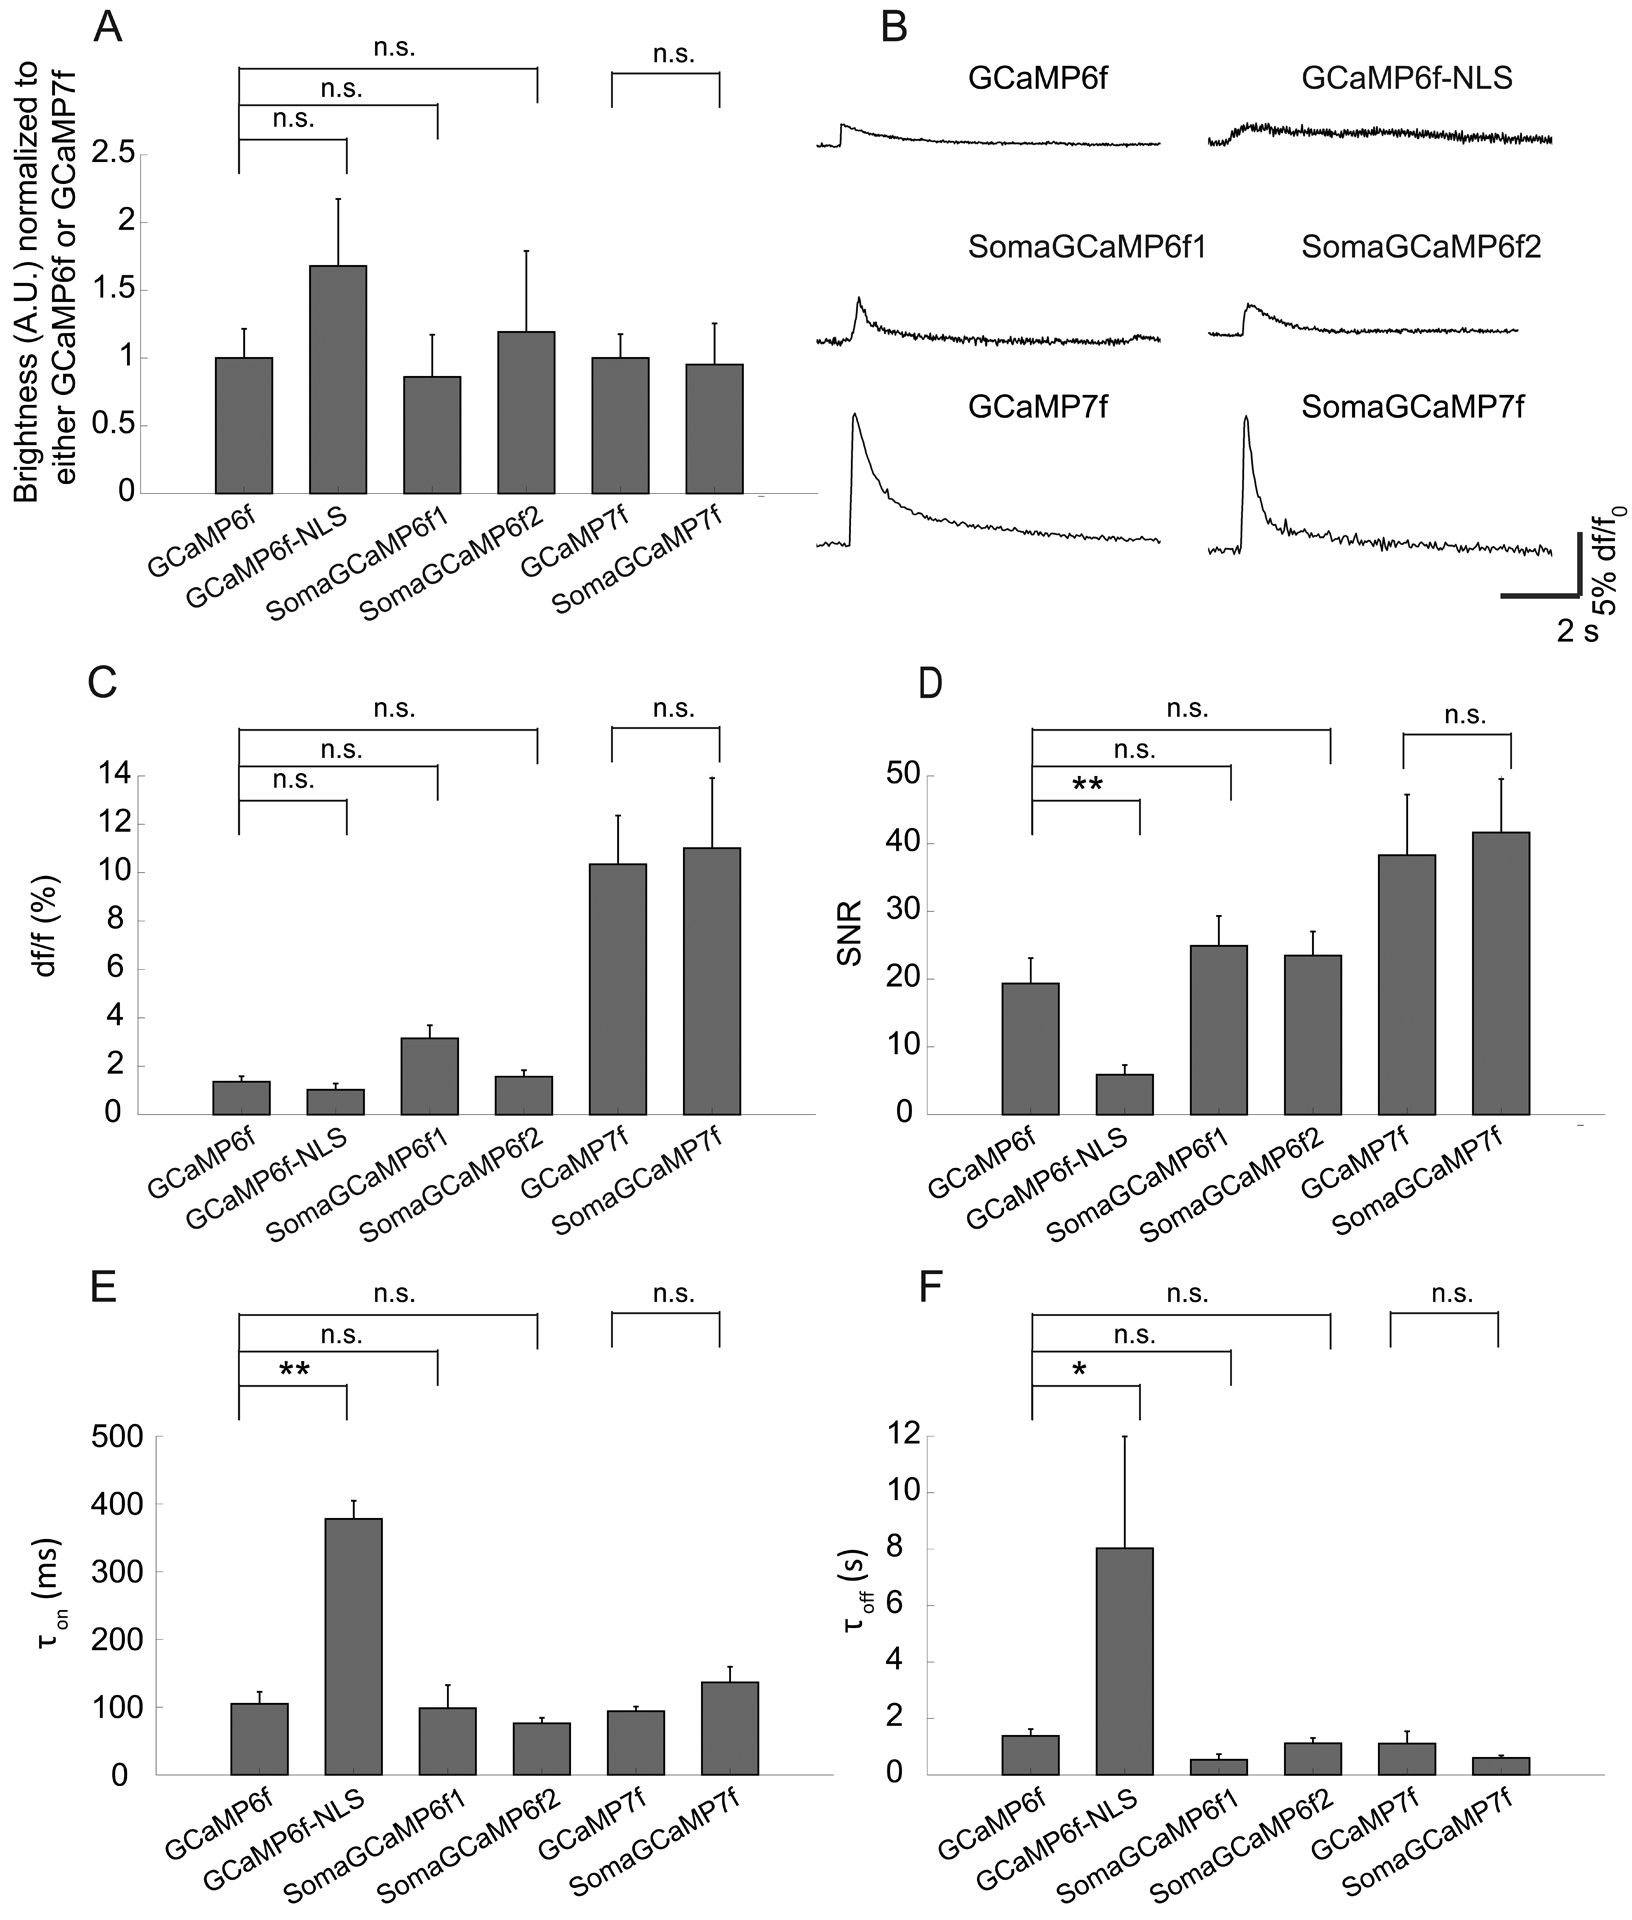
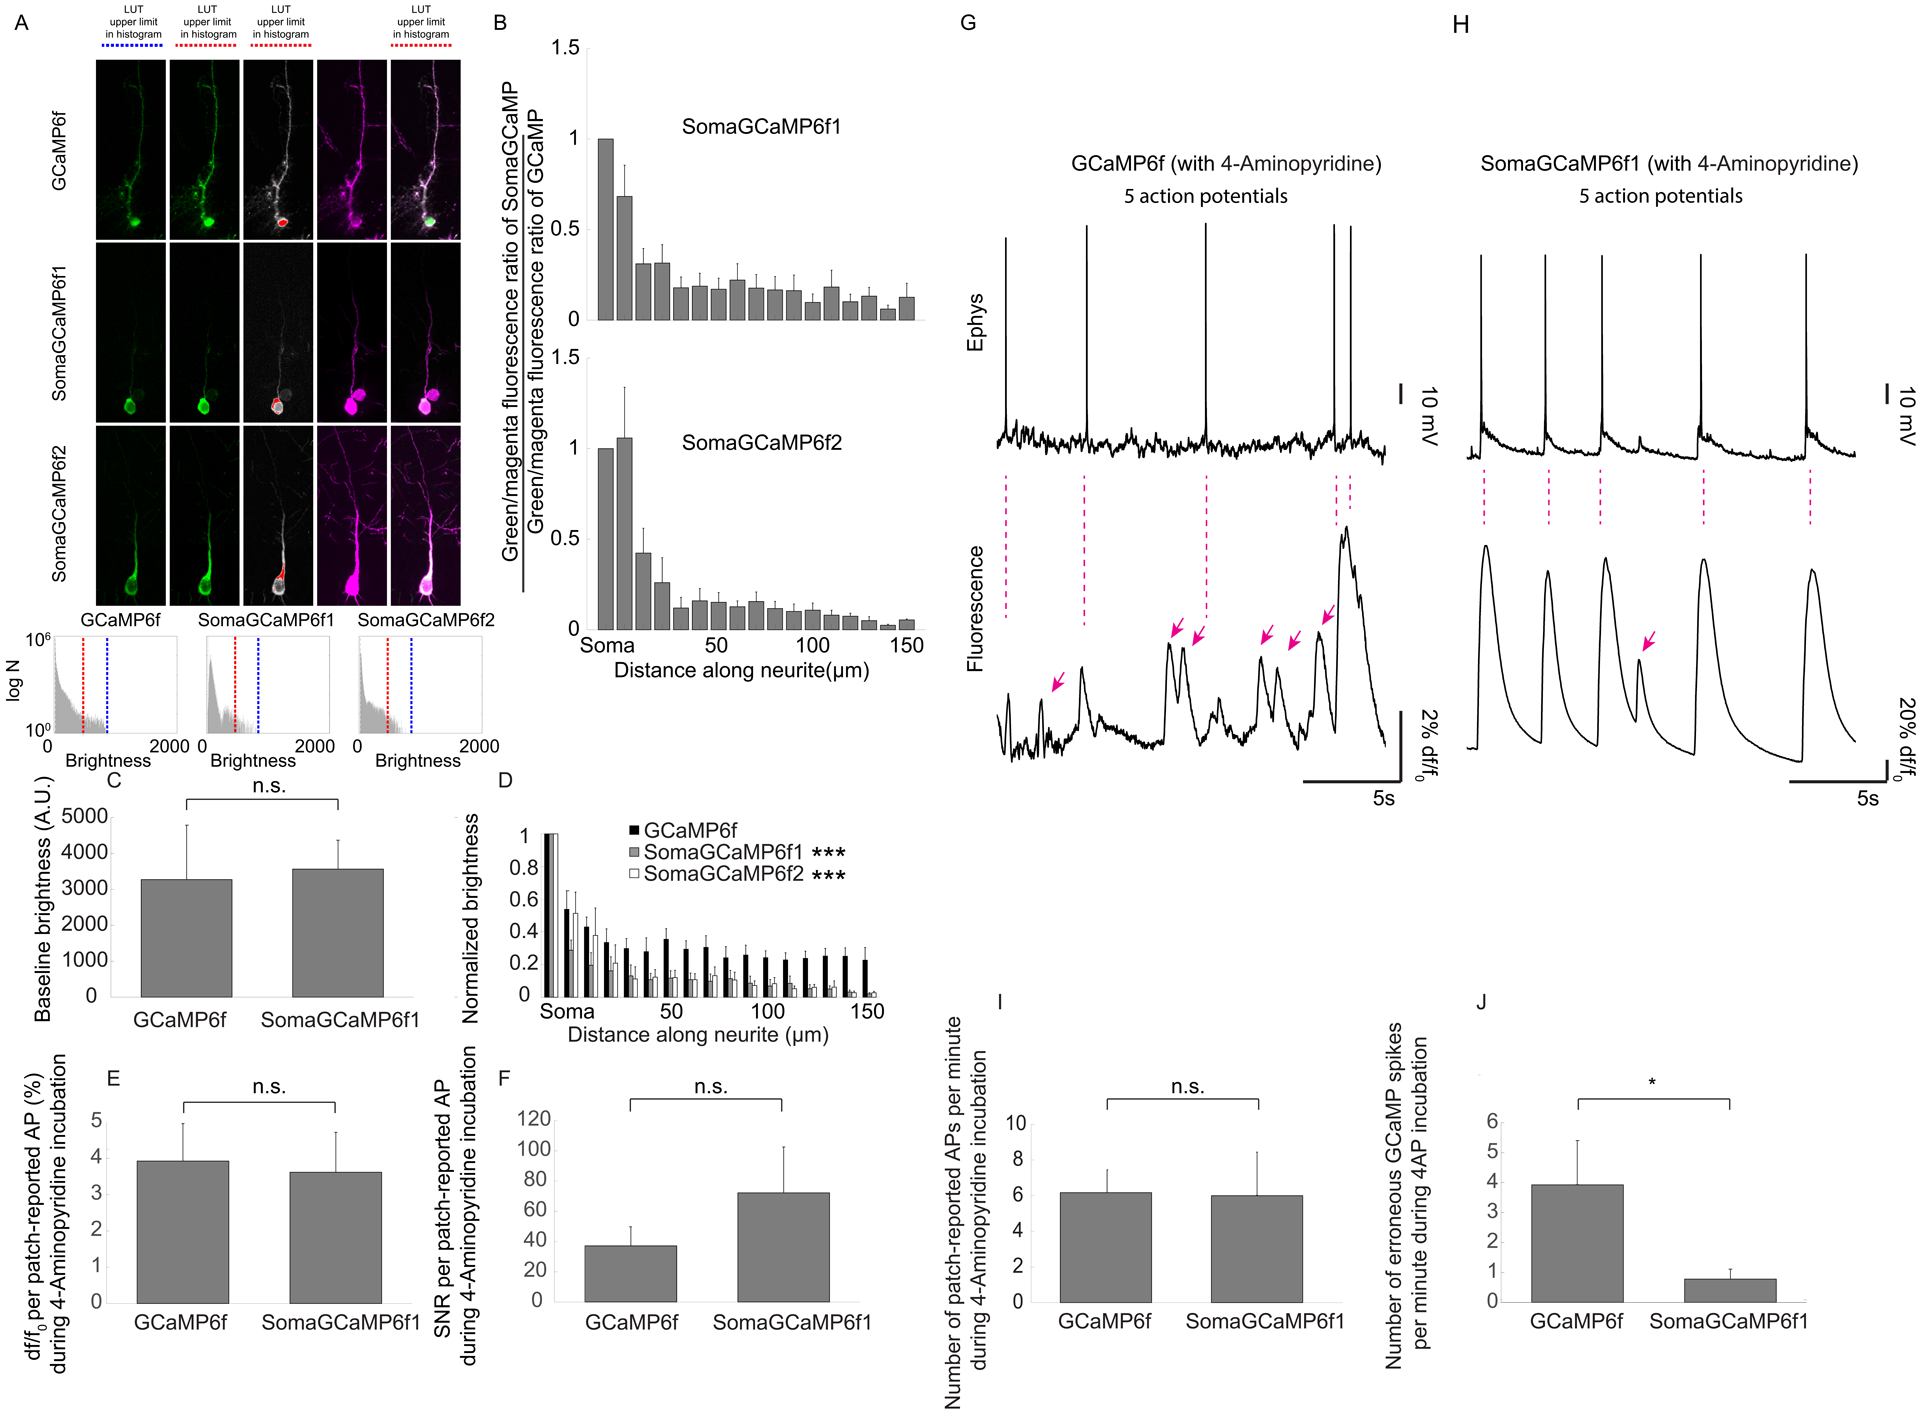
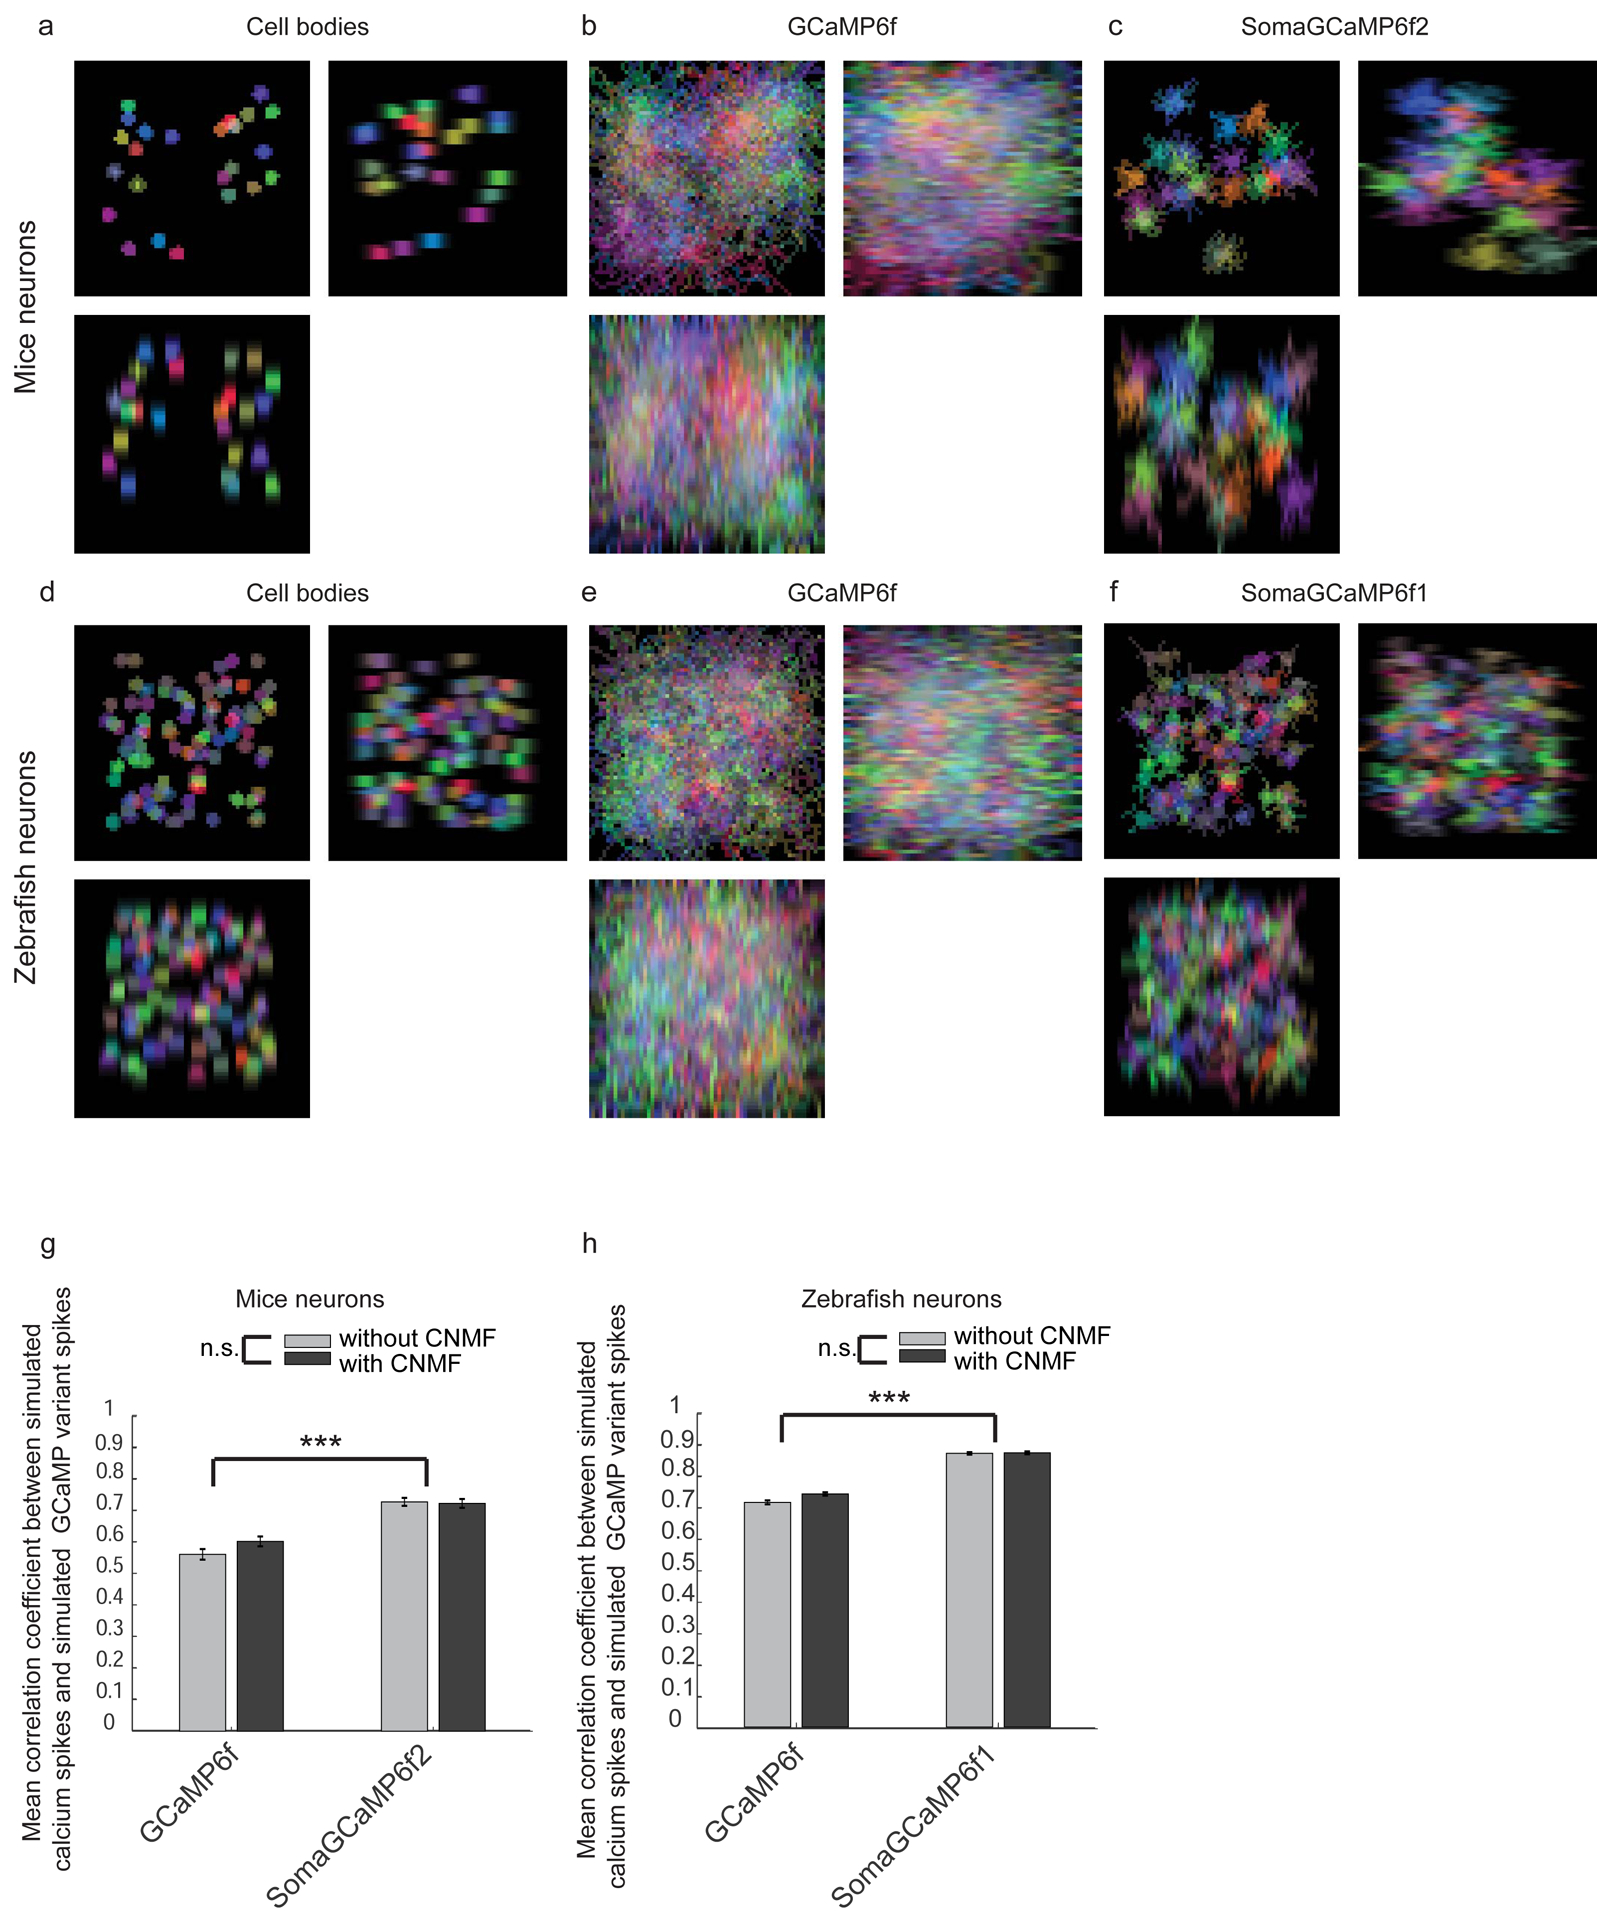
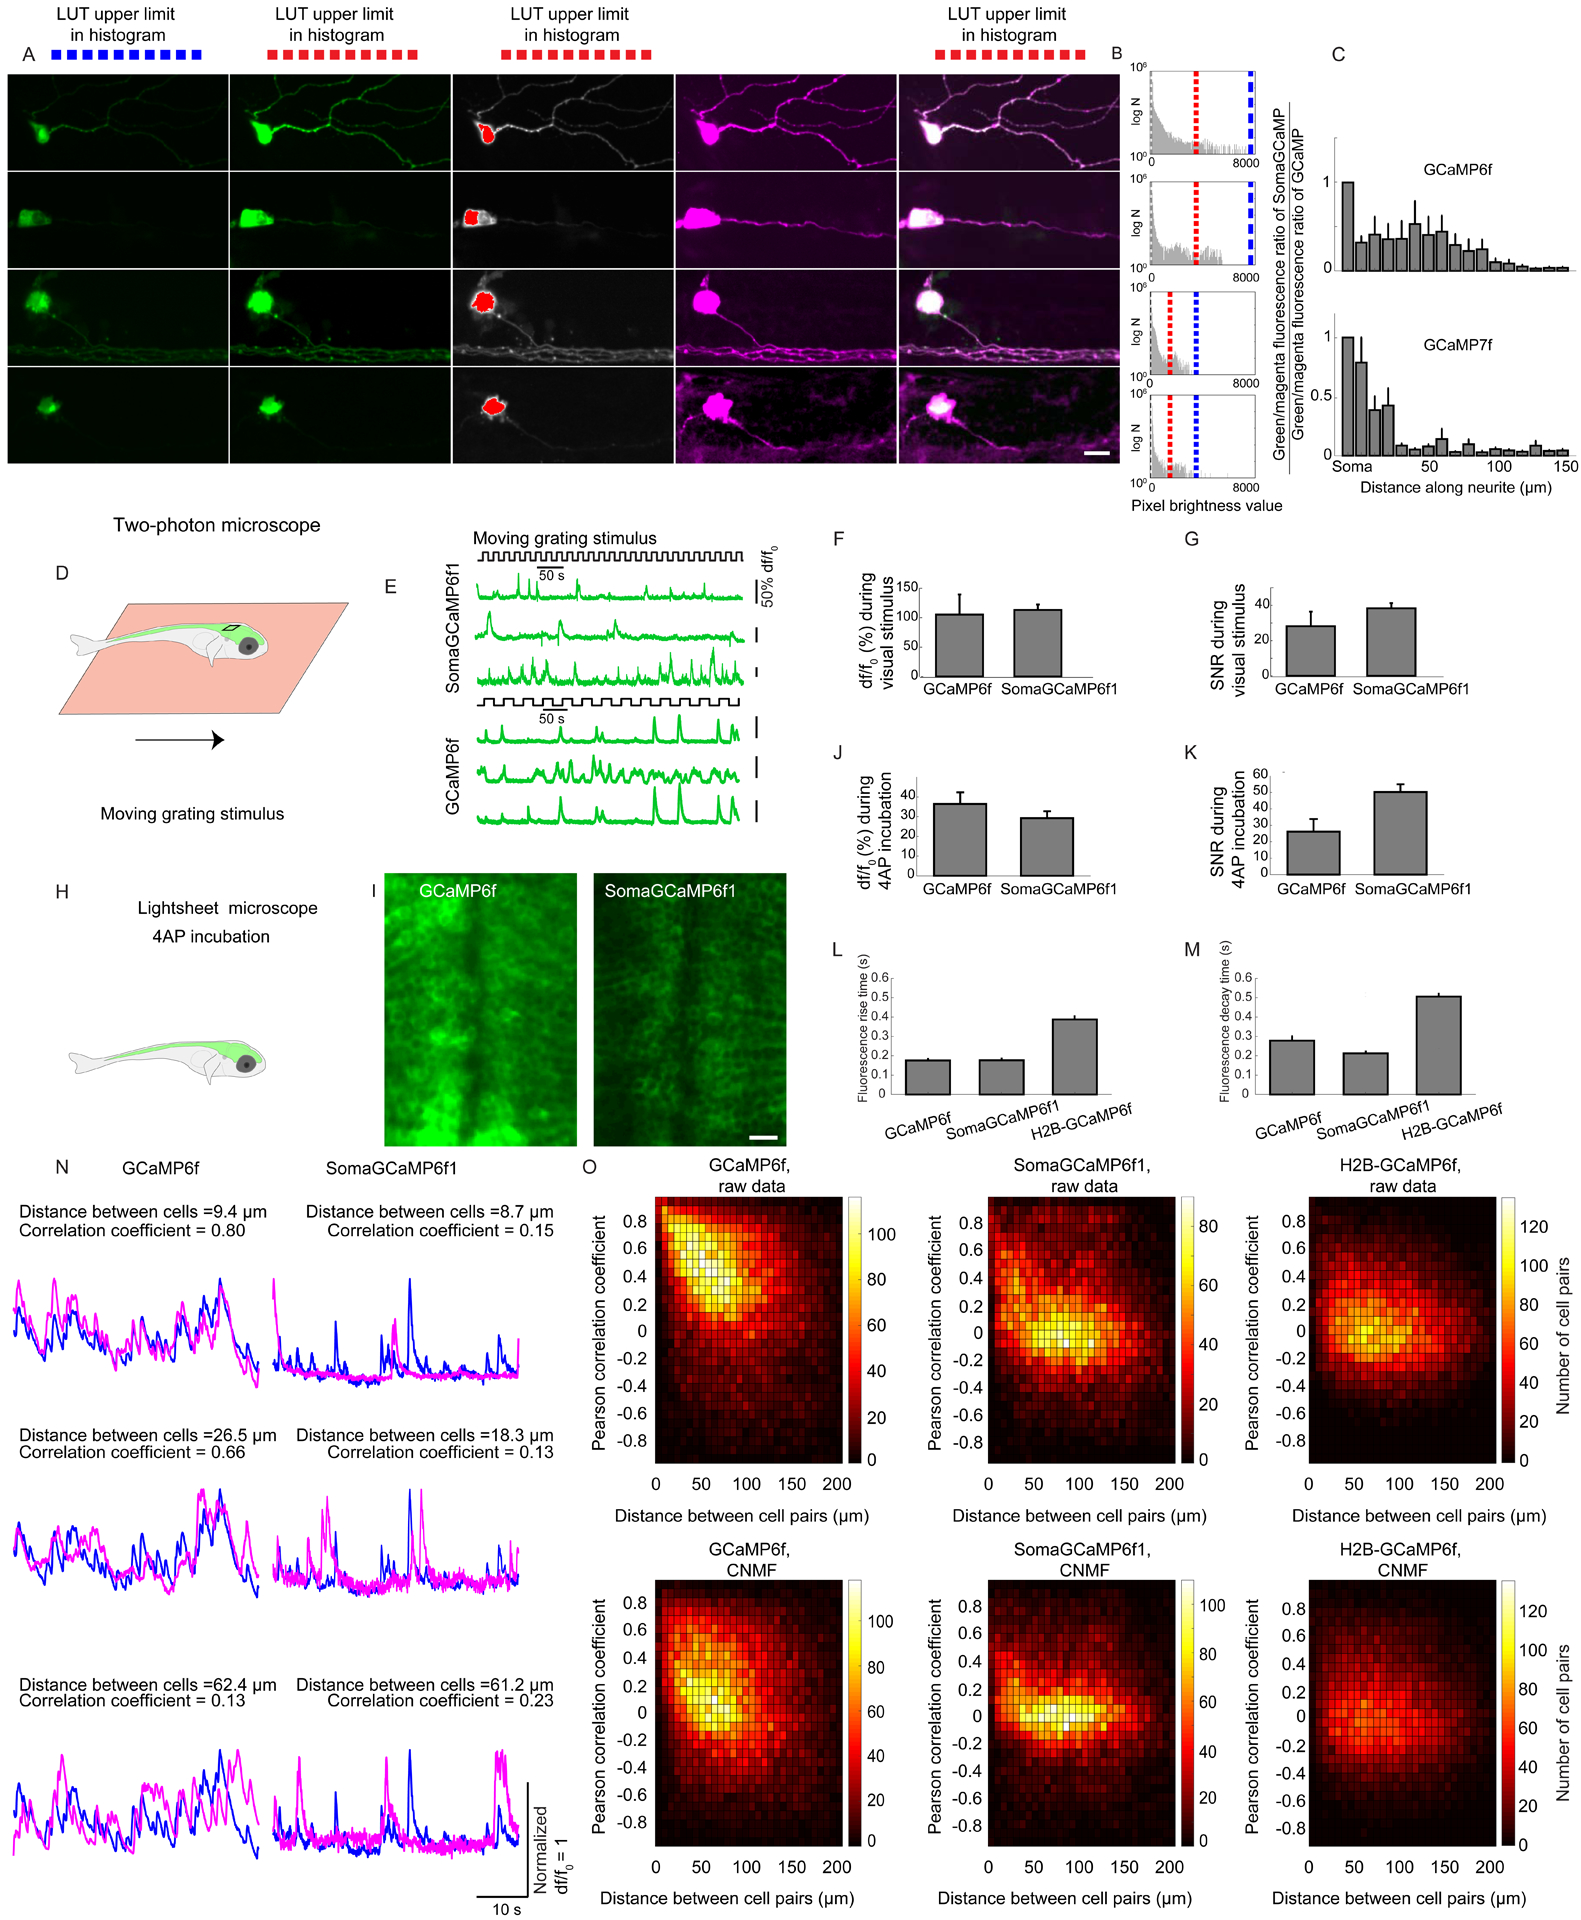
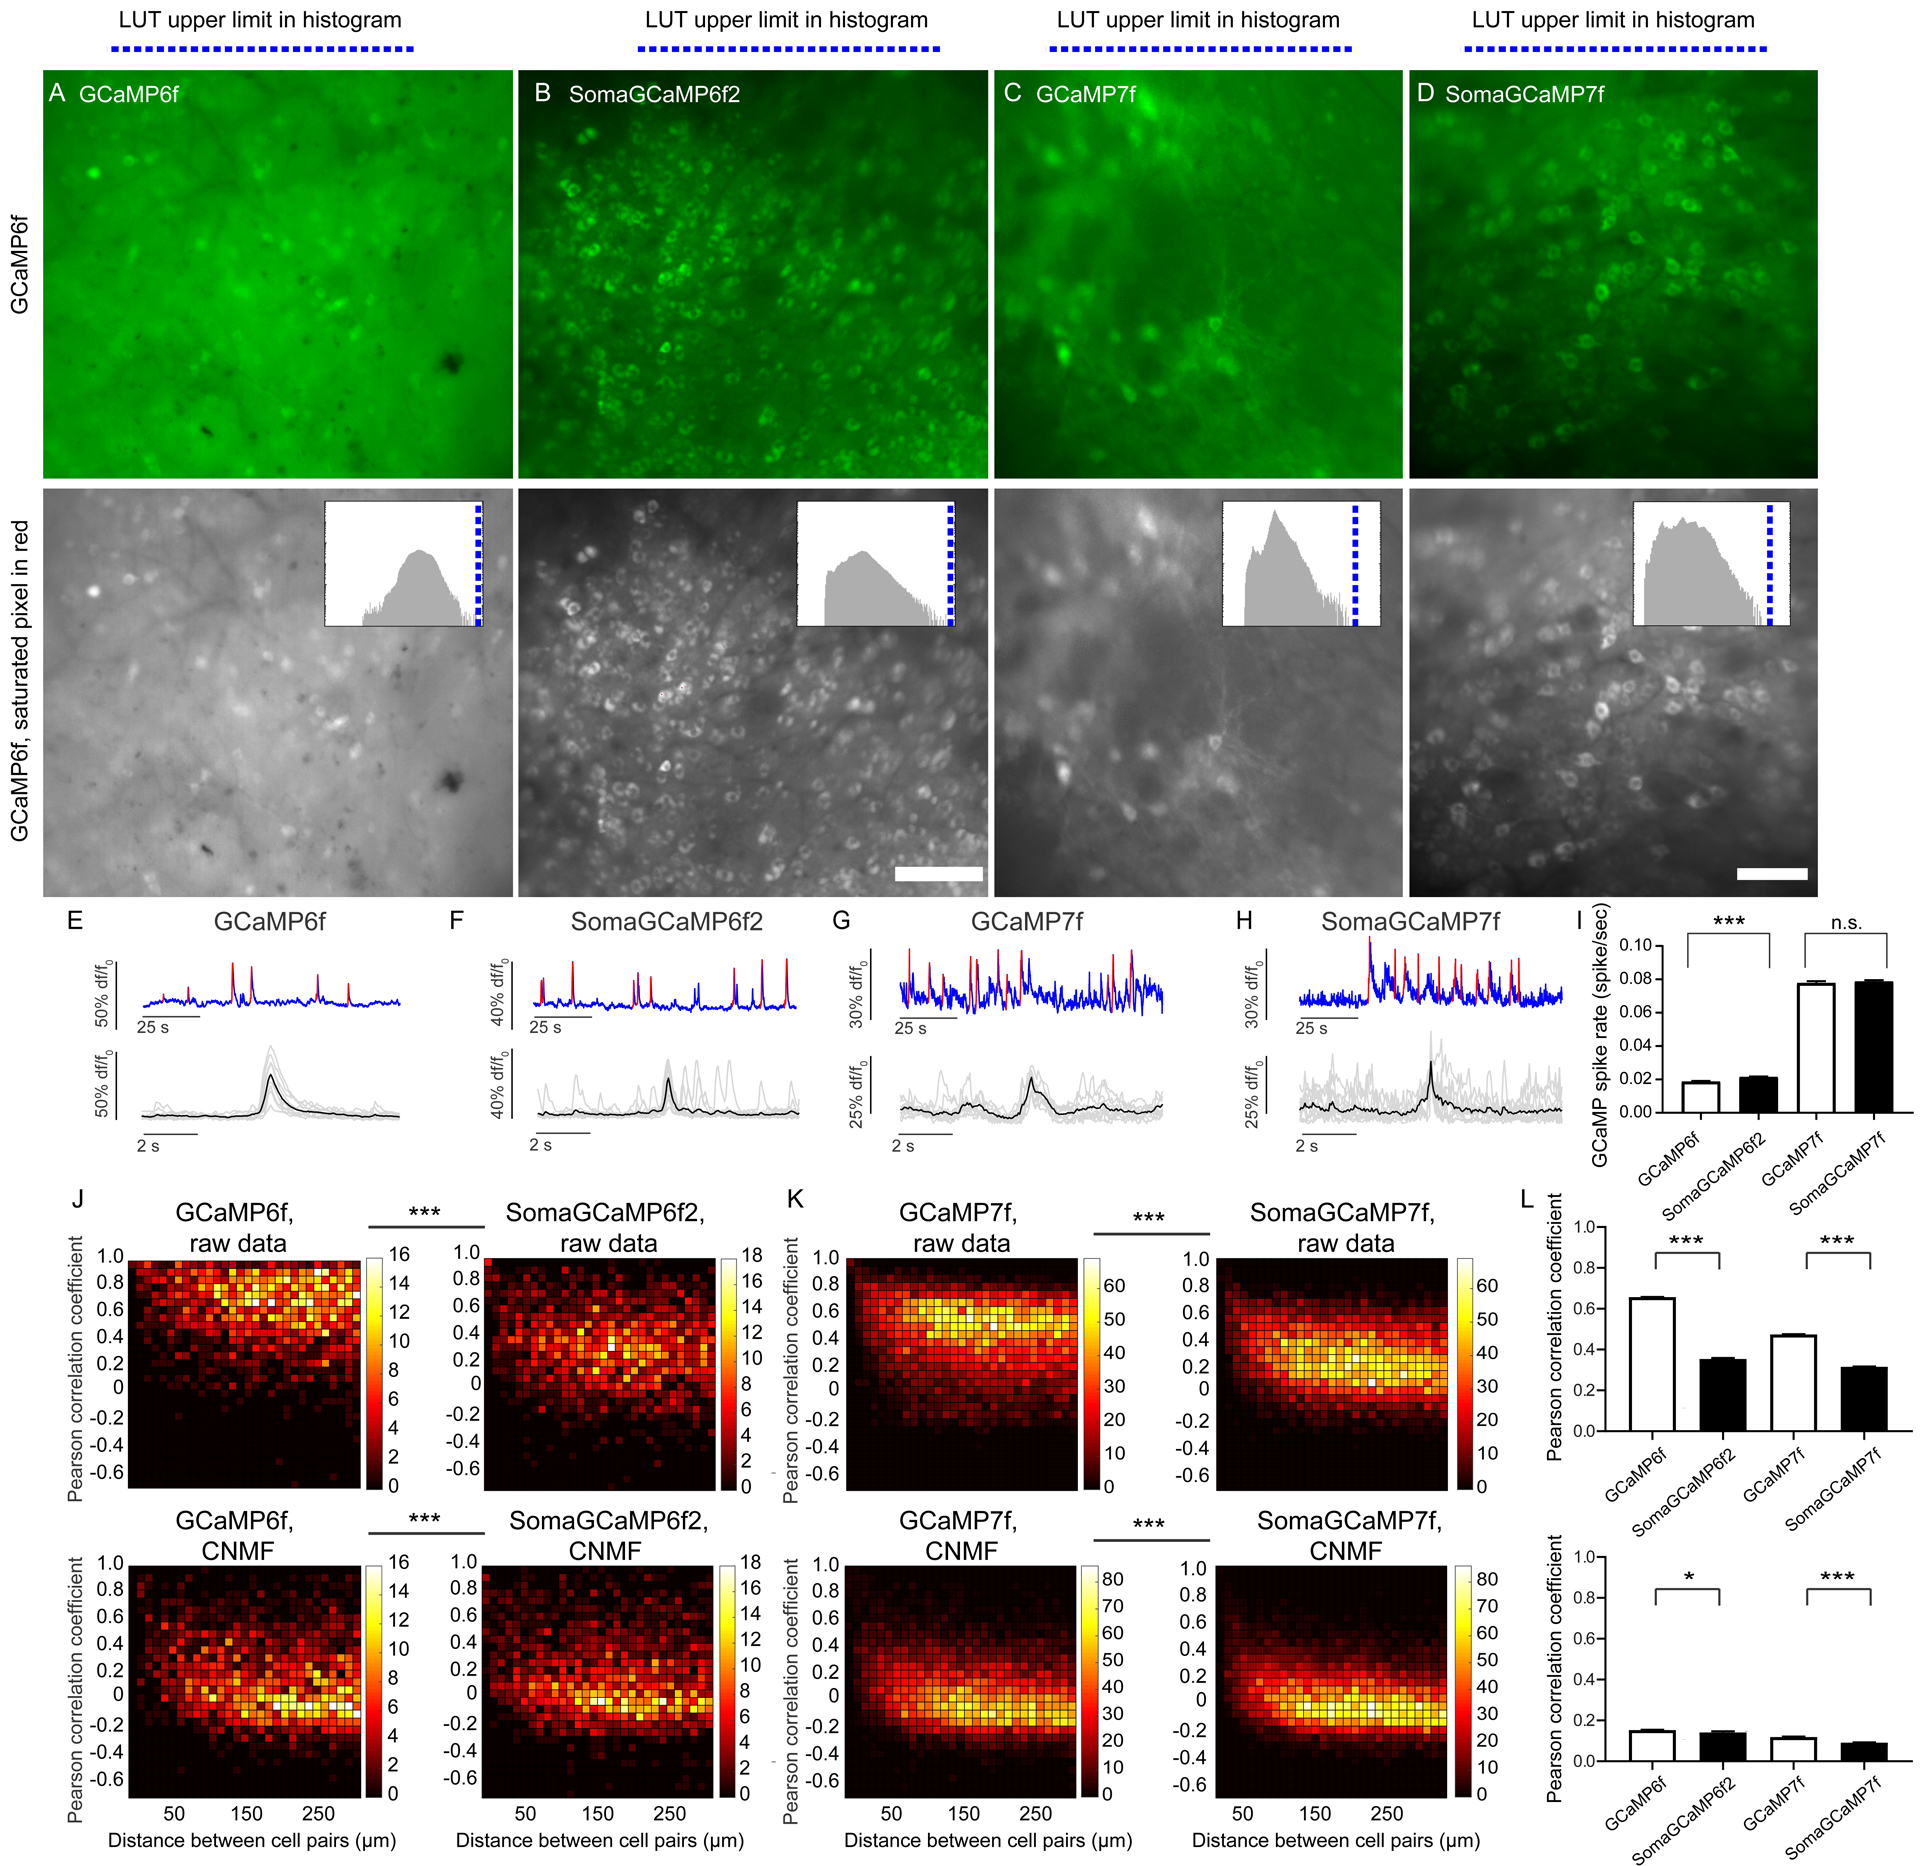
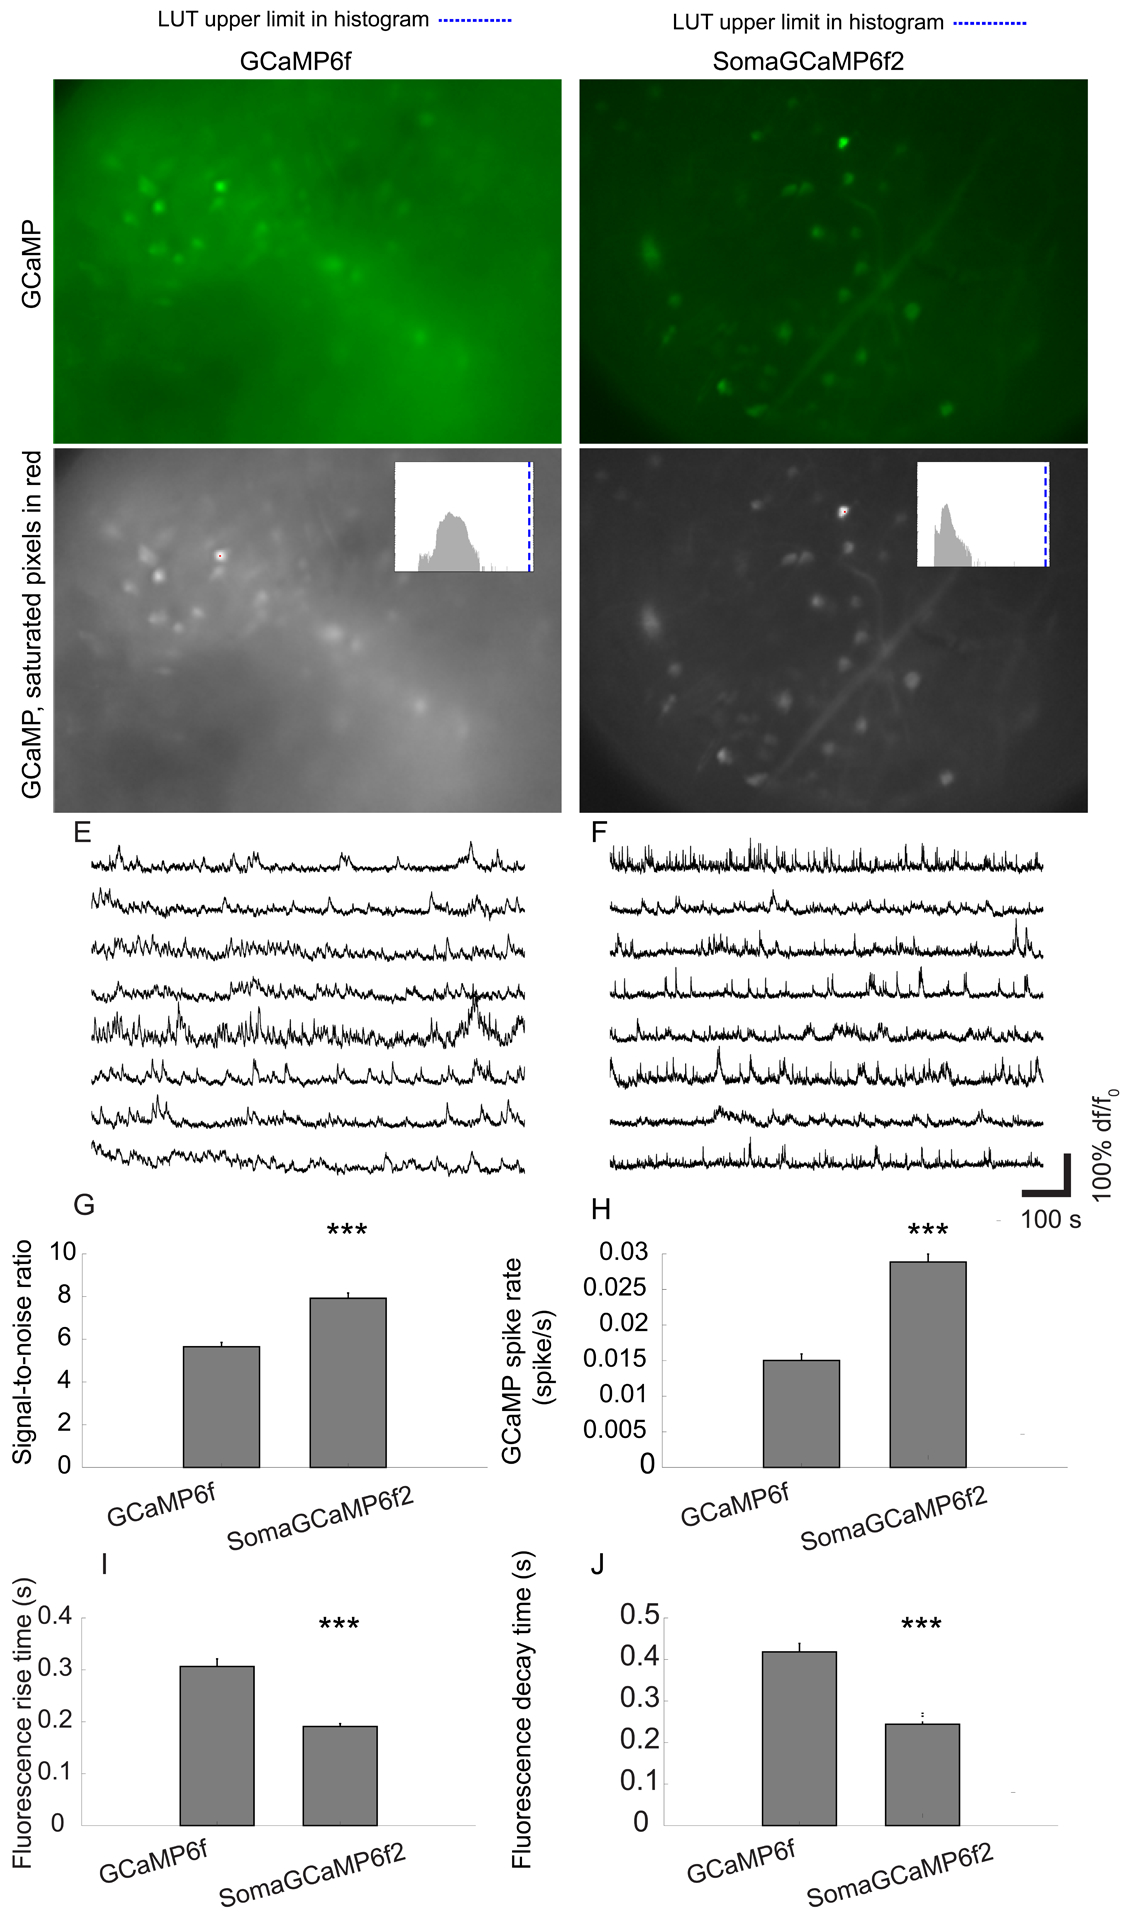
Methods for one-photon fluorescent imaging of calcium dynamics can capture the activity of hundreds of neurons across large fields of view at a low equipment complexity and cost. In contrast to two-photon methods, however, one-photon methods suffer from higher levels of crosstalk from neuropil, resulting in a decreased signal-to-noise ratio and artifactual correlations of neural activity. We address this problem by engineering cell-body-targeted variants of the fluorescent calcium indicators GCaMP6f and GCaMP7f. We screened fusions of GCaMP to natural, as well as artificial, peptides and identified fusions that localized GCaMP to within 50 μm of the cell body of neurons in mice and larval zebrafish. One-photon imaging of soma-targeted GCaMP in dense neural circuits reported fewer artifactual spikes from neuropil, an increased signal-to-noise ratio, and decreased artifactual correlation across neurons. Thus, soma-targeting of fluorescent calcium indicators facilitates usage of simple, powerful, one-photon methods for imaging neural calcium dynamics.

Keywords: GCaMP6; GCaMP7; calcium imaging; correlation; crosstalk; in vivo imaging; microscopy; neuropil contamination; soma-targeting; two-photon microscopy.


Conflict of interest statement

Declaration of Interests O.A.S., C.L., K.D.P., W.M.P., and E.S.B. declare that they applied for a U.S. patent based on the work presented in this paper, Application No.: PCT/US2019/065773.

Figures

Figure 1.
Figure 1.. Somatic GCaMP variants.
Untargeted GCaMP expresses throughout the neural cytosol, so that GCaMP-bearing neurites from nearby cells (A) can bleed into the signals attributed to a given cell body (compare “actual” to “readout”). Restricting GCaMP expression to the cell body would improve imaging (B) by eliminating these neurite signals. (C, D, E, I, J) Representative confocal max projection images of cultured hippocampal neurons expressing wild-type vs. selectively soma-targeted GCaMP6f or GCaMP7f variants, as well as the countermarker miRFP. (C, left panel) A hippocampal neuron in culture expressing GCaMP6f and miRFP, seen in the GFP channel. Look up table (LUT) was adjusted for minimal saturation (blue bar over image refers to the LUT limit in the histogram at far right of C). (C, Second to left panel) The same neuron seen in the GFP channel, LUT adjusted to saturate the cell body (red bar over image refers to the LUT limit in the histogram at far right of C), to help neurites be more visible. (C, third to left panel) The same soma-saturated image, wherein non saturated pixels are presented in grey and saturated pixels in red. (C, middle panel) A zoom-in on the image presented in the left panel. (C, third to right panel) A zoom-in on the image presented in the second to left panel. (C, second to right panel). The neuron seen in the miRFP channel (magenta). (Right panel) Merge of the second to left (soma-saturated GCaMP channel) and the second to right (miRFP channel) panels. A histogram of pixel values is given in the far right. The upper limit for the LUT of the left GCaMP image is given in blue, and the upper limit for the LUT of the second-to-left image is given in red. (D) As in C, for a neuron expressing GCaMP6f-27-AnkTail-motif-ER2 (SomaGCaMP6f1). (E) As in C, for a neuron expressing GCaMP6f-27-EE-RR (SomaGCaMP6f2). (I) As in C, for a neuron expressing GCaMP7f. (J) As in C, for a neuron expressing GCaMP7f-27-EE-RR (SomaGCaMP7f). Scalebar: 20 μm. (F) Bar plot (mean + standard error) of GCaMP6f brightness versus position along a neurite, normalized to somatic brightness, of neurons as in C (n = 8 neurites from 8 cells from 3 cultures). (G) As in F, for neurons expressing SomaGCaMP6f1 (n = 5 neurites from 5 cells from 2 cultures). ***P < 0.001, Kruskal-Wallis analysis of variance of neurite brightness followed by post-hoc test via Steel’s test with GCaMP6f as control; Supplemental Table 2, statistics for Figure 1). (H) As in F, for neurons expressing GCaMP6f-27-EE-RR (SomaGCaMP6f2; n = 5 neurites from 5 cells from 3 cultures). ***P < 0.001, Kruskal-Wallis analysis of variance of neurite brightness followed by post-hoc test via Steel’s test with GCaMP6f as control). (K) As in F, for neurons expressing GCaMP7f (n = 6 neurites from 6 cells from 2 cultures). (L) As in F, for neurons expressing SomaGCaMP7f (n = 6 neurites from 6 cells from 2 cultures). ***P < 0.001, Wilcoxon rank sum test of neurite brightness followed by post-hoc test via Steel’s test with GCaMP6f as control). Supplemental Table 8, percentage of saturated pixels in GCaMP images.
Figure 2.
Figure 2.. Brain slice screening of soma-targeted GCaMP6f candidates.
(A-C) Representative max projections of confocal images of mouse cortical slices expressing GCaMP6f variants. Scale bar: 200μm. (A) GCaMP6f. (B) GCaMP6f-27-AnkTail-motif-ER2 (SomaGCaMPf1). (C) GCaMP6f-27-EE-RR (SomaGCaMPf2). Top, GCaMP channel shown in green; bottom, GCaMP nonsaturated pixels shown in gray, with saturated pixels shown in red. Brightness histograms of the images presented in A, B, and C are shown below the respective images. Red line denotes the upper LUT limit. Supplemental Table 8, percentage of saturated pixels in GCaMP images. (D-F) Representative traces of the GCaMP signals from the soma (magenta) and the neuropil (blue). (G) Bar chart showing df/f0 in the somata of neurons expressing different GCaMP6f targeting variants (n = 20 cells from 2 slices from 2 mice for each variant). n.s., not significant, Kruskal-Wallis analysis of variance followed by post-hoc test via Steel’s test with GCaMP6f as control group; see Supplemental Table 2, statistics for Figure 2. Plotted is mean plus or minus standard error throughout. (H) Bar chart showing the ratio between df/f0 at the cell body vs. the neuropil for different GCaMP6f targeting variants (n = 20 cells from 2 slices from 2 mice for each variant). *P < 0.05, ***P < 0.001, Kruskal-Wallis analysis of variance followed by post-hoc test via Steel’s test with GCaMP6f as control group. (I) Bar chart showing the baseline brightness of the cell body for different GCaMP6f targeting variants (n = 20 cells from 2 slices from 2 mice for each variant). ***P < 0.001, n.s., not significant, Kruskal-Wallis analysis of variance followed by post-hoc test via Steel’s test with GCaMP6f as control group.
Figure 3.
Figure 3.. Kinetics and sensitivity of SomaGCaMPs
GCaMP6f, GCaMP6f-NLS (nuclear localization sequence), SomaGCaMP6f1, SomaGCaMP6f2, GCaMP7f and SomaGCaMP7f were expressed in hippocampal neurons. (A) Baseline brightness values for GCaMP variants (n = 8 cells from 2 cultures for GCaMP6f; n = 7 cells from 2 cultures for SomaGCaMP6f1; n = 5 cells from 2 cultures for SomaGCaMP6f2; n = 7 cells from 2 cultures for GCaMP6f-NLS; n = 6 cells from 2 cultures for GCaMP7f; n = 7 cells from 3 cultures for SomaGCaMP7f). Brightness was normalized to GCaMP brightness. n.s., not significant; for GCaMP6f, GCaMP6f-NLS, SomaGCaMP6f1, and SomaGCaMP6f2, Kruskal-Wallis analysis of variance followed by post-hoc test via Steel’s test with GCaMP6f as control group; for GCaMP7f and SomaGCaMP7f, Wilcoxon rank sum test; Supplemental Table 2, statistics for Figure 3. Plotted is mean plus or minus standard error throughout. (B) Representative fluorescence response for one action potential (AP) in the cell body for cultured neurons expressing GCaMPs and SomaGCaMPs. (C) df/f0 for GCaMPs and SomaGCaMPs (n = 8 cells from 2 cultures for GCaMP6f; n = 5 cells from 2 cultures for SomaGCaMP6f1; n = 7 cells from 2 cultures for SomaGCaMP6f2; n = 8 cells from 2 cultures for GCaMP6f-NLS; n = 6 cells from 2 cultures for GCaMP7f; n = 7 cells from 3 cultures for SomaGCaMP7f). n.s., not significant; statistical tests as in A. (D) Signal-to-noise ratio (SNR), defined as the magnitude of the fluorescence change caused by a single AP divided by the standard deviation of the baseline fluorescence, for GCaMPs and SomaGCaMPs (n’s as in panel C). **, P < 0.01; n.s., not significant; statistical tests as in A. (E) Time constant for signal rise (Ton) during a single AP for GCaMPs and SomaGCaMPs (n = 8 cells from 2 cultures for GCaMP6f; n = 5 cells from 2 cultures for SomaGCaMP6f1; n = 6 cells from 2 cultures for SomaGCaMP6f2; n = 8 cells from 2 cultures for GCaMP6f-NLS; n = 6 cells from 2 cultures for GCaMP7f; n = 7 cells from 3 cultures for SomaGCaMP7f). **, P < 0.01; n.s., not significant; statistical tests as in A. (F) Time constant for signal decay (Toff) after a single AP for GCaMPs and SomaGCaMPs (n = 7 cells from 2 cultures for GCaMP6f; n = 5 cells from 2 cultures for SomaGCaMP6f1; n = 7 cells from 2 cultures for SomaGCaMP6f2; n = 8 cells from 2 cultures for GCaMP6f-NLS; n = 6 cells from 2 cultures for GCaMP7f; n = 7 cells from 3 cultures for SomaGCaMP7f). *, P < 0.05; n.s., not significant; statistical tests as in A.
Figure 4.
Figure 4.. Decreased neuropil crosstalk in mouse brain slices expressing SomaGCaMP.
(A) Representative maximum intensity projections of confocal stacks of neurons expressing (from top to bottom) GCaMP6f, SomaGCaMP6f1, and SomaGCaMP6f2 in mouse cortical brain slices. Non-saturated images of the GCaMP channel are presented in the leftmost panels (LUT histogram shown below, with blue bar the upper end of the range), soma-saturated images that highlight GCaMP fluorescence in neurites are given in the next column (LUT histogram below, with red bar the upper end of the range), soma-saturated images with nonsaturated pixels in grey and saturated pixels in red are shown in the third column, mScarlet is shown in magenta in the fourth column, and finally the fifth column shows merged images (between the soma-saturated GCaMP and mScarlet images). Scale bar: 20μm. Supplemental Table 8, percentages of saturated pixels in GCaMP images. (B, top) Bar plots of (SomaGCaMP6f1 brightness / mScarlet brightness) divided by (GCaMP6f brightness / mScarlet brightness) versus position along a neurite. (GCaMP6f, n = 5 neurons from 4 slices from 2 mice; SomaGCaMP6f1, n = 9 neurons from 4 slices from 2 mice). Plotted is mean plus or minus standard error throughout this figure. (B, bottom) As in B, top, but for SomaGCaMP6f2. (GCaMP6f, n = 5 neurons from 4 slices from 2 mice; SomaGCaMP6f2, n = 6 neurons from 3 slices from 2 mice). Supplemental Table 3, statistics for Figure 4. (C) Bar chart showing baseline brightness for GCaMP6f or SomaGCaMP6f1 in brain slice, following light power tuning to make them equal (n = 7 neurons from 2 slices from 2 mice for GCaMP6f; n = 22 neurons from 6 slices from 3 mice for SomaGCaMP6f1). n.s., not significant, Wilcoxon rank sum test. (D) Bar plot of brightness versus position along a neurite, normalized to brightness at the soma, from neurons expressing GCaMP6f variants (GCaMP6f, n = 5 neurons from 4 slices from 2 mice; SomaGCaMP6f1, n = 9 neurons from 4 slices from 2 mice; SomaGCaMP6f2, n = 6 neurons from 3 slices from 2 mice.). ***P < 0.001, Kruskal-Wallis analysis of variance followed by post-hoc test via Steel’s test, comparing to GCaMP6f. (E) Bar chart showing df/f0 at somata of neurons expressing GCaMP6f variants (n = 14 APs from 3 neurons from 3 slices from 2 mice for GCaMP6f; n = 6 APs from 3 neurons from 3 slices from 3 mice for SomaGCaMP6f1). Statistics as in C. (F) Bar chart showing SNR at somata of neurons expressing GCaMP6f variants (n = 14 APs from 3 neurons from 3 slices from 2 mice for GCaMP6f; n = 6 APs from 3 neurons from 3 slices from 3 mice for SomaGCaMP6f1). Statistics as in C. (G, top) Representative patch recording of a cell expressing GCaMP6f under 4-AP stimulation. (G, bottom) GCaMP6f signal from the cell recorded in G, top. Magenta arrows, GCaMP spikes that lack patch spikes. (H) As in G, but for a cell expressing SomaGCaMP6f1. (I) Bar chart showing patch-reported APs per minute in neurons expressing GCaMP6f variants (n = 8 neurons from 8 slices for GCaMP6f from 4 mice; n = 6 neurons from 6 slices for SomaGCaMP6f1 from 3 mice). Statistics as in C. (J) Bar chart showing erroneous GCaMP spikes per minute in neurons expressing GCaMP6f variants (n = 8 neurons from 8 slices from 4 mice for GCaMP6f; n = 6 neurons from 6 slices from 3 mice for SomaGCaMP6f1). *P < 0.05, Wilcoxon rank sum test.
Figure 5.
Figure 5.. Simulation of soma-targeting of GCaMP vs. post-hoc computational demixing using CNMF.
(A) Simulated images of cell bodies from mouse cortical in vivo imaging. Scale bars: 10 μm for XY images, 5 μm for XZ and YZ images, throughout the figure. (B) Simulated images of GCaMP from mouse in vivo imaging. (C) Simulated images of SomaGCaMP from mouse in vivo imaging. (D-F) As in A-C, but for the zebrafish midbrain. (G) Mean correlation coefficient between simulated ground-truth calcium dynamics and simulated recorded calcium dynamics for the mouse brain as in A-C, before (light gray) and after (dark gray) CNMF (n = 300 neurons from 10 simulations for each GCaMP variant). ***P < 0.001, two-way analysis of variance (ANOVA), followed by post-hoc Tukey’s HSD test; Supplemental Table 4, statistics for Figure 5. Plotted is mean plus or minus standard error in G, H. (H) As in G but for the zebrafish (n = 1200 neurons from 10 simulations for each GCaMP variant).
Figure 6.
Figure 6.. Decreased neuropil crosstalk in SomaGCaMP-expressing larval zebrafish.
(A) Representative images of neurons expressing GCaMP6f, SomaGCaMP6f1, GCaMP7f, or SomaGCaMP7f in zebrafish larvae at 5 dpf. Images and histograms are formatted as in Figure 4A. Scale bar: 5μm. Supplemental Table 8, percentages of saturated pixels in GCaMP images. (B) Histograms of pixel brightnesses for the images of A, formatted as in Figure 4A. (C, top) Bar plots of (SomaGCaMP brightness/mCherry brightness) divided by (GCaMP brightness/mCherry brightness) versus position along a neurite (GCaMP6, n = 8 neurons from 4 fishes; SomaGCaMP6f1, n = 7 neurons from 6 fishes). Supplemental Table 3, statistics for Figure 6. (C, bottom) As in C, top, but for GCaMP7f (n = 5 neurons from 3 fishes) and SomaGCaMP7f (n = 5 neurons from 3 fishes). (D) Fish were imaged under the 2-photon microscope, and exposed to a moving grating as a visual stimulus. (E) Representative calcium traces for the experiment of D. (F) Bar chart showing df/f0 at somata of neurons in the optic tectum for the experiment of D (n = 6 neurons from 3 fishes for GCaMP6f; n = 5 neurons from 3 fishes for SomaGCaMP6f1). n.s., not significant, Wilcoxon rank sum test. (G) As in F but for signal-to-noise ratio (SNR). (H) Fish were imaged using a lightsheet microscope and 4-AP pharmacological stimulation. (I) Images of neurons expressing GCaMP6f variants taken at a depth of 70 μm from the top of the brain, in the zebrafish midbrain. Scale bar: 10μm. (J) Bar chart showing df/f0 at the somata of zebrafish neurons in the forebrain for the experiment of H (n = 5 neurons from 2 fishes for GCaMP6f; n = 5 neurons from 2 fishes for SomaGCaMP6f1). n.s., not significant, Wilcoxon rank sum test. (K) As in J but for signal-to-noise ratio (SNR). *P < 0.05, Wilcoxon rank sum test. (L) Bar chart of fluorescence rise time at somata of neurons for the experiment of H (n = 101 neurons from 5 fishes for GCaMP6f; n = 146 neurons from 4 fishes for SomaGCaMP6f1; n = 513 neurons from 6 fishes for H2B-GCaMP6f). ***P < 0.001, Kruskal-Wallis analysis of variance followed by post-hoc test via Steel’s test. (M) As in L but for fluorescence decay time. (N) Traces, normalized to maximum, of representative cell pairs in the forebrain expressing GCaMP6f variants that are ~10 μm (top row), ~20 μm (middle row) and ~50 μm (bottom row) apart, during 4-AP stimulation. (O) Density plot showing Pearson correlation coefficients of cell pairs in the forebrain as a function of distance for GCaMP6f (n = 426 cells from 5 fishes), SomaGCaMP6f1 (n = 340 cells from 4 fishes) or H2B-GCaMP6f (n = 676 cells from 6 fishes), during 4-AP stimulation. Top, without CNMF; bottom, with CNMF. ***P < 0.001, two-dimensional Kolmogorov-Smirnov test with GCaMP6f as control condition.
Figure 7.
Figure 7.. SomaGCaMP reduces neuropil contamination in the striatum of behaving mice.
(A, B, C, D, top row) Representative projection images showing the fluorescence summed across the frames of an epifluorescent imaging session, from the dorsal striatum in GCaMP vs. SomaGCaMP mice. Scale bar: 100 μm. (A, B, C, D, bottom row) The images in A, B, C, D presented in grayscale, with saturated pixels in red (note: none are red). Histograms of pixel values in upper right corners; blue line, upper limit of LUT. Supplemental Table 8, percentages of saturated pixels in GCaMP images. (E-H) Top, representative calcium traces from the experiments of A-D. Blue, calcium traces; red, calcium events identified based on thresholding. Bottom, calcium events from the top traces, aligned, with individual events in gray and averages in black. (I) Bar chart of GCaMP-spike rates (n = 930 neurons from 6 GCaMP6f mice, n = 594 neurons from 4 mice expressing SomaGCaMP6f2, n = 634 neurons from 4 GCaMP7f mice, n = 1098 neurons from 5 mice expressing SomaGCaMP7f). ***P <0.001, Kruskal-Wallis analysis of variance followed by post-hoc test via Dunn’s test; Supplemental Table 3, statistics for Figure 7. Shown throughout this figure is mean plus or minus standard error. (J) Correlated fluorescence vs. distance for cell pairs from mice expressing GCaMP6f (left; n = 860 cells from 6 mice) or SomaGCaMP6f2 (right; n = 149 cells from 4 mice), without (top) and with (bottom) CNMF. ***P < 0.001, two-dimensional Kolmogorov-Smirnov test. (K) As in J but for GCaMP7f (left; n = 634 cells from 4 mice) and SomaGCaMP7f (right; n = 1098 cells from 5 mice). (L) Bar plot showing Pearson correlation coefficients (n = 67795 cell-pairs from 6 GCaMP6f mice, n = 44890 cell-pairs from 4 SomaGCaMP6f2 mice, n = 12582 cell-pairs from 4 GCaMP7f mice, n = 10420 cell-pairs from 5 SomaGCaMP7f mice), without (top) and with (bottom) CNMF. *P < 0.05, ***P < 0.001, Kruskal-Wallis analysis of variance followed by post-hoc test via Dunn’s test.
Figure 8.
Figure 8.. SomaGCaMP imaging improvements in medial prefrontal cortex of awake mice imaged with endoscopic microscopes.
(A, B) Representative standard deviation images showing fluorescence fluctuation across the frames of an epifluorescent imaging session, from the medial prefrontal in GCaMP6f- (A) or SomaGCaMP6f2- (B) expressing mice. (C, D) The images in A, B presented in grayscale, with saturated pixels in red (one pixel in each image). Histogram of pixel values, in upper right corner. Blue line, upper value of histogram LUT. Supplemental Table 8, percentages of saturated pixels. (E, F) Representative calcium traces from neurons in the experiments of A-D. (G) Bar chart of SNR (n = 222 neurons from 4 mice expressing SomaGCaMP6f2, n = 107 neurons from 2 GCaMP6f mice). ***P <0.001, Wilcoxon rank sum test; Supplemental Table 3, statistics for Figure 8. Plotted is mean plus or minus standard error throughout. (H) As in G, but for GCaMP spike rates. (I) As in G, but for fluorescence rise times. (J) As in G but for fluorescence decay times.

References

    1. Ahrens MB et al. , 2013. Whole-brain functional imaging at cellular resolution using light-sheet microscopy. Nature methods, 10(5), pp.413–20. Available at: 10.1038/nmeth.2434 [Accessed December 19, 2015]. - DOI - PubMed
    1. Alivisatos AP et al. , 2013. Nanotools for Neuroscience and Brain Activity Mapping. ACS Nano, 7(3), pp.1850–1866. Available at: http://pubs.acs.org/doi/10.1021/nn4012847 [Accessed April 16, 2018]. - DOI - PMC - PubMed
    1. Alonso J-M & Martinez LM, 1998. Functional connectivity between simple cells and complex cells in cat striate cortex. Nature Neuroscience, 1(5), pp.395–403. Available at: http://www.nature.com/articles/nn0998_395 [Accessed March 23, 2018]. - PubMed
    1. Andilla FD & Hamprecht FA, 2014. Sparse Space-Time Deconvolution for Calcium Image Analysis. , pp.64–72. Available at: https://papers.nips.cc/paper/5342-sparse-space-time-deconvolution-for-ca... [Accessed April 12, 2018].
    1. Baker CA et al. , 2016. Cellular resolution circuit mapping with temporal-focused excitation of soma-targeted channelrhodopsin. eLife, 5 Available at: http://elifesciences.org/lookup/doi/10.7554/eLife.14193 [Accessed June 12, 2017]. - DOI - PMC - PubMed

Publication types