. 2020 Jun 27;17(1):199.
doi: 10.1186/s12974-020-01873-7.

27-Hydroxycholesterol contributes to cognitive deficits in APP/PS1 transgenic mice through microbiota dysbiosis and intestinal barrier dysfunction

Affiliations

27-Hydroxycholesterol contributes to cognitive deficits in APP/PS1 transgenic mice through microbiota dysbiosis and intestinal barrier dysfunction

Ying Wang et al. J Neuroinflammation. .

Abstract

Background: Research on the brain-gut-microbiota axis has led to accumulating interest in gut microbiota dysbiosis and intestinal barrier dysfunction in Alzheimer's disease (AD). Our previous studies have demonstrated neurotoxic effects of 27-hydroxycholesterol (27-OHC) in in vitro and in vivo models. Here, alterations in the gut microbiota and intestinal barrier functions were investigated as the possible causes of cognitive deficits induced by 27-OHC treatment.

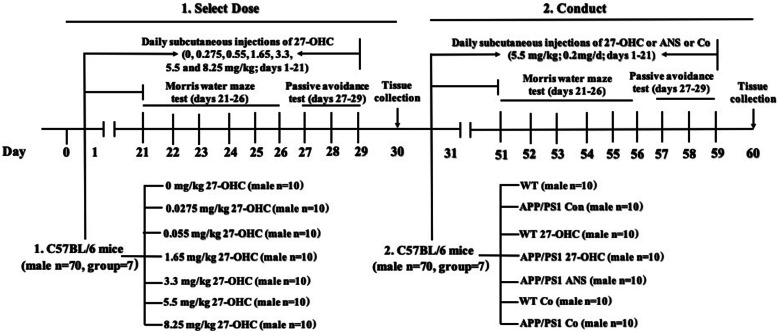
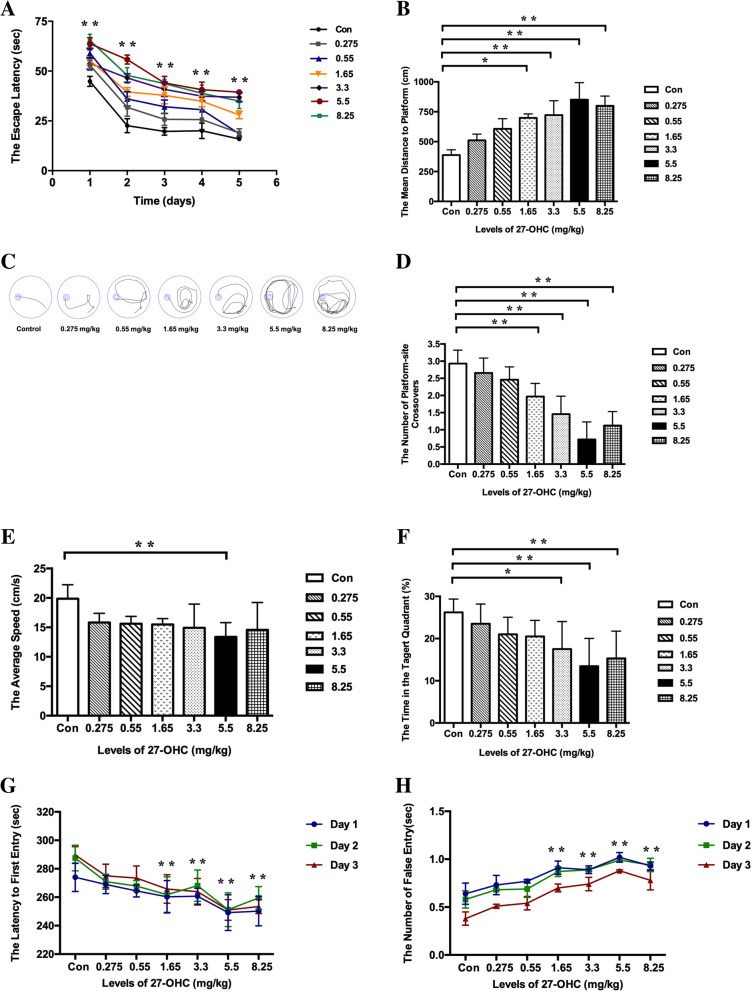
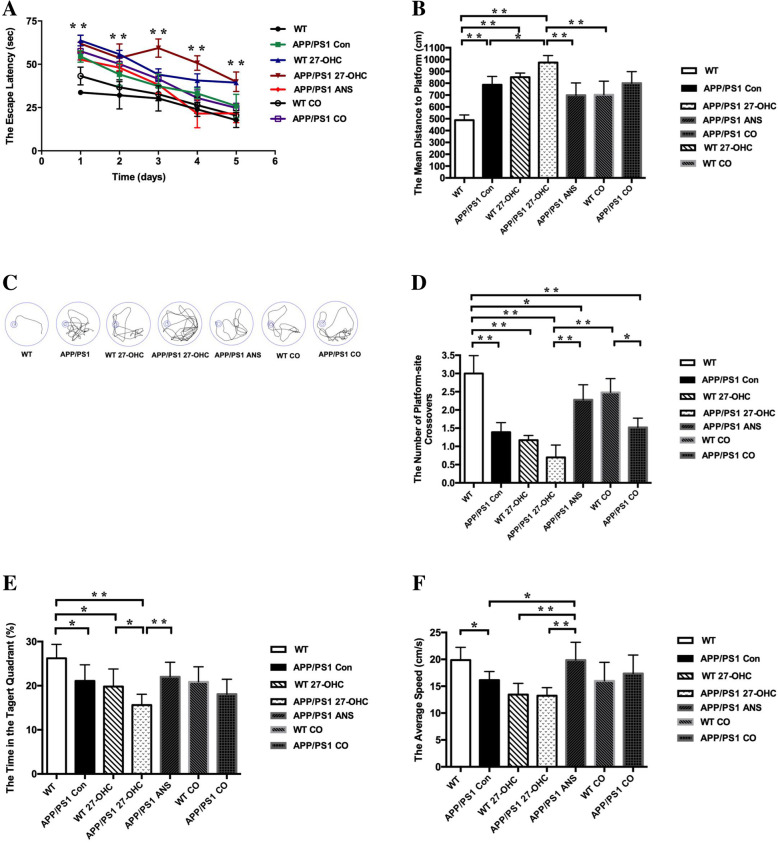
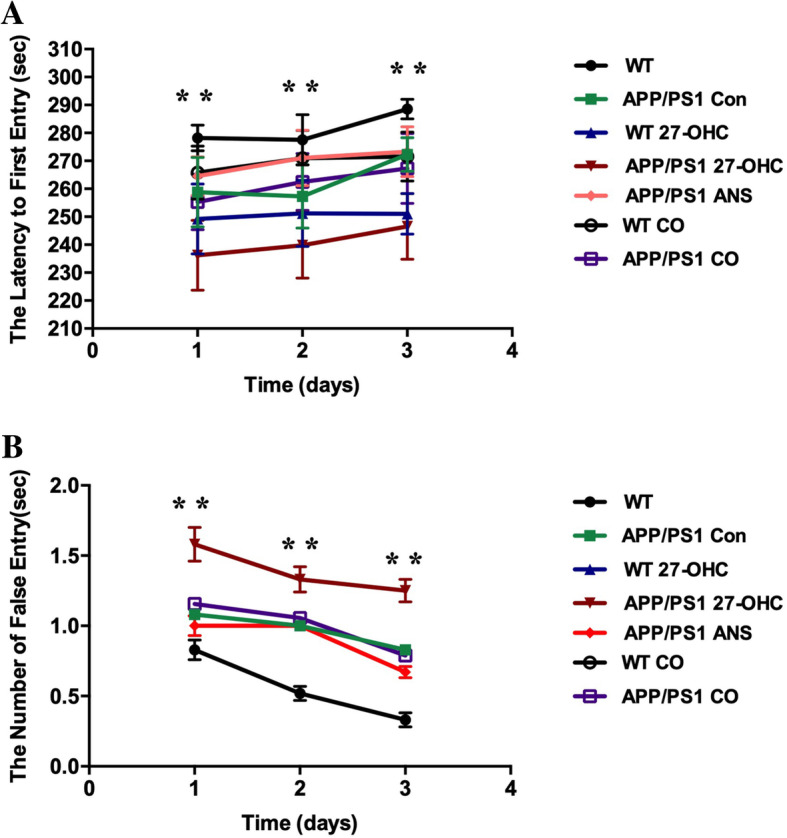
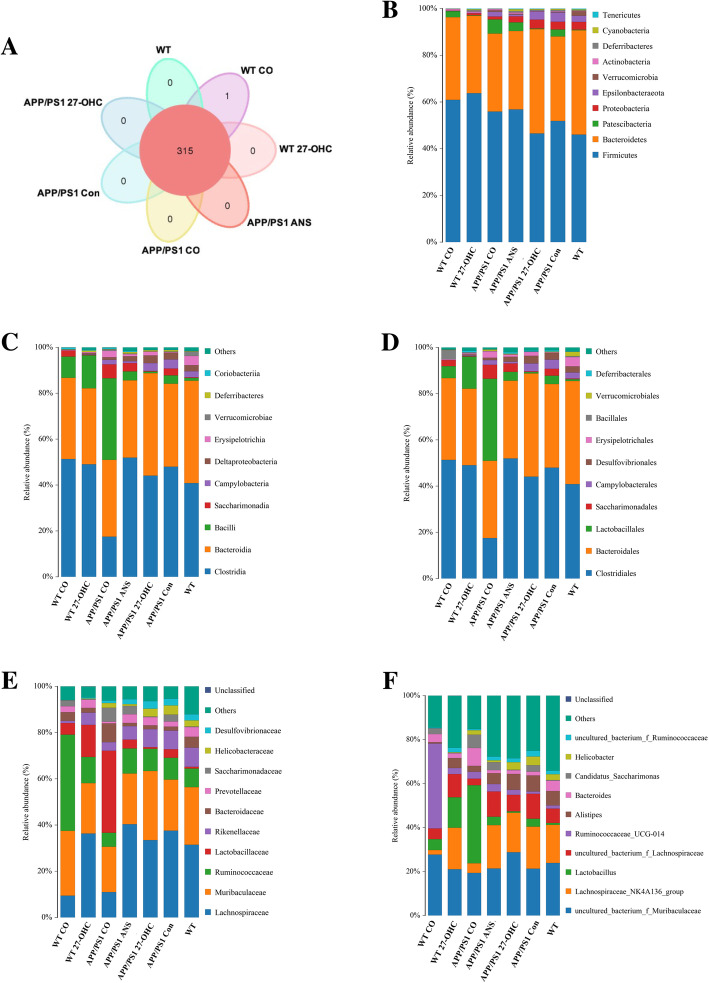
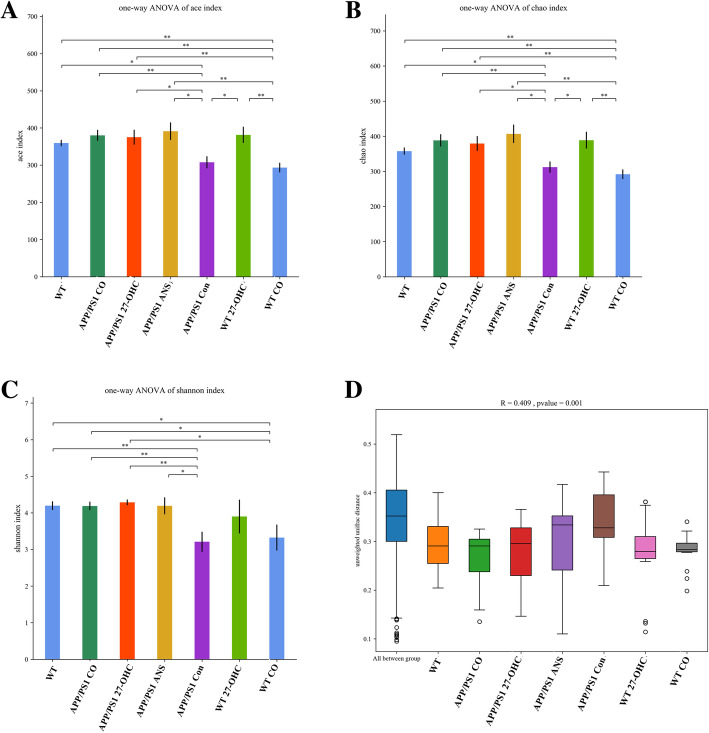
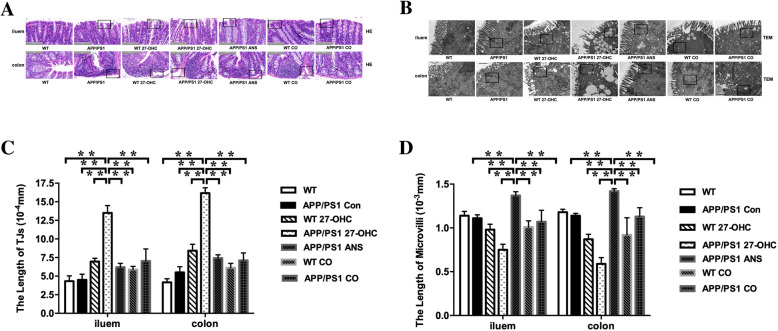
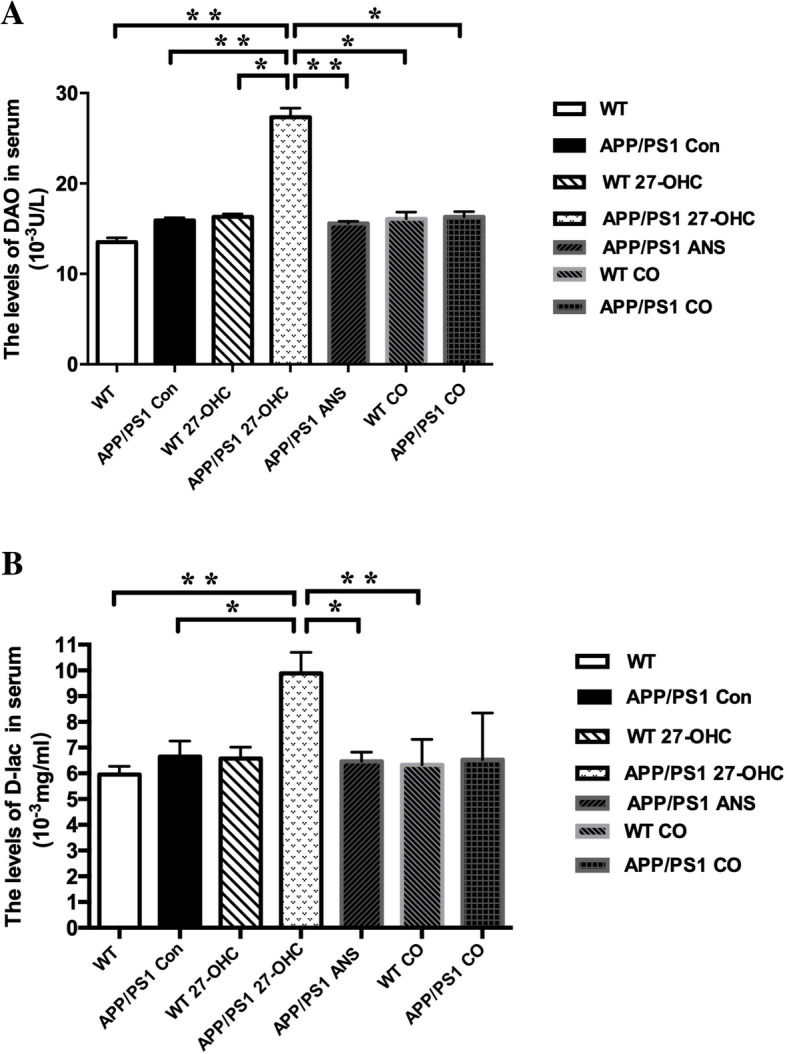
Methods: Male APP/PS1 transgenic and C57BL/6J mice were treated for 3 weeks with 27-OHC (5.5 mg/kg/day, subcutaneous injection) and either a 27-OHC synthetase inhibitor (anastrozole, ANS) or saline. The Morris water maze and passive avoidance test were used to assess cognitive impairment. Injuries of the intestine were evaluated by histopathological examination. Intestinal barrier function was assessed by plasma diamine oxidase (DAO) activity and D-lactate. Systemic and intestinal inflammation were evaluated by IL-1β, TNF-α, IL-10, and IL-17 concentrations as determined by ELISA. The fecal microbiome and short-chain fatty acids (SCFAs) were analyzed using 16S rDNA sequencing and ultra-performance liquid chromatography-mass spectrometry (UPLC-MS). Tight junction proteins were evaluated in the ileum and colon by qRT-PCR and Western blots. Tight junction ultrastructure was examined by transmission electron microscopy.

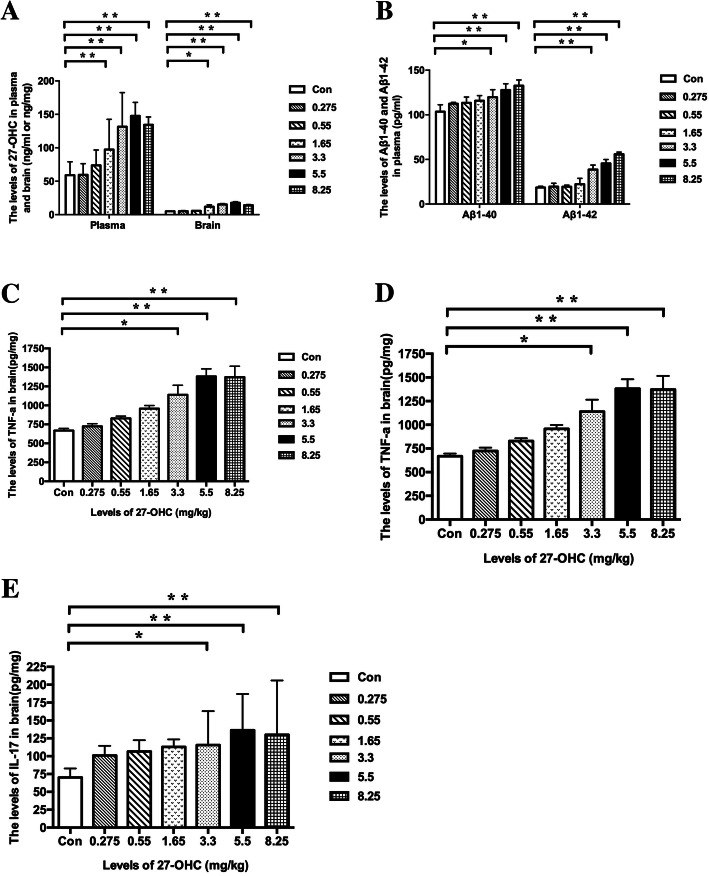
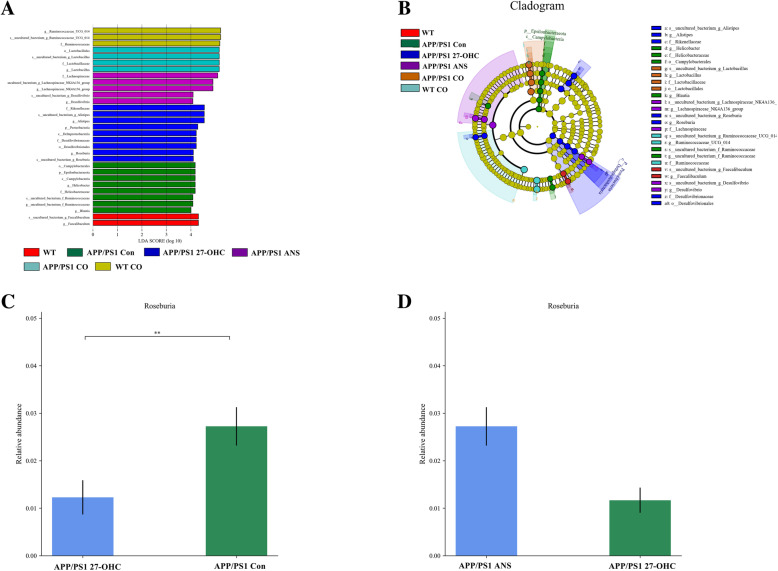
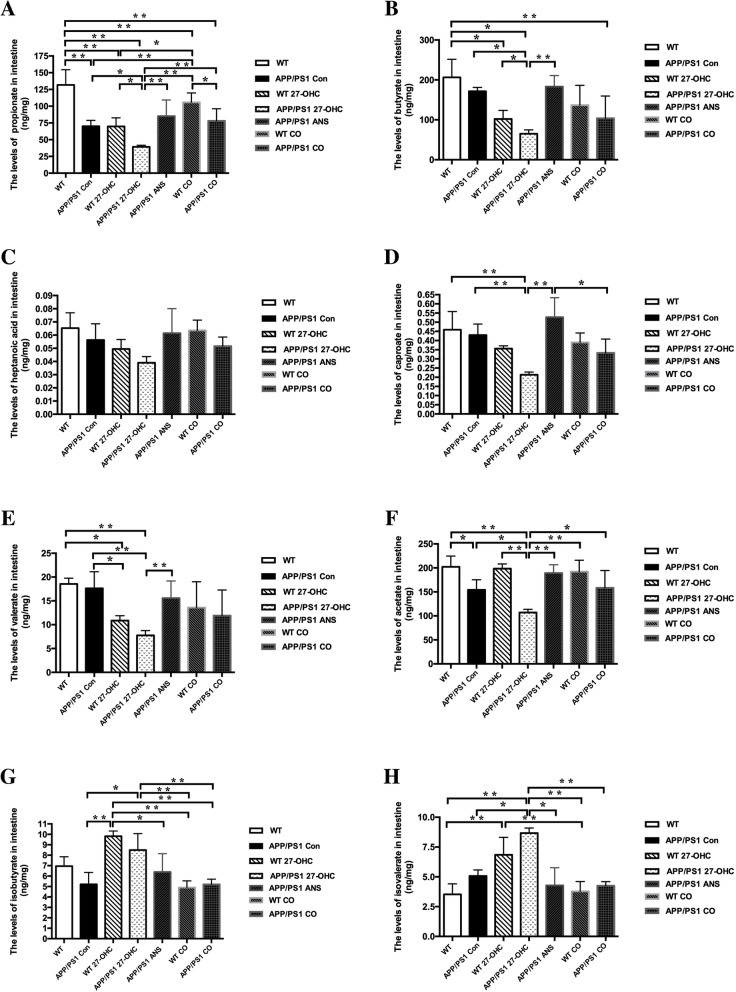
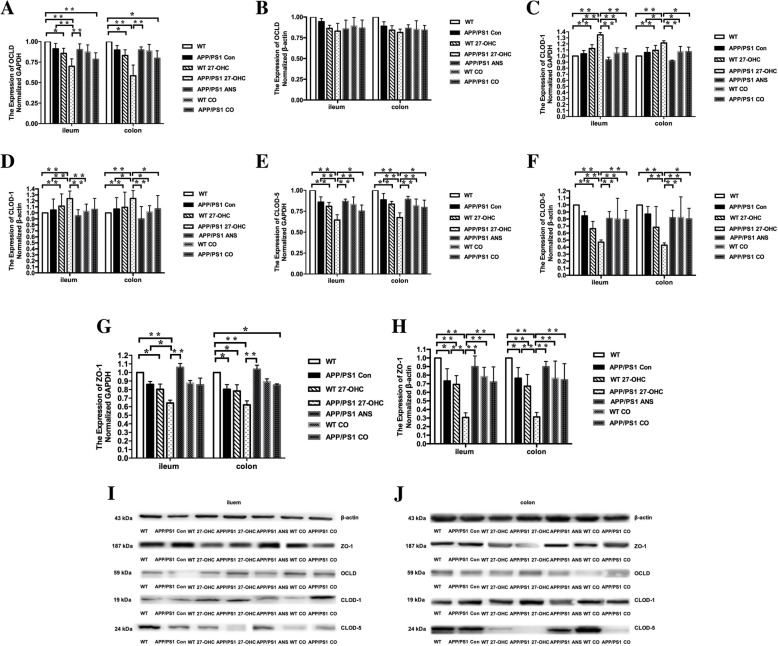
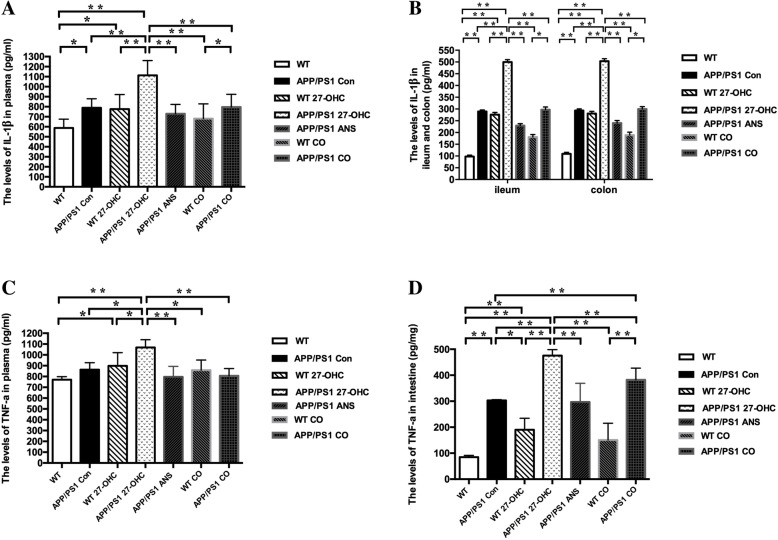
Results: Treatment with 27-OHC resulted in severe pathologies in the ileum and colon. There was impaired intestinal barrier integrity as indicated by dilated tight junctions and downregulation of tight junction proteins, including occludin, claudin 1, claudin 5, and ZO-1, and signs of inflammation (increased IL-1β, TNF-α, and IL-17). Fecal 16S rDNA sequencing and taxonomic analysis further revealed a decreased abundance of Roseburia and reduced fecal levels of several SCFAs in 27-OHC-treated mice. Meanwhile, co-treatment with ANS reduced intestinal inflammation and partially preserved intestinal barrier integrity in the presence of 27-OHC.

Conclusions: The current study demonstrates for the first time that 27-OHC treatment aggravates AD-associated pathophysiological alterations, specifically gut microbiota dysbiosis and intestinal barrier dysfunction, which suggests that the gut microbiome and intestinal barrier function warrant further investigation as potential targets to mitigate the neurotoxic impact of 27-OHC on cognitive function and the development of AD.

Keywords: 27-Hydroxycholesterol; Alzheimer’s disease; Cognitive deficits; Gut microbiota; Inflammation; Intestinal barrier dysfunction.


Conflict of interest statement

The authors declare that they have no competing interests.

Figures

Fig. 1
Fig. 1
A schematic diagram of drug treatment and protocol design, n = 10/group
Fig. 2
Fig. 2
Comparison of body weight (a, mean ± SE) of C57BL/6J mice (n = 10/group) before and after subcutaneous administration of 27-OHC by different doses. Comparison of organ coefficient of spleen, kidney and liver (b) as well as brain and intestine (c) for different doses of 27-OHC treatment. One-way analysis of variance (ANOVA) was performed and post hoc comparisons were carried out using the LSD test. Asterisks indicate significant differences. *P < 0.05; **P < 0.01
Fig. 3
Fig. 3
The plasma levels and brain levels of 27-OHC (a), plasma Aβ1-40 and Aβ1-42 (b), brain Aβ1-40 and Aβ1-42 (c), brain TNF-α (d), and IL-17 (e) in C57BL/6J mice for different doses of 27-OHC treatment. One-way analysis of variance (ANOVA) was performed and post hoc comparisons were carried out using the LSD test. Asterisks indicate significant differences. Data are presented as mean ± SEM. n = 10/group. *P < 0.05; **P < 0.01
Fig. 4
Fig. 4
The escape latency (a), escape distance (b), and representative images of path (c) in orientation navigation test and the crossing-target number (d), swimming speed (e), and the target-quadrant abidance (f) in spatial probe test determined with the Morris water maze test as well as the latency to enter the dark area (g) and the frequency of entries to the dark area (h) determined with the passive avoidance test in C57BL/6J mice for different doses of 27-OHC treatment. One-way analysis of variance (ANOVA) was performed and post hoc comparisons were carried out using the LSD test. Asterisks indicate significant differences. Data are presented as mean ± SEM. n = 10/group. *P < 0.05; **P < 0.01
Fig. 5
Fig. 5
Comparison of body weight (a), organ coefficients of intestine and liver (b), as well as brain, kidney, and spleen (c) in different groups. Groups: WT: wild-type control group of C57BL/6J mice; APP/PS1 Con: transgenic control group of APP/PS1 mice; WT 27-OHC: C57BL/6J mice treated with 5.5 mg/kg 27-hydroxycholesterol; APP/PS1 27-OHC: APP/PS1 mice treated with 5.5 mg/kg 27-hydroxycholesterol; APP/PS1 ANS: APP/PS1 mice treated with 0.2 mg/day anastrozole; WT CO: C57BL/6J mice treated with 5.5 mg/kg 27-hydroxycholesterol plus 0.2 mg/day anastrozole; APP/PS1 CO: APP/PS1 mice treated with 5.5 mg/kg 27-hydroxycholesterol plus 0.2 mg/day anastrozole. Data are presented as mean ± SEM. One-way analysis of variance (ANOVA) was performed and post hoc comparisons were carried out using the LSD test. Asterisks indicate significant differences. n = 10/group. *P < 0.05; **P < 0.01
Fig. 6
Fig. 6
The plasma levels (a), intestine levels (b), and brain levels (c) of 27-OHC in different groups. Groups: WT: wild-type control group of C57BL/6J mice; APP/PS1 Con: transgenic control group of APP/PS1 mice; WT 27-OHC: C57BL/6J mice treated with 5.5 mg/kg 27-hydroxycholesterol; APP/PS1 27-OHC: APP/PS1 mice treated with 5.5 mg/kg 27-hydroxycholesterol; APP/PS1 ANS: APP/PS1 mice treated with 0.2 mg/day anastrozole; WT CO: C57BL/6J mice treated with 5.5 mg/kg 27-hydroxycholesterol plus 0.2 mg/day anastrozole; APP/PS1 CO: APP/PS1 mice treated with 5.5 mg/kg 27-hydroxycholesterol plus 0.2 mg/day anastrozole. One-way analysis of variance (ANOVA) was performed and post hoc comparisons were carried out using the LSD test. Asterisks indicate significant differences. Data are presented as mean ± SEM. n = 10/group. *P < 0.05; **P < 0.01
Fig. 7
Fig. 7
The levels of total cholesterol in plasma (a) and liver (b), triglyceride in plasma (c) and liver (d), HDL-C in plasma (e) and liver (f), as well as LDL-C in plasma (g) and liver (h) in different groups. Groups: WT: wild-type control group of C57BL/6J mice; APP/PS1 Con: transgenic control group of APP/PS1 mice; WT 27-OHC: C57BL/6J mice treated with 5.5 mg/kg 27-hydroxycholesterol; APP/PS1 27-OHC: APP/PS1 mice treated with 5.5 mg/kg 27-hydroxycholesterol; APP/PS1 ANS: APP/PS1 mice treated with 0.2 mg/day anastrozole; WT CO: C57BL/6J mice treated with 5.5 mg/kg 27-hydroxycholesterol plus 0.2 mg/day anastrozole; APP/PS1 CO: APP/PS1 mice treated with 5.5 mg/kg 27-hydroxycholesterol plus 0.2 mg/day anastrozole. One-way analysis of variance (ANOVA) was performed and post hoc comparisons were carried out using the LSD test. Asterisks indicate significant differences. Data are presented as mean ± SEM. n = 10/group. *P < 0.05; **P < 0.01. HDL-C high-density lipoprotein cholesterol, LDL-C low-density lipoprotein cholesterol
Fig. 8
Fig. 8
The plasma and brain levels of Aβ1-40 (a, b) and Aβ1-42 (c, d) and silver staining of Aβ plaques (e) of each group. Groups: WT: wild-type control group of C57BL/6J mice; APP/PS1 Con: transgenic control group of APP/PS1 mice; WT 27-OHC: C57BL/6J mice treated with 5.5 mg/kg 27-hydroxycholesterol; APP/PS1 27-OHC: APP/PS1 mice treated with 5.5 mg/kg 27-hydroxycholesterol; APP/PS1 ANS: APP/PS1 mice treated with 0.2 mg/day anastrozole; WT CO: C57BL/6J mice treated with 5.5 mg/kg 27-hydroxycholesterol plus 0.2 mg/day anastrozole; APP/PS1 CO: APP/PS1 mice treated with 5.5 mg/kg 27-hydroxycholesterol plus 0.2 mg/day anastrozole. One-way analysis of variance (ANOVA) was performed and post hoc comparisons were carried out using the LSD test. Asterisks indicate significant differences. Data are presented as mean ± SEM. n = 10/group. *P < 0.05; **P < 0.01
Fig. 9
Fig. 9
The escape latency (a), escape distance (b), and representative images of path (c) in orientation navigation test and the crossing-target number (d), the target-quadrant abidance (e), and swimming speed (f) and in spatial probe test determined with the Morris water maze in different groups. Groups: WT: wild-type control group of C57BL/6J mice; APP/PS1 Con: transgenic control group of APP/PS1 mice; WT 27-OHC: C57BL/6J mice treated with 5.5 mg/kg 27-hydroxycholesterol; APP/PS1 27-OHC: APP/PS1 mice treated with 5.5 mg/kg 27-hydroxycholesterol; APP/PS1 ANS: APP/PS1 mice treated with 0.2 mg/day anastrozole; WT CO: C57BL/6J mice treated with 5.5 mg/kg 27-hydroxycholesterol plus 0.2 mg/day anastrozole; APP/PS1 CO: APP/PS1 mice treated with 5.5 mg/kg 27-hydroxycholesterol plus 0.2 mg/day anastrozole. One-way analysis of variance (ANOVA) was performed and post hoc comparisons were carried out using the LSD test. Asterisks indicate significant differences. Data are presented as mean ± SEM. n = 10/group. *P < 0.05; **P < 0.01
Fig. 10
Fig. 10
The latency to enter the dark area (a) and the frequency of entries to the dark area (b) determined with the passive avoidance test in different groups. Groups: WT: wild-type control group of C57BL/6J mice; APP/PS1 Con: transgenic control group of APP/PS1 mice; WT 27-OHC: C57BL/6J mice treated with 5.5 mg/kg 27-hydroxycholesterol; APP/PS1 27-OHC: APP/PS1 mice treated with 5.5 mg/kg 27-hydroxycholesterol; APP/PS1 ANS: APP/PS1 mice treated with 0.2 mg/day anastrozole; WT CO: C57BL/6J mice treated with 5.5 mg/kg 27-hydroxycholesterol plus 0.2 mg/day anastrozole; APP/PS1 CO: APP/PS1 mice treated with 5.5 mg/kg 27-hydroxycholesterol plus 0.2 mg/day anastrozole. One-way analysis of variance (ANOVA) was performed and post hoc comparisons were carried out using the LSD test. Asterisks indicate significant differences. Data are presented as mean ± SEM. n = 10/group. *P < 0.05; **P < 0.01
Fig. 11
Fig. 11
a Venn diagram illustrated the overlap of the OTUs identified in fecal microbiota among the five groups. Relative abundance of phylum level (b), class level (c), order level (d), family level (e), and genera level (f) gut microbial taxa. Groups: WT: wild-type control group of C57BL/6J mice; APP/PS1 Con: transgenic control group of APP/PS1 mice; WT 27-OHC: C57BL/6J mice treated with 5.5 mg/kg 27-hydroxycholesterol; APP/PS1 27-OHC: APP/PS1 mice treated with 5.5 mg/kg 27-hydroxycholesterol; APP/PS1 ANS: APP/PS1 mice treated with 0.2 mg/day anastrozole; WT CO: C57BL/6J mice treated with 5.5 mg/kg 27-hydroxycholesterol plus 0.2 mg/day anastrozole; APP/PS1 CO: APP/PS1 mice treated with 5.5 mg/kg 27-hydroxycholesterol plus 0.2 mg/day anastrozole. n = 6/group
Fig. 12
Fig. 12
The α-diversity of the fecal microbiome among seven groups according to Ace (a), Chao 1 (b), and Shannon index (c). Data are presented as mean ± SD. One-way analysis of variance (ANOVA) was performed and post hoc comparisons were carried out using the LSD test. Asterisks indicate significant differences. *P < 0.05; **P < 0.01. The β-diversity of the fecal microbiome among five groups according to unweighted UniFrac distance (d). Each box plot represents the median, interquartile range, minimum, and maximum values. Groups: WT: wild type control group of C57BL/6J mice; APP/PS1 Con: transgenic control group of APP/PS1 mice; WT 27-OHC: C57BL/6J mice treated with 5.5 mg/kg 27-hydroxycholesterol; APP/PS1 27-OHC: APP/PS1 mice treated with 5.5 mg/kg 27-hydroxycholesterol; APP/PS1 ANS: APP/PS1 mice treated with 0.2 mg/day anastrozole; WT CO: C57BL/6J mice treated with 5.5 mg/kg 27-hydroxycholesterol plus 0.2 mg/day anastrozole; APP/PS1 CO: APP/PS1 mice treated with 5.5 mg/kg 27-hydroxycholesterol plus 0.2 mg/day anastrozole. n = 6/group
Fig. 13
Fig. 13
Comparison of the representative taxonomic abundance among different groups. a Linear discriminant analysis (LDA) effect size (LEfSe) analysis revealed significant bacterial differences in fecal microbiota between different groups. The LDA scores (log10) > 4 and P < 0.05 are listed. b Cladogram using LEfSe method indicating the phylogenetic distribution of fecal microbiota associated with different groups. Metastats analysis indicated the significant differences in Roseburia between two groups of APP/PS1 group and APP/PS1 27-OHC group (c). Metastats analysis indicated the significant differences in Roseburia between two groups of APP/PS1 27-OHC group and APP/PS1 ANS group (b). p phylum, c class, o order, f family, g genus. Groups: WT: wild-type control group of C57BL/6J mice; APP/PS1 Con: transgenic control group of APP/PS1 mice; WT 27-OHC: C57BL/6J mice treated with 5.5 mg/kg 27-hydroxycholesterol; APP/PS1 27-OHC: APP/PS1 mice treated with 5.5 mg/kg 27-hydroxycholesterol; APP/PS1 ANS: APP/PS1 mice treated with 0.2 mg/day anastrozole; WT CO: C57BL/6J mice treated with 5.5 mg/kg 27-hydroxycholesterol plus 0.2 mg/day anastrozole; APP/PS1 CO: APP/PS1 mice treated with 5.5 mg/kg 27-hydroxycholesterol plus 0.2 mg/day anastrozole. n = 6/group
Fig. 14
Fig. 14
The fecal levels of propionate (a), butyrate (b), heptanoic acid (c), caproate (d), valerate (e), acetate (f), isobutyrate (g), and isovalerate (h) in different groups. Groups: WT: wild-type control group of C57BL/6J mice; APP/PS1 Con: transgenic control group of APP/PS1 mice; WT 27-OHC: C57BL/6J mice treated with 5.5 mg/kg 27-hydroxycholesterol; APP/PS1 27-OHC: APP/PS1 mice treated with 5.5 mg/kg 27-hydroxycholesterol; APP/PS1 ANS: APP/PS1 mice treated with 0.2 mg/day anastrozole; WT CO: C57BL/6J mice treated with 5.5 mg/kg 27-hydroxycholesterol plus 0.2 mg/day anastrozole; APP/PS1 CO: APP/PS1 mice treated with 5.5 mg/kg 27-hydroxycholesterol plus 0.2 mg/day anastrozole. One-way analysis of variance (ANOVA) was performed and post hoc comparisons were carried out using the LSD test. Asterisks indicate significant differences. Data are presented as mean ± SEM. *P < 0.05; **P < 0.01. n = 6/group
Fig. 15
Fig. 15
H&E staining was performed to assess the morphology of the ileum and colon collected from different groups (a). Transmission electron micrographs of ultrastructure in ileum and colon (b). n = 6/group. Quantitative analyses revealed intercellular ultrastructure indicated by length of tight junctions (TJs, c) and microvilli (d). TJs tight junctions. Groups: WT: wild-type control group of C57BL/6J mice; APP/PS1 Con: transgenic control group of APP/PS1 mice; WT 27-OHC: C57BL/6J mice treated with 5.5 mg/kg 27-hydroxycholesterol; APP/PS1 27-OHC: APP/PS1 mice treated with 5.5 mg/kg 27-hydroxycholesterol; APP/PS1 ANS: APP/PS1 mice treated with 0.2 mg/day anastrozole; WT CO: C57BL/6J mice treated with 5.5 mg/kg 27-hydroxycholesterol plus 0.2 mg/day anastrozole; APP/PS1 CO: APP/PS1 mice treated with 5.5 mg/kg 27-hydroxycholesterol plus 0.2 mg/day anastrozole. One-way analysis of variance (ANOVA) was performed and post hoc comparisons were carried out using the LSD test. Asterisks indicate significant differences. Data are presented as mean ± SEM. *P < 0.05; **P < 0.01. n = 6/group
Fig. 16
Fig. 16
Comparisons of serum levels DAO (a) and d-lactate (b) for different groups. Groups: WT: wild-type control group of C57BL/6J mice; APP/PS1 Con: transgenic control group of APP/PS1 mice; WT 27-OHC: C57BL/6J mice treated with 5.5 mg/kg 27-hydroxycholesterol; APP/PS1 27-OHC: APP/PS1 mice treated with 5.5 mg/kg 27-hydroxycholesterol; APP/PS1 ANS: APP/PS1 mice treated with 0.2 mg/day anastrozole; WT CO: C57BL/6J mice treated with 5.5 mg/kg 27-hydroxycholesterol plus 0.2 mg/day anastrozole; APP/PS1 CO: APP/PS1 mice treated with 5.5 mg/kg 27-hydroxycholesterol plus 0.2 mg/day anastrozole. One-way analysis of variance (ANOVA) was performed and post hoc comparisons were carried out using the LSD test. Asterisks indicate significant differences. Data are presented as mean ± SEM. *P < 0.05; **P < 0.01. n = 6/group
Fig. 17
Fig. 17
Relative mRNA levels (a) and Western blot analyses (b) of OLCD, relative mRNA levels (c) and Western blot analyses (d) of CLOD-1, relative mRNA levels (e) and Western blot analyses (f) of CLOD-5, and relative mRNA levels (g) and Western blot analyses (h) of ZO-1 expression for different groups. Protein bands for Western blot analyses of tight junction protein expression for different groups in iluem (I) and colon (j). Groups: WT: wild-type control group of C57BL/6J mice; APP/PS1 Con: transgenic control group of APP/PS1 mice; WT 27-OHC: C57BL/6J mice treated with 5.5 mg/kg 27-hydroxycholesterol; APP/PS1 27-OHC: APP/PS1 mice treated with 5.5 mg/kg 27-hydroxycholesterol; APP/PS1 ANS: APP/PS1 mice treated with 0.2 mg/day anastrozole; WT CO: C57BL/6J mice treated with 5.5 mg/kg 27-hydroxycholesterol plus 0.2 mg/day anastrozole; APP/PS1 CO: APP/PS1 mice treated with 5.5 mg/kg 27-hydroxycholesterol plus 0.2 mg/day anastrozole. One-way analysis of variance (ANOVA) was performed and post hoc comparisons were carried out using the LSD test. Asterisks indicate significant differences. Data are presented as mean ± SEM. *P < 0.05; **P < 0.01. n = 6/group
Fig. 18
Fig. 18
The levels of IL-1β in plasma (a) and ileum and colon (b), TNF-α in plasma (c) and ileum and colon (d) for different groups. Groups: WT: wild-type control group of C57BL/6J mice; APP/PS1 Con: transgenic control group of APP/PS1 mice; WT 27-OHC: C57BL/6J mice treated with 5.5 mg/kg 27-hydroxycholesterol; APP/PS1 27-OHC: APP/PS1 mice treated with 5.5 mg/kg 27-hydroxycholesterol; APP/PS1 ANS: APP/PS1 mice treated with 0.2 mg/day anastrozole; WT CO: C57BL/6J mice treated with 5.5 mg/kg 27-hydroxycholesterol plus 0.2 mg/day anastrozole; APP/PS1 CO: APP/PS1 mice treated with 5.5 mg/kg 27-hydroxycholesterol plus 0.2 mg/day anastrozole. One-way analysis of variance (ANOVA) was performed and post hoc comparisons were carried out using the LSD test. Asterisks indicate significant differences. Data are presented as mean ± SEM. *P < 0.05; **P < 0.01. n = 6/group
Fig. 19
Fig. 19
The levels of IL-10 in plasma (a) and ileum and colon (b) and IL-17 in plasma (c) and ileum and colon (d) for different groups. Groups: WT: wild-type control group of C57BL/6J mice; APP/PS1 Con: transgenic control group of APP/PS1 mice; WT 27-OHC: C57BL/6J mice treated with 5.5 mg/kg 27-hydroxycholesterol; APP/PS1 27-OHC: APP/PS1 mice treated with 5.5 mg/kg 27-hydroxycholesterol; APP/PS1 ANS: APP/PS1 mice treated with 0.2 mg/d anastrozole; WT CO: C57BL/6J mice treated with 5.5 mg/kg 27-hydroxycholesterol plus 0.2 mg/day anastrozole; APP/PS1 CO: APP/PS1 mice treated with 5.5 mg/kg 27-hydroxycholesterol plus 0.2 mg/day anastrozole. One-way analysis of variance (ANOVA) was performed and post hoc comparisons were carried out using the LSD test. Asterisks indicate significant differences. Data are presented as mean ± SEM. *P < 0.05, **P < 0.01. n = 6/group

Similar articles

Cited by

References

    1. Pena-Bautista C, Baquero M, Ferrer I, Hervas D, Vento M, Garcia-Blanco A, Chafer-Pericas C. Neuropsychological assessment and cortisol levels in biofluids from early Alzheimer's disease patients. Exp Gerontol. 2019;123:10–16. - PubMed
    1. Tiwari S, Atluri V, Kaushik A, Yndart A, Nair M. Alzheimer’s disease: pathogenesis, diagnostics, and therapeutics. Int J Nanomedicine. 2019;14:5541–5554. - PMC - PubMed
    1. Hsiao YH, Chang CH, Gean PW. Impact of social relationships on Alzheimer's memory impairment: mechanistic studies. J Biomed Sci. 2018;25:3. - PMC - PubMed
    1. Liu P, Wu L, Peng G, Han Y, Tang R, Ge J, Zhang L, Jia L, Yue S, Zhou K, et al. Altered microbiomes distinguish Alzheimer's disease from amnestic mild cognitive impairment and health in a Chinese cohort. Brain Behav Immun. 2019;80:633–643. - PubMed
    1. Bauerl C, Collado MC, Diaz CA, Vina J, Perez MG. Shifts in gut microbiota composition in an APP/PSS1 transgenic mouse model of Alzheimer's disease during lifespan. Lett Appl Microbiol. 2018;66:464–471. - PubMed

MeSH terms

LinkOut - more resources