. 2021 Mar;35(3):835-849.
doi: 10.1038/s41375-020-0917-7. Epub 2020 Jun 29.

Therapy-related myelodysplastic syndromes deserve specific diagnostic sub-classification and risk-stratification-an approach to classification of patients with t-MDS

Affiliations

Therapy-related myelodysplastic syndromes deserve specific diagnostic sub-classification and risk-stratification-an approach to classification of patients with t-MDS

A Kuendgen et al. Leukemia. 2021 Mar.

Abstract

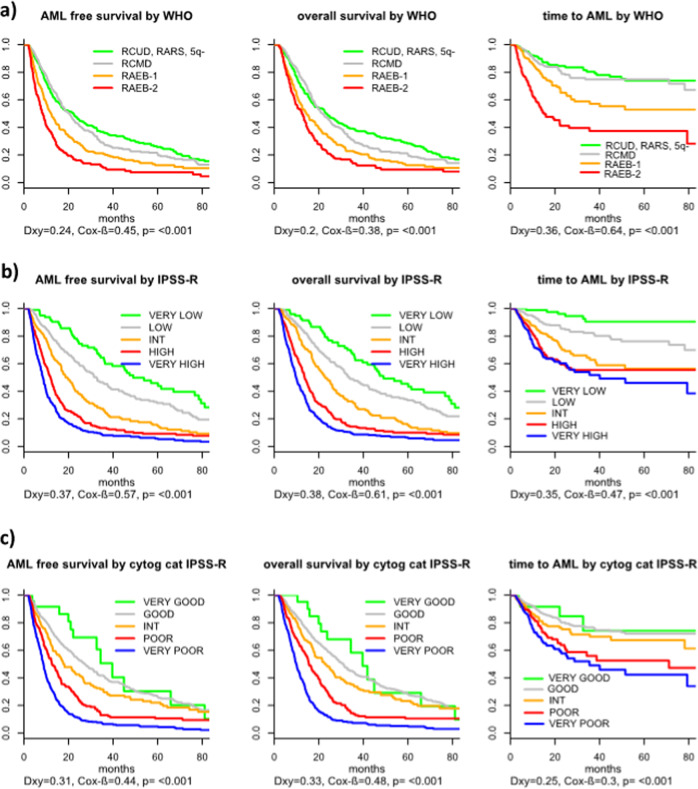
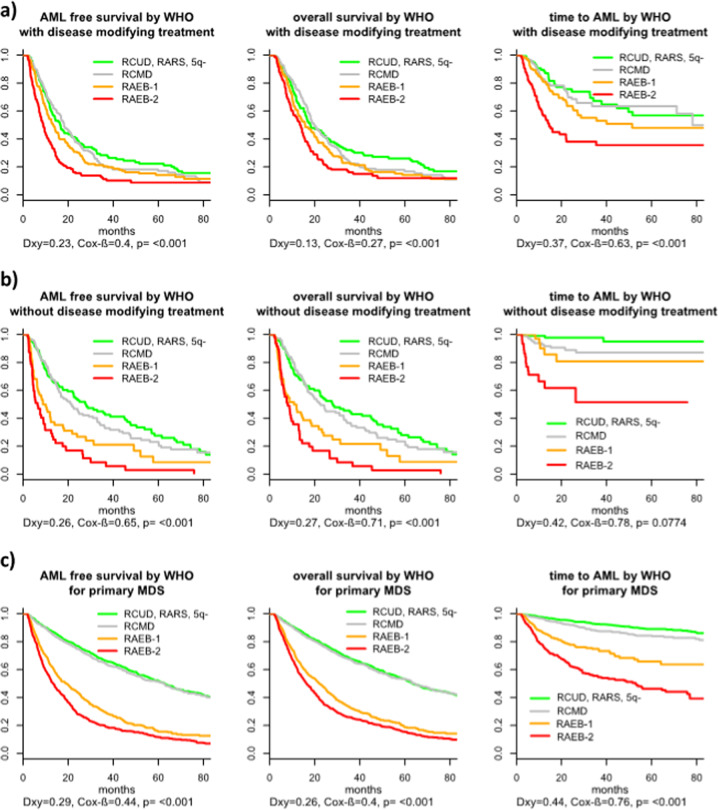
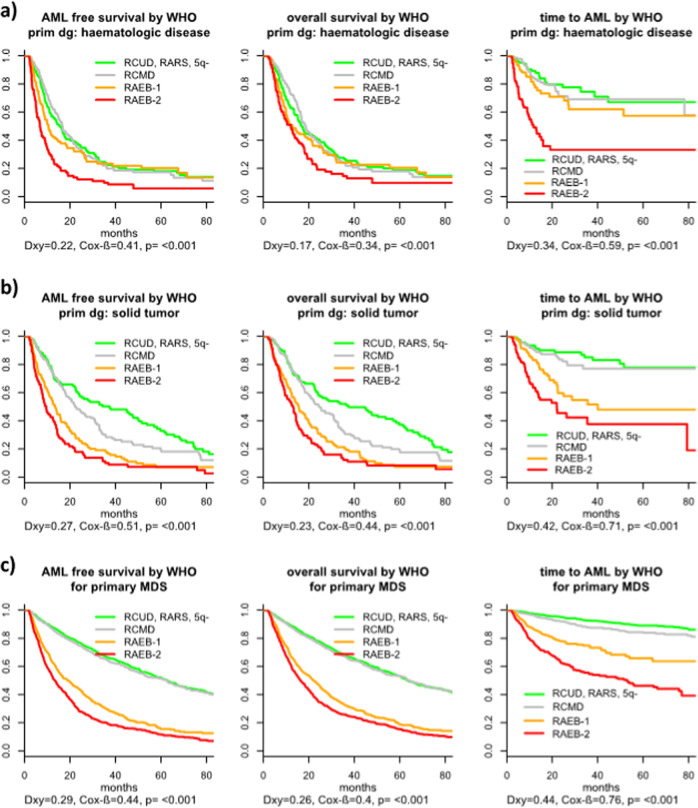
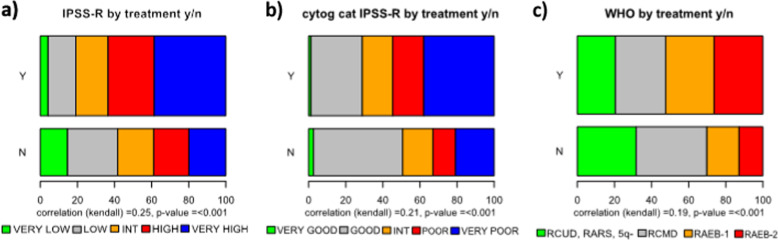
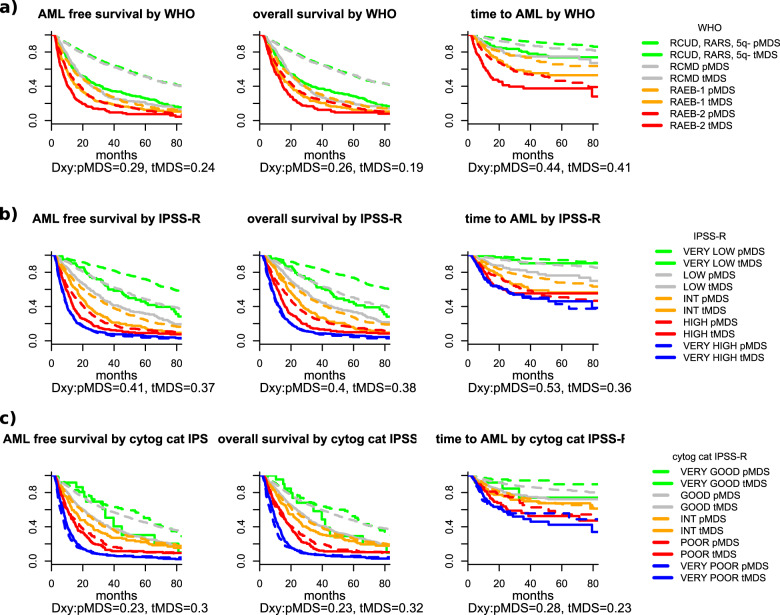
In the current World Health Organization (WHO)-classification, therapy-related myelodysplastic syndromes (t-MDS) are categorized together with therapy-related acute myeloid leukemia (AML) and t-myelodysplastic/myeloproliferative neoplasms into one subgroup independent of morphologic or prognostic features. Analyzing data of 2087 t-MDS patients from different international MDS groups to evaluate classification and prognostication tools we found that applying the WHO classification for p-MDS successfully predicts time to transformation and survival (both p < 0.001). The results regarding carefully reviewed cytogenetic data, classifications, and prognostic scores confirmed that t-MDS are similarly heterogeneous as p-MDS and therefore deserve the same careful differentiation regarding risk. As reference, these results were compared with 4593 primary MDS (p-MDS) patients represented in the International Working Group for Prognosis in MDS database (IWG-PM). Although a less favorable clinical outcome occurred in each t-MDS subset compared with p-MDS subgroups, FAB and WHO-classification, IPSS-R, and WPSS-R separated t-MDS patients into differing risk groups effectively, indicating that all established risk factors for p-MDS maintained relevance in t-MDS, with cytogenetic features having enhanced predictive power. These data strongly argue to classify t-MDS as a separate entity distinct from other WHO-classified t-myeloid neoplasms, which would enhance treatment decisions and facilitate the inclusion of t-MDS patients into clinical studies.


Conflict of interest statement

The authors declare that they have no conflict of interest.

Figures

Fig. 1
Fig. 1. Outcome of patients with t-MDS according to different tools for classification and prognosis.
a outcome according to WHO 2016, b outcome according to IPSS-R, c Outcome according to cytogenetic IPSS-R risk categories.
Fig. 2
Fig. 2. Outcome of patients with t-MDS according WHO-classification depending on treatment in MDS phase and comparison to p-MDS.
a Outcome according to WHO-classification for treated patients. b Outcome according to WHO-classification for untreated patients. c Outcome according to WHO: p-MDS.
Fig. 3
Fig. 3. Outcome of patients with t-MDS according WHO-classification depending on the primary disease and comparison to p-MDS.
a Outcome according to WHO: primary disease hematologic. b Outcome according to WHO: primary disease solid tumor c Outcome according to WHO: p-MDS.
Fig. 4
Fig. 4. Distribution of risk groups according to different classification and prognostic tools for p- versus t-MDS.
a Distribution of IPSS-R subgroups in p- and t-MDS. b Distribution of WHO- subtypes (according to WPSS + RAEB-T) in p- and t-MDS. c Distribution of cytogenetic IPSS-R subgroups in p- and t-MDS. d Distribution of number of aberrations in p- and t-MDS.
Fig. 5
Fig. 5. Distribution of risk groups according to different classification and prognostic tools for treated versus untreated patients.
a Comparison of IPSS-R risk-groups between treated and untreated patients. b Comparison of IPSS-R cytogenetic risk-groups between treated and untreated patients. c Comparison of WHO subgroups between treated and untreated patients.
Fig. 6
Fig. 6. Comparison of outcome according to different tools for classification or prognostic evaluation t- versus p-MDS.
a Comparison p- and t-MDS according to WHO-classification. b Comparison t- and p-MDS according to IPSS-R risk-categories. c Comparison t- and p-MDS according to cytogenetic IPSS-R categories.

References

    1. Arber DA, Orazi A, Hasserjian R, Thiele J, Borowitz MJ, Le Beau MM, et al. The 2016 revision to the World Health Organization classification of myeloid neoplasms and acute leukemia. Blood. 2016;127:2391–405. doi: 10.1182/blood-2016-03-643544. - DOI - PubMed
    1. Swerdlow SH, Campo E, Harris NL, Jaffe ES, Pileri SA, Stein H, et al. (eds). WHO classification of tumours of haematopoietic and lymphoid tissues. 4th ed. Lyon, France: International Agency for Research on Cancer; 2017.
    1. Vardiman JW, Harris NL, Brunning RD. The World Health Organization (WHO) classification of the myeloid neoplasms. Blood. 2002;100:2292–302. doi: 10.1182/blood-2002-04-1199. - DOI - PubMed
    1. Vardiman JW, Thiele J, Arber DA, Brunning RD, Borowitz MJ, Porwit A, et al. The 2008 revision of the World Health Organization (WHO) classification of myeloid neoplasms and acute leukemia: rationale and important changes. Blood. 2009;114:937–51. doi: 10.1182/blood-2009-03-209262. - DOI - PubMed
    1. Greenberg P, Cox C, LeBeau MM, Fenaux P, Morel P, Sanz G, et al. International scoring system for evaluating prognosis in myelodysplastic syndromes. Blood. 1997;89:2079–88. doi: 10.1182/blood.V89.6.2079. - DOI - PubMed

Publication types

Substances