. 2020 Jun 21;44(3):146-156.
doi: 10.3906/biy-2005-35. eCollection 2020.

Phylogenetic analysis of SARS-CoV-2 genomes in Turkey

Affiliations

Phylogenetic analysis of SARS-CoV-2 genomes in Turkey

Ogün Adebalİ et al. Turk J Biol. .

Abstract

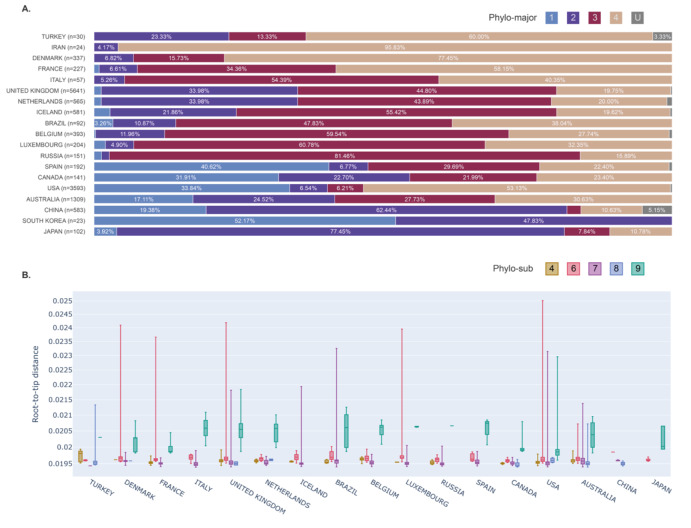
COVID-19 has effectively spread worldwide. As of May 2020, Turkey is among the top ten countries with the most cases. A comprehensive genomic characterization of the virus isolates in Turkey is yet to be carried out. Here, we built a phylogenetic tree with globally obtained 15,277 severe acute respiratory syndrome coronavirus 2 (SARS-CoV-2) genomes. We identified the subtypes based on the phylogenetic clustering in comparison with the previously annotated classifications. We performed a phylogenetic analysis of the first 30 SARS-CoV-2 genomes isolated and sequenced in Turkey. We suggest that the first introduction of the virus to the country is earlier than the first reported case of infection. Virus genomes isolated from Turkey are dispersed among most types in the phylogenetic tree. We find 2 of the seventeen subclusters enriched with the isolates of Turkey, which likely have spread expansively in the country. Finally, we traced virus genomes based on their phylogenetic placements. This analysis suggested multiple independent international introductions of the virus and revealed a hub for the inland transmission. We released a web application to track the global and interprovincial virus spread of the isolates from Turkey in comparison to thousands of genomes worldwide.

Keywords: COVID-19; SARS-CoV-2; evolution; genome sequence; phylogenetics.


Conflict of interest statement

CONFLICT OF INTEREST: none declared

Figures

Figure 1
Figure 1
Phylogenetic tree of the 15,277 genomes retrieved from GISAID and their groupings.The time-resolved tree of SARS-CoV-2 appears in the center. Six clustering methods were used to assign 15277 sequences to the clusters. The clusters are represented as circular layers around the tree. The innermost shell (L/S) represents S and L type according to 8782th and 28144th positions in the nucleotide. 614 G/D represents the 614th amino acid of the spike protein. Barcode shows the 10 major subtypes of 17 positions in (nucleotide) multiple sequence alignment. Six-major clustering is based on 6 major subtypes of nucleotide combinations in particular positions. The fifth and sixth layers show phylo-majors and subclusters, respectively. Samples obtained from Turkey are shown in the outermost shell and they are highlighted.
Figure 2
Figure 2
Phylogenetic tree of the transient type (EPI-ISL-428718) from S to L strain. The maximum likelihood tree was built with IQ-TREE. 10 S-type and 10 L-type sequences were randomly selected from the assigned samples. The tree was rooted at the genomes obtained from bat and pangolin.
Figure 3
Figure 3
Phylo-cluster distribution and sub-cluster divergence.(A) Percentages of 4 major and unknown clusters across different coun-tries. Unknown (U) samples are the ones that cannot be grouped with the generated clusters. (B) Root-to-tip distances of four phylo-subclusters (4,6,7,8 and 9) found in Turkey, across different countries.
Figure 4
Figure 4
The mutation layout of the 30 samples from Turkey along with the phylogenetic tree and clusters.Phylogenetic tree (left) of SARS-CoV-2 samples sequenced in Turkey. Assigned subtypes of 7 clustering methods are specified with different colors in the matrix. Dot-plot (right) of mutations detected in each genome aligned with the corresponding sample. Single nucleotide changes are colored and shaped based on the nucleotide change and synonymy. Gray color indicates that the mutation is either noninformative (i.e. due to sequencing errors) or corresponds to a gap or an ambiguous nucleotide. Supplementary bar (top) provides the respective open reading frame information for mutations, and their effects on coding the amino acid. EPI-ISL-417413 had obvious sequencing errors, the muta-tions of this sampled were manually curated and noninformative ones were treated as ambigious mutations.
Figure 5
Figure 5
Epidemiological phylogenetic and transmission analysis of the isolates collected in Turkey. Sequences sampled between 2019-03-19 and 2020-04-24 were analyzed with TreeTime and tracing between samples were visualized in Augur (version 6.4.3). (A) Closest (without internal nodes) leaves were used and assigned as transmissions were visualized on Leaflet world map using latitude and longi-tude information of locations. (B) Samples originated from Turkey were implied with orange points and connections while the network of samples originated from other countries demonstrated with blue lines and points. (C) Chord diagram was used as a graphical method to display interflow of directed associations between origins and destinations of transmission data.

References

    1. Balaban M Moshiri N Mai U Jia X Mirarab S TreeCluster: Clustering biological sequences using phylogenetic trees. PLoS One. 2019;14:e0221068–e0221068. - PMC - PubMed
    1. Bhattacharyya C Das C Ghosh A Singh AK Mukherjee S Global spread of SARS-CoV-2 subtype with spike protein mutation D614G is shaped by human genomic variations that regulate expression of TMPRSS2 and MX1 genes. BioRxiv. 2020;10
    1. Dos Ramos F Carrasco M Doyle T Brierley I Programmed -1 ribosomal frameshifting in the SARS coronavirus. Biochemical Society Transactions. 2004;32:1081. - PubMed
    1. Hadfield J Megill C Bell SM Huddleston J Potter B Nextstrain: real-time tracking of pathogen evolution. Bioinformatics. 2018;34:4121. - PMC - PubMed
    1. Huerta-Cepas J Serra F Bork P ETE 3: reconstruction, analysis, and visualization of phylogenomic data. Molecular Biology and Evolution. 2016;33:1635. - PMC - PubMed

LinkOut - more resources