

After Less Than 2 Months, the Simulations That Drove the World to Strict Lockdown Appear to be Wrong, the Same of the Policies They Generated
- PMID: 32596417
- PMCID: PMC7301657
- DOI: 10.1177/2333392820932324
After Less Than 2 Months, the Simulations That Drove the World to Strict Lockdown Appear to be Wrong, the Same of the Policies They Generated
Abstract
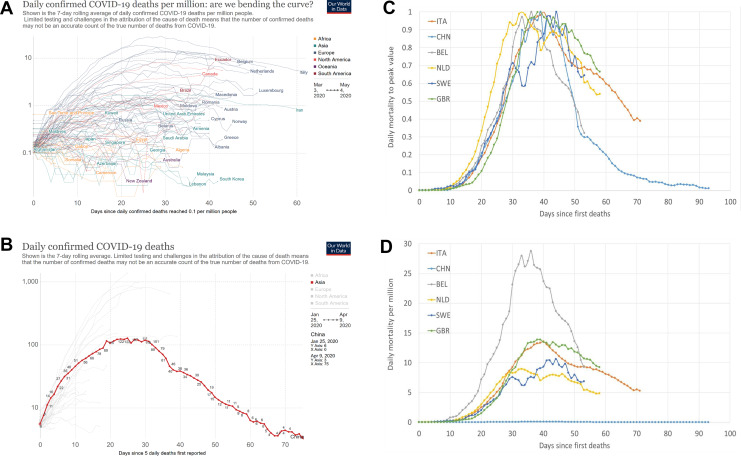
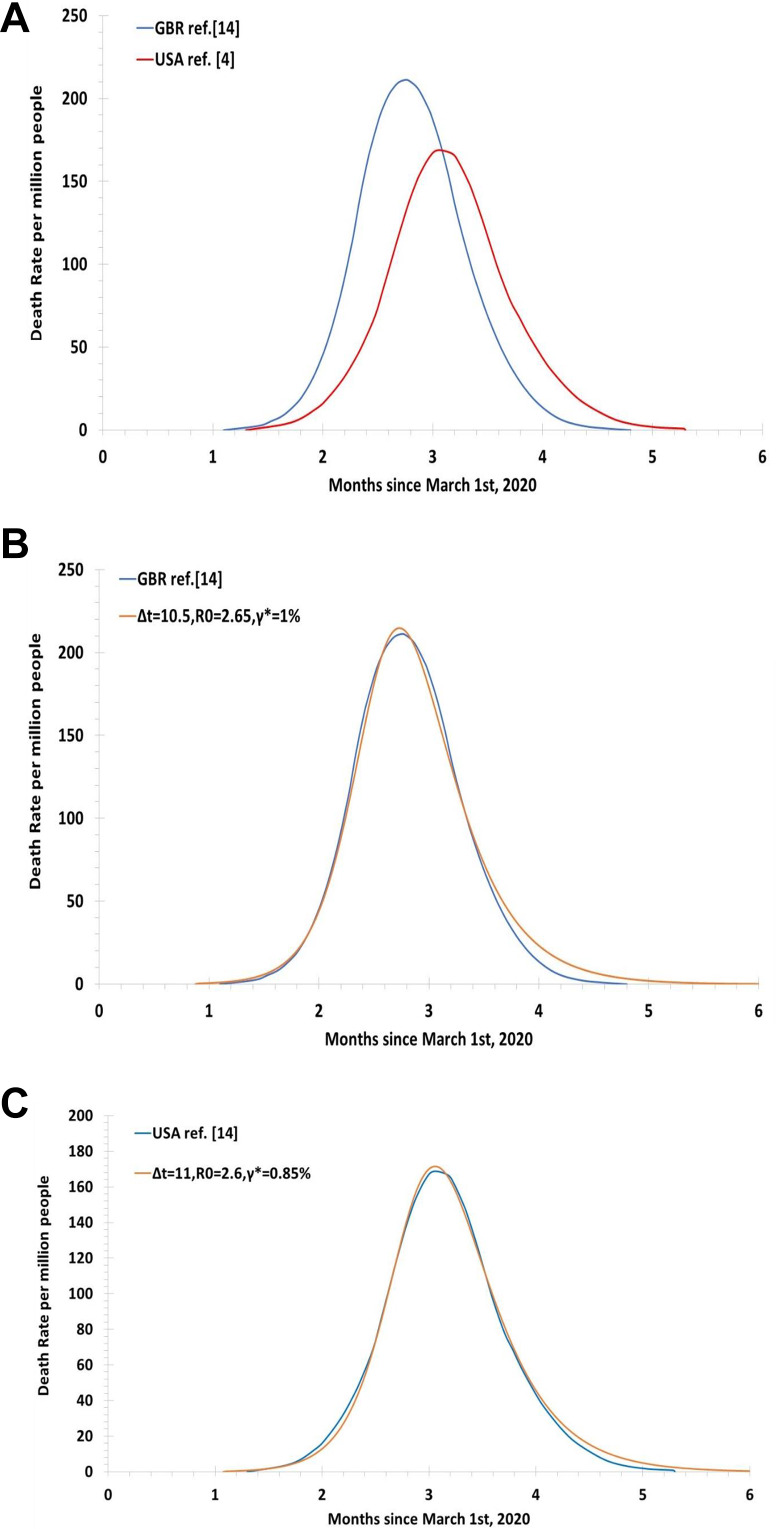
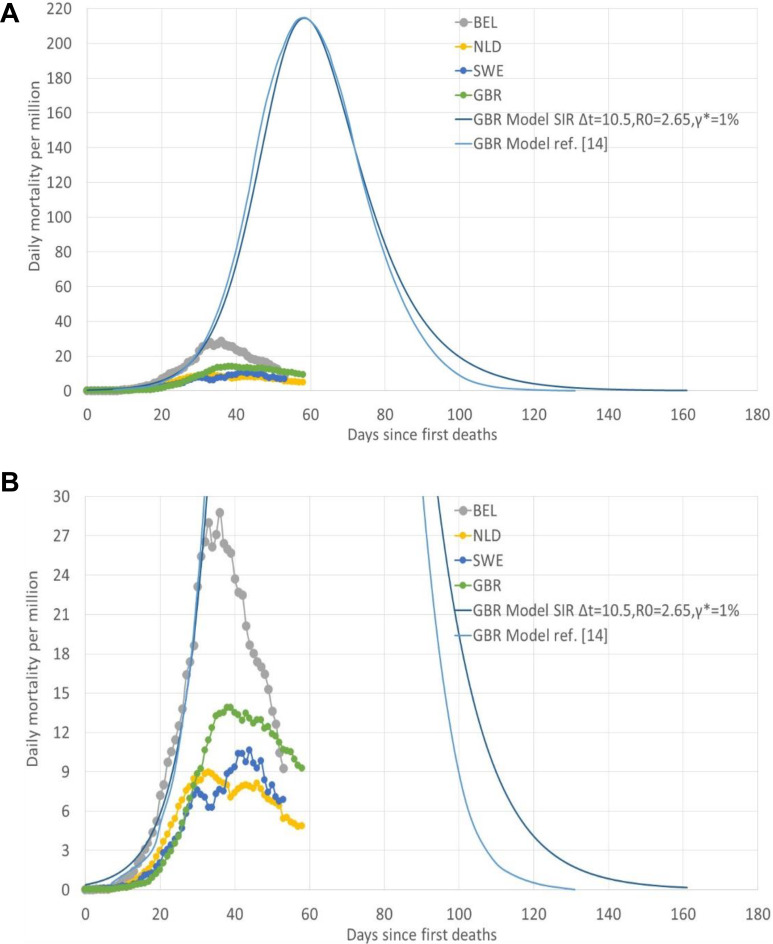
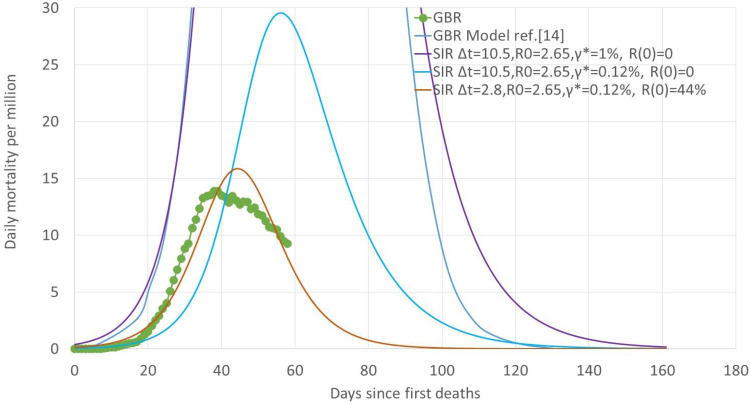
Here, we review modeling predictions for Covid-19 mortality based on recent data. The Imperial College model trusted by the British Government predicted peak mortalities above 170 deaths per million in the United States, and above 215 deaths per million in Great Britain, after more than 2 months from the outbreak, and a length for the outbreak well above 4 months. These predictions drove the world to adopt harsh distancing measures and forget the concept of herd immunity. China had peak mortalities of less than 0.1 deaths per million after 40 days since first deaths, and an 80-day-long outbreak. Italy, Belgium, the Netherlands, Sweden, or Great Britain flattened the curve at 13.6, 28.6, 9.0, 10.6, and 13.9 deaths per million after 40, 39, 33, 44, and 39 days from first deaths, or 31, 29, 24, 38, and 29 days since the daily confirmed deaths reached 0.1 per million people, respectively. The declining curve is much slower for Italy, the Netherlands, or Great Britain than Belgium or Sweden. Opposite to Great Britain, Italy, or Belgium that enforced a complete lockdown, the Netherlands only adopted an "intelligent" lockdown, and Sweden did not adopt any lockdown. However, they achieved better results. Coupled to new evidence for minimal impact of Covid-19 on the healthy population, with the most part not infected even if challenged, or only mild or asymptomatic if infected, there are many good reasons to question the validity of the specific epidemiological model simulations and the policies they produced. Fewer restrictions on the healthy while better protecting the vulnerable would have been a much better option, permitting more sustainable protection of countries otherwise at risk of second waves as soon as the strict measures are lifted.
Keywords: Covid-19; infectious diseases; modeling; policy.
© The Author(s) 2020.
Conflict of interest statement
Declaration of Conflicting Interests: The author(s) declared no potential conflicts of interest with respect to the research, authorship, and/or publication of this article.
Figures
References
-
- Kermack WO, McKendrick AG. A contribution to the mathematical theory of epidemics. Proc R Soc Lond Ser A. 1927;115(772):700–721.
-
- Anderson RM, May RM. Population biology of infectious diseases: part I. Nature. 1979;280(5721):361–367. - PubMed
-
- Smith D, Moore L. The SIR model for spread of disease: the differential equation model. Convergence. 2004. www.maa.org/press/periodicals/loci/joma/the-sir-model-for-spread-of-dise.... Accessed April 29, 2020.
-
- Murray JD. Mathematical Biology: I. An Introduction (Vol. 17). Springer Science & Business Media; 2007.
-
- Han XN, De Vlas SJ, Fang LQ, Feng D, Cao WC, Habbema JDF. Mathematical modelling of SARS and other infectious diseases in China: a review. Trop Med Int Health. 2009;14(suppl 1):92–100. - PubMed
LinkOut - more resources
Full Text Sources
