[Preprint]. 2020 Jun 23:2020.06.22.165464.
doi: 10.1101/2020.06.22.165464.

Accommodating individual travel history, global mobility, and unsampled diversity in phylogeography: a SARS-CoV-2 case study

Affiliations

Accommodating individual travel history, global mobility, and unsampled diversity in phylogeography: a SARS-CoV-2 case study

Philippe Lemey et al. bioRxiv. .

Update in

Abstract

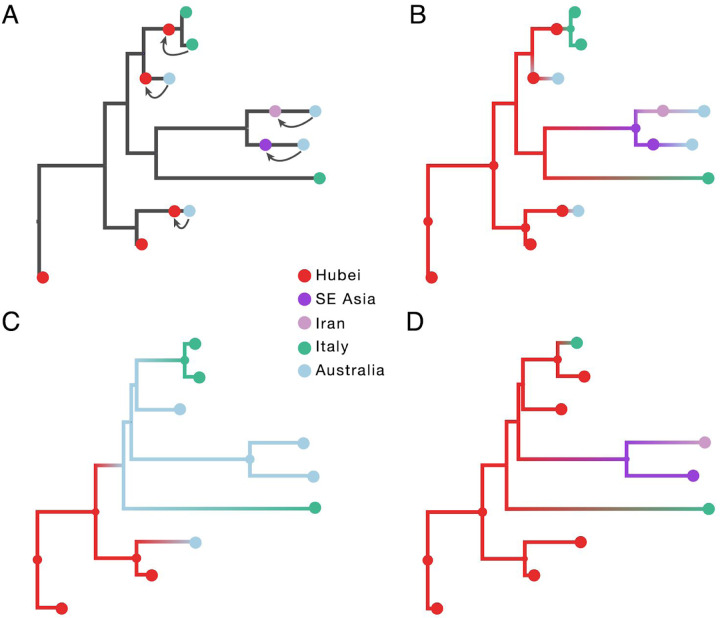
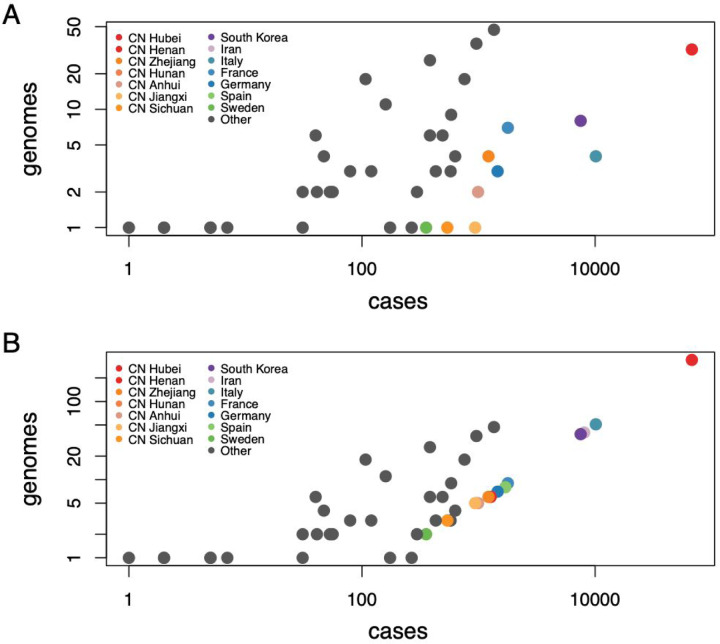
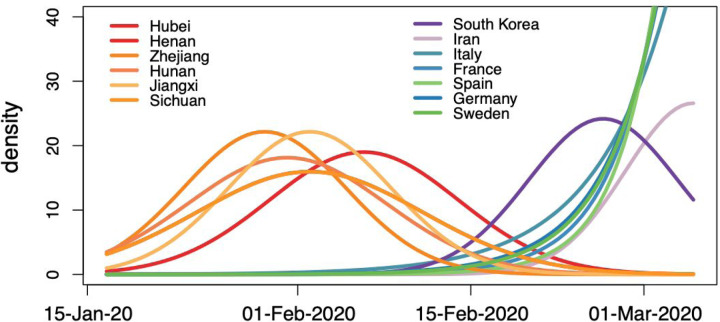
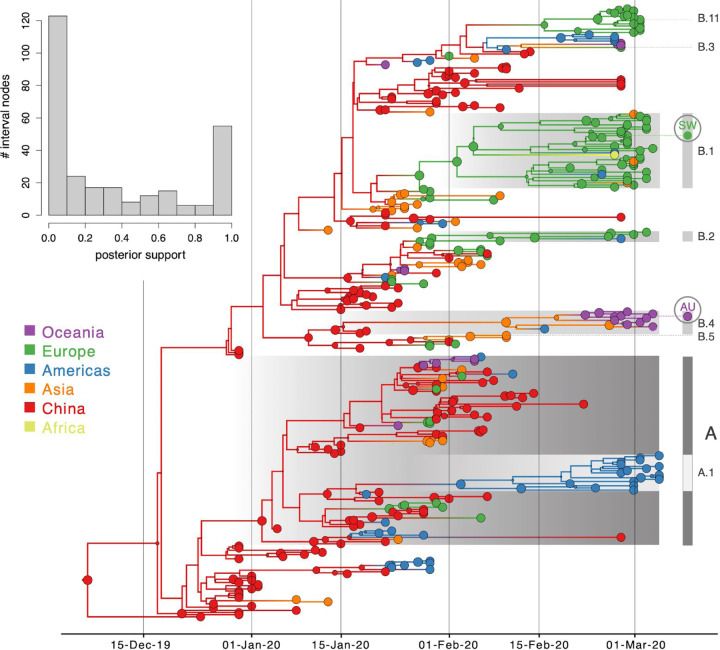
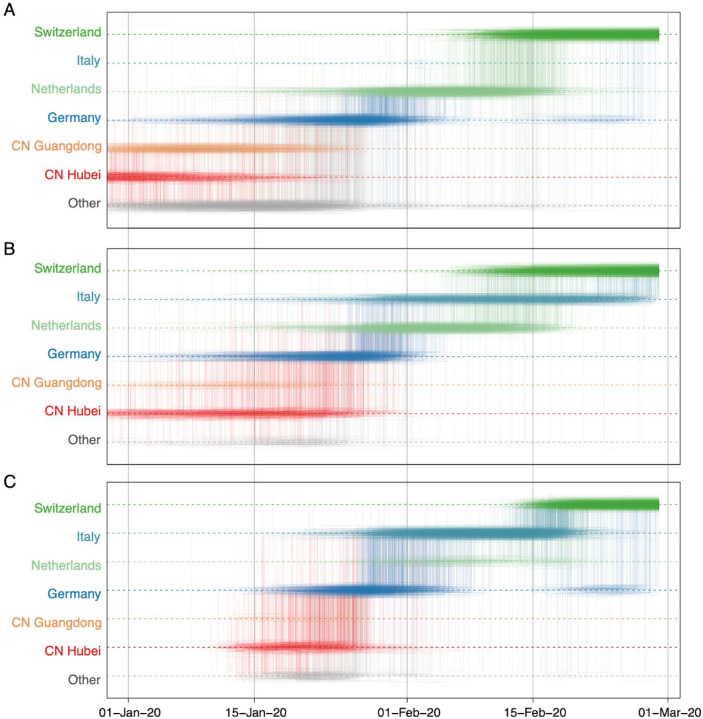
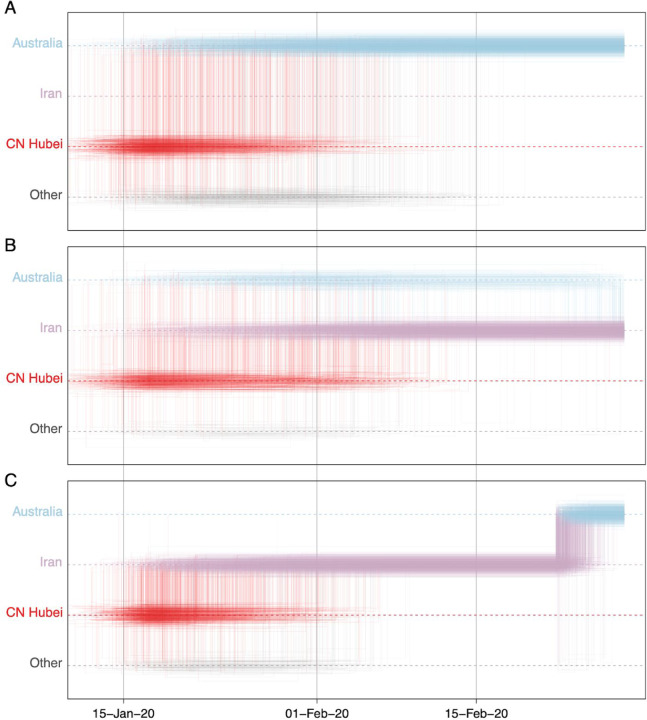
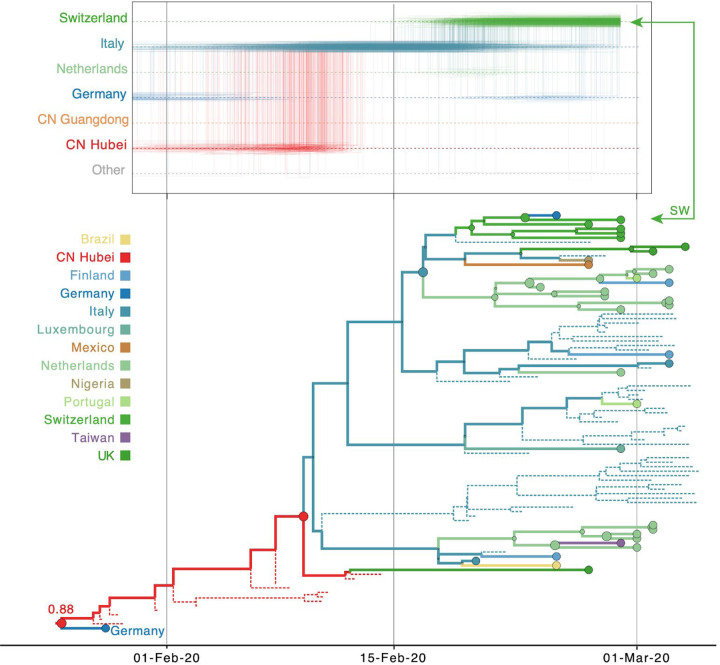
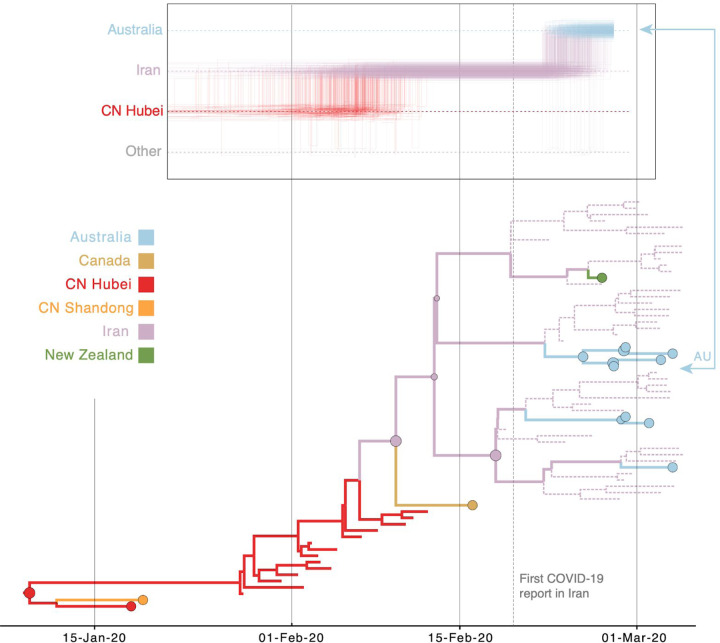
Spatiotemporal bias in genome sequence sampling can severely confound phylogeographic inference based on discrete trait ancestral reconstruction. This has impeded our ability to accurately track the emergence and spread of SARS-CoV-2, which is the virus responsible for the COVID-19 pandemic. Despite the availability of staggering numbers of genomes on a global scale, evolutionary reconstructions of SARS-CoV-2 are hindered by the slow accumulation of sequence divergence over its relatively short transmission history. When confronted with these issues, incorporating additional contextual data may critically inform phylodynamic reconstructions. Here, we present a new approach to integrate individual travel history data in Bayesian phylogeographic inference and apply it to the early spread of SARS-CoV-2, while also including global air transportation data. We demonstrate that including travel history data for each SARS-CoV-2 genome yields more realistic reconstructions of virus spread, particularly when travelers from undersampled locations are included to mitigate sampling bias. We further explore the impact of sampling bias by incorporating unsampled sequences from undersampled locations in the analyses. Our reconstructions reinforce specific transmission hypotheses suggested by the inclusion of travel history data, but also suggest alternative routes of virus migration that are plausible within the epidemiological context but are not apparent with current sampling efforts. Although further research is needed to fully examine the performance of our new data integration approaches and to further improve them, they represent multiple new avenues for directly addressing the colossal issue of sample bias in phylogeographic inference.


Figures

Figure 1:
Figure 1:
Incorporating travel history data in phylogeographic reconstruction. Panel A illustrates the concept of introducing ancestral nodes associated with locations from which travellers returned. The ancestral nodes are indicated by arrows for five cases relating them to the genomes sampled from the travellers. The ancestral nodes are introduced at different times in the ancestral path of each sampled genome. Panels B, C and D represent the results from analyses using sampling location and travel history, sampling location only, and travel origin location respectively. The branch color reflects the modal state estimate at the child node. There is some topological variability but only involving nodes that are poorly supported.
Figure 2:
Figure 2:
SARS-CoV-2 genomes and cases counts. (A) scatter plot of the number of available genomes against the number of cases on March 10 2020 on a log-log scale. (B) same as (A) but with additional unsampled taxa for 14 locations.
Figure 3:
Figure 3:
Prior probability distributions for the ages of the taxa representing unsampled diversity for different locations. The shapes of these probability distributions are based on estimated numbers of prevalent infections over time. The same normal prior probability distribution applies to taxa from Sichuan and Henan.
Figure 4:
Figure 4:
Bayesian phylogeographic reconstruction for the full data set incorporating travel history data. Although the analysis was performed using 44 location states, nodes and branches are shaded according to an aggregated color scheme for clarity (the reconstruction with a full color scheme can be found in the Supplementary information). Lineage classifications are highlighted for specific clusters: lineage A is embedded in lineage B. For lineage B, only specific sub-lineages are indicated. The taxa further investigated using trajectory plots are indicated at the tips of the trees. The inset represents a histogram of the node posterior support values. Viruses from Switzerland (SW) and Australia (AU) that are investigated as case studies are labeled.
Figure 5:
Figure 5:
Markov jump trajectory plot depicting the ancestral transition history between locations from Hubei up the sampling location for a Swiss genome (EPI_ISL_413021) in lineage B1 using (A) sampling location only, (B) travel origin location and (C) sampling location and travel history. The trajectories are summarized from a posterior tree distribution with Markov jump history annotation.
Figure 6:
Figure 6:
Markov jump trajectory plot depicting the ancestral transition history between locations from Hubei up the sampling location for an Australian genome (EPI_ISL_412600) in lineage B.4 using (A) sampling location only, (B) travel origin location and (C) sampling location and travel history. The trajectories are summarized from a posterior tree distribution with Markov jump history annotation.
Figure 7:
Figure 7:
Markov jump trajectory plot as in Fig. 5 for a Swiss genome (EPI_ISL_413021) in lineage B1 and B1 subtree for the Bayesian phylogeographic analysis incorporating travel data Fig. 7 and unsampled diversity. Dotted lines represent branches associated with unsampled taxa assigned to Italy and Hubei, China. The tip for the Swiss genome corresponding to the trajectory is indicated with an arrow. Because of the color similarity between Italy and Germany, the basal German virus is labeled. The value at the root represents the posterior location state probability.
Figure 8:
Figure 8:
Markov jump trajectory plot as in Fig. 5 for the Australian genome (EPI_ISL_412600) in lineage B.4 and B4 subtree for the Bayesian phylogeographic analysis incorporating travel data and unsampled diversity. Dotted lines represent branches associated with unsampled taxa assigned to Iran and Hubei, China. The tip for the Australian genome corresponding to the trajectory is indicated with an arrow.
Figure 9:
Figure 9:
Circular migration flow plots summarizing Markov jump estimates for the analyses using (A) sampling location only, (B) travel origin location, (C) sampling location and travel history and (D) sampling location and travel history, with unsampled diversity. The plots show the relative number of transitions between locations. The direction of the transitions are encoded both by the origin colour and by the gap between link and circle segment at the destination (migration into a location is associated with a larger gap than migration out of a location). As part of the Supplementary Information, we include the same figure but with a transparency for transitions from Hubei to emphasize the ‘secondary’ dispersal dynamics.

References

    1. Quick J. et al. Real-time, portable genome sequencing for Ebola surveillance. Nature 530, 228–232 (2016). - PMC - PubMed
    1. Lu J. et al. Genomic Epidemiology of SARS-CoV-2 in Guangdong Province, China. Cell (2020) doi: 10.1016/j.cell.2020.04.023 - DOI - PMC - PubMed
    1. Deng X. et al. A Genomic Survey of SARS-CoV-2 Reveals Multiple Introductions into Northern California without a Predominant Lineage. medRxiv (2020).
    1. Bedford T. et al. Cryptic transmission of SARS-CoV-2 in Washington State. medRxiv (2020). - PMC - PubMed
    1. Landry M. L., Neher R. A., Ko A. I. & Grubaugh N. D. Coast-to-coast spread of SARS-CoV-2 in the United States revealed by genomic epidemiology. medRxiv (2020).

Publication types