. 2020 Aug;34(8):9884-9898.
doi: 10.1096/fj.201902636RR. Epub 2020 Jun 28.

Toll interacting protein protects bronchial epithelial cells from bleomycin-induced apoptosis

Affiliations

Toll interacting protein protects bronchial epithelial cells from bleomycin-induced apoptosis

Xiaoyun Li et al. FASEB J. 2020 Aug.

Abstract

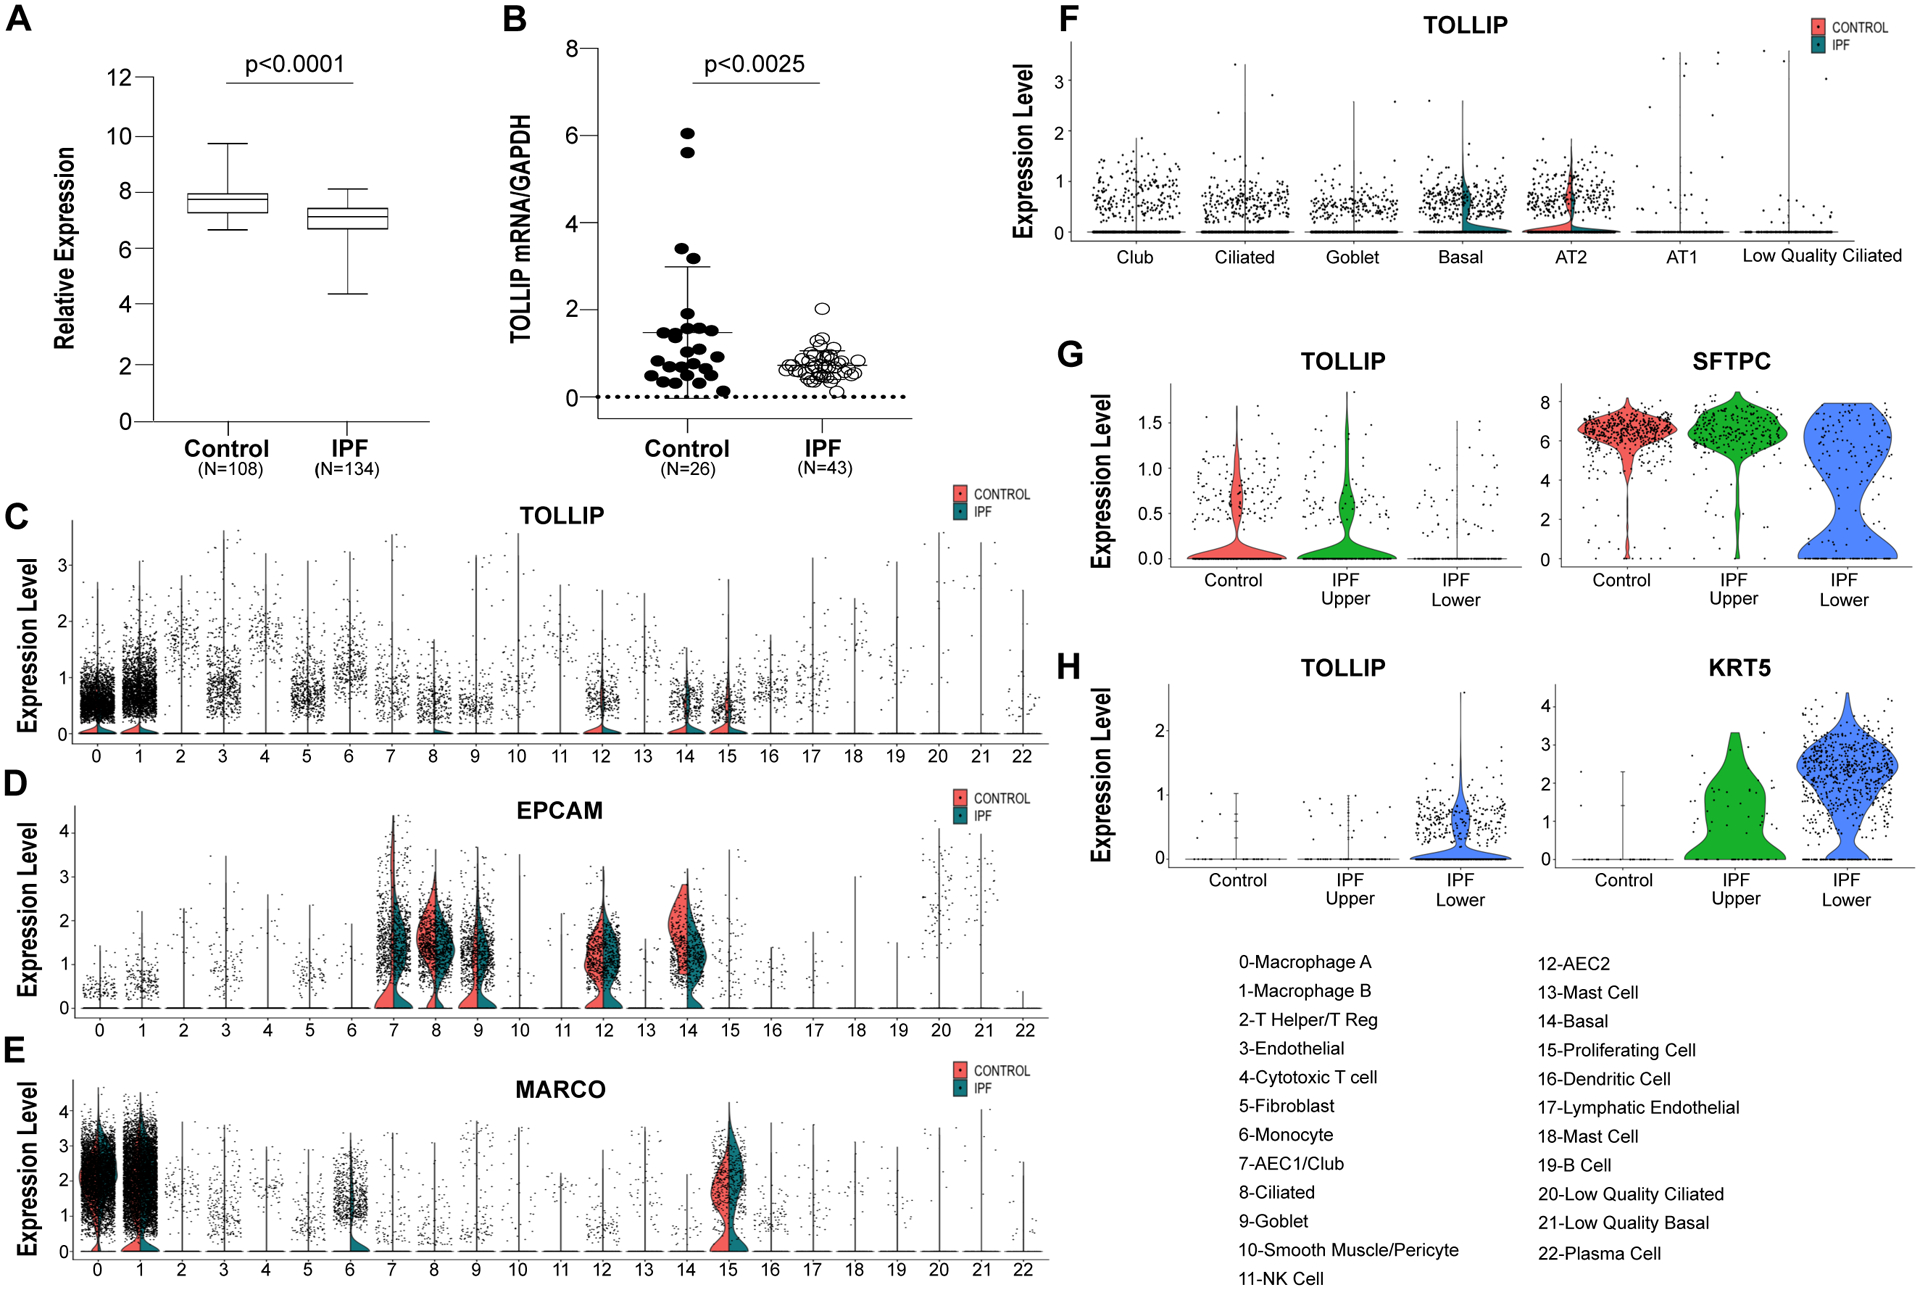
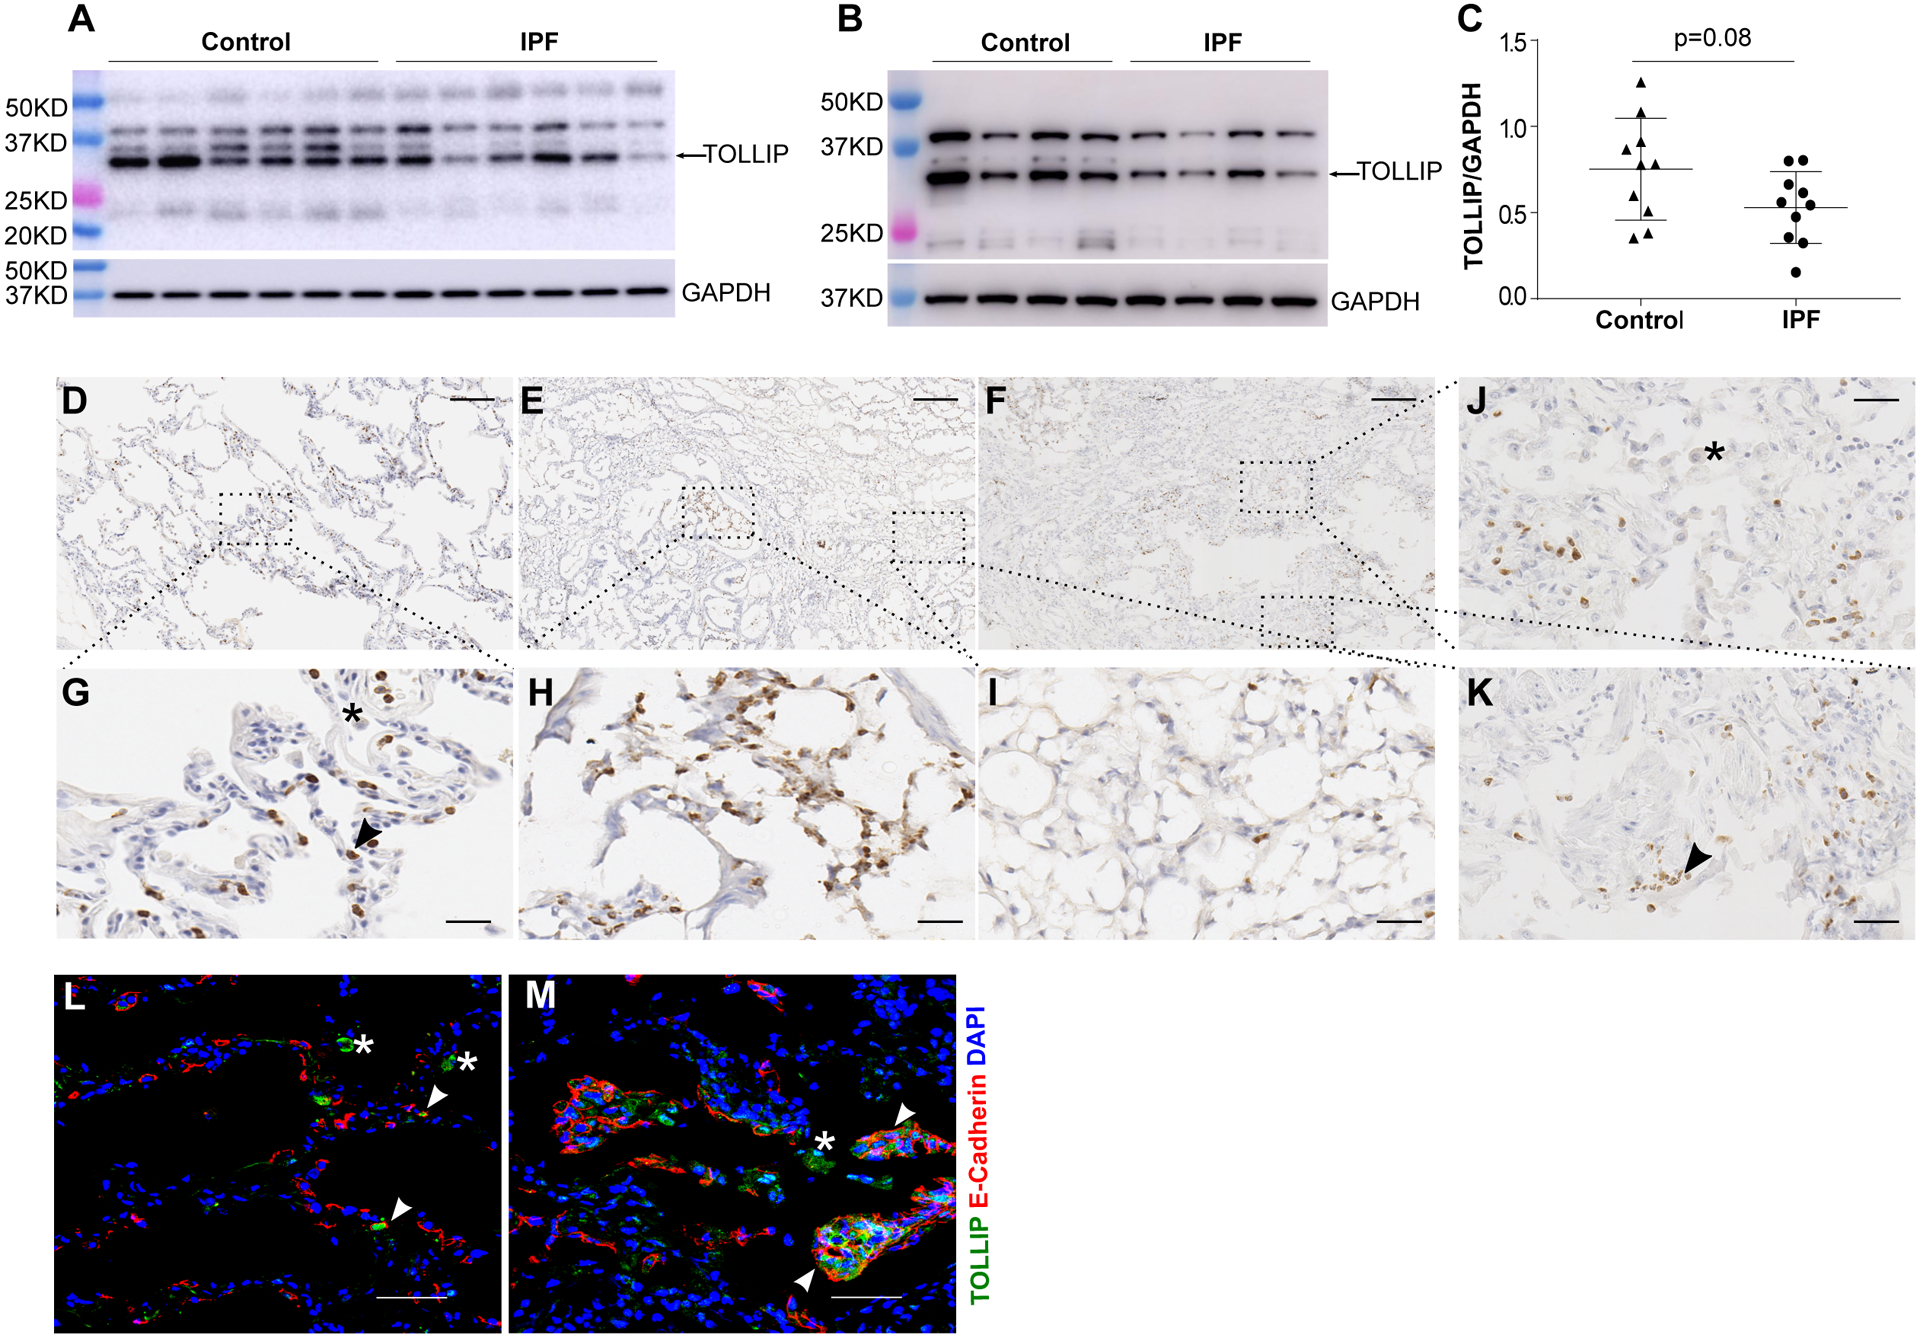
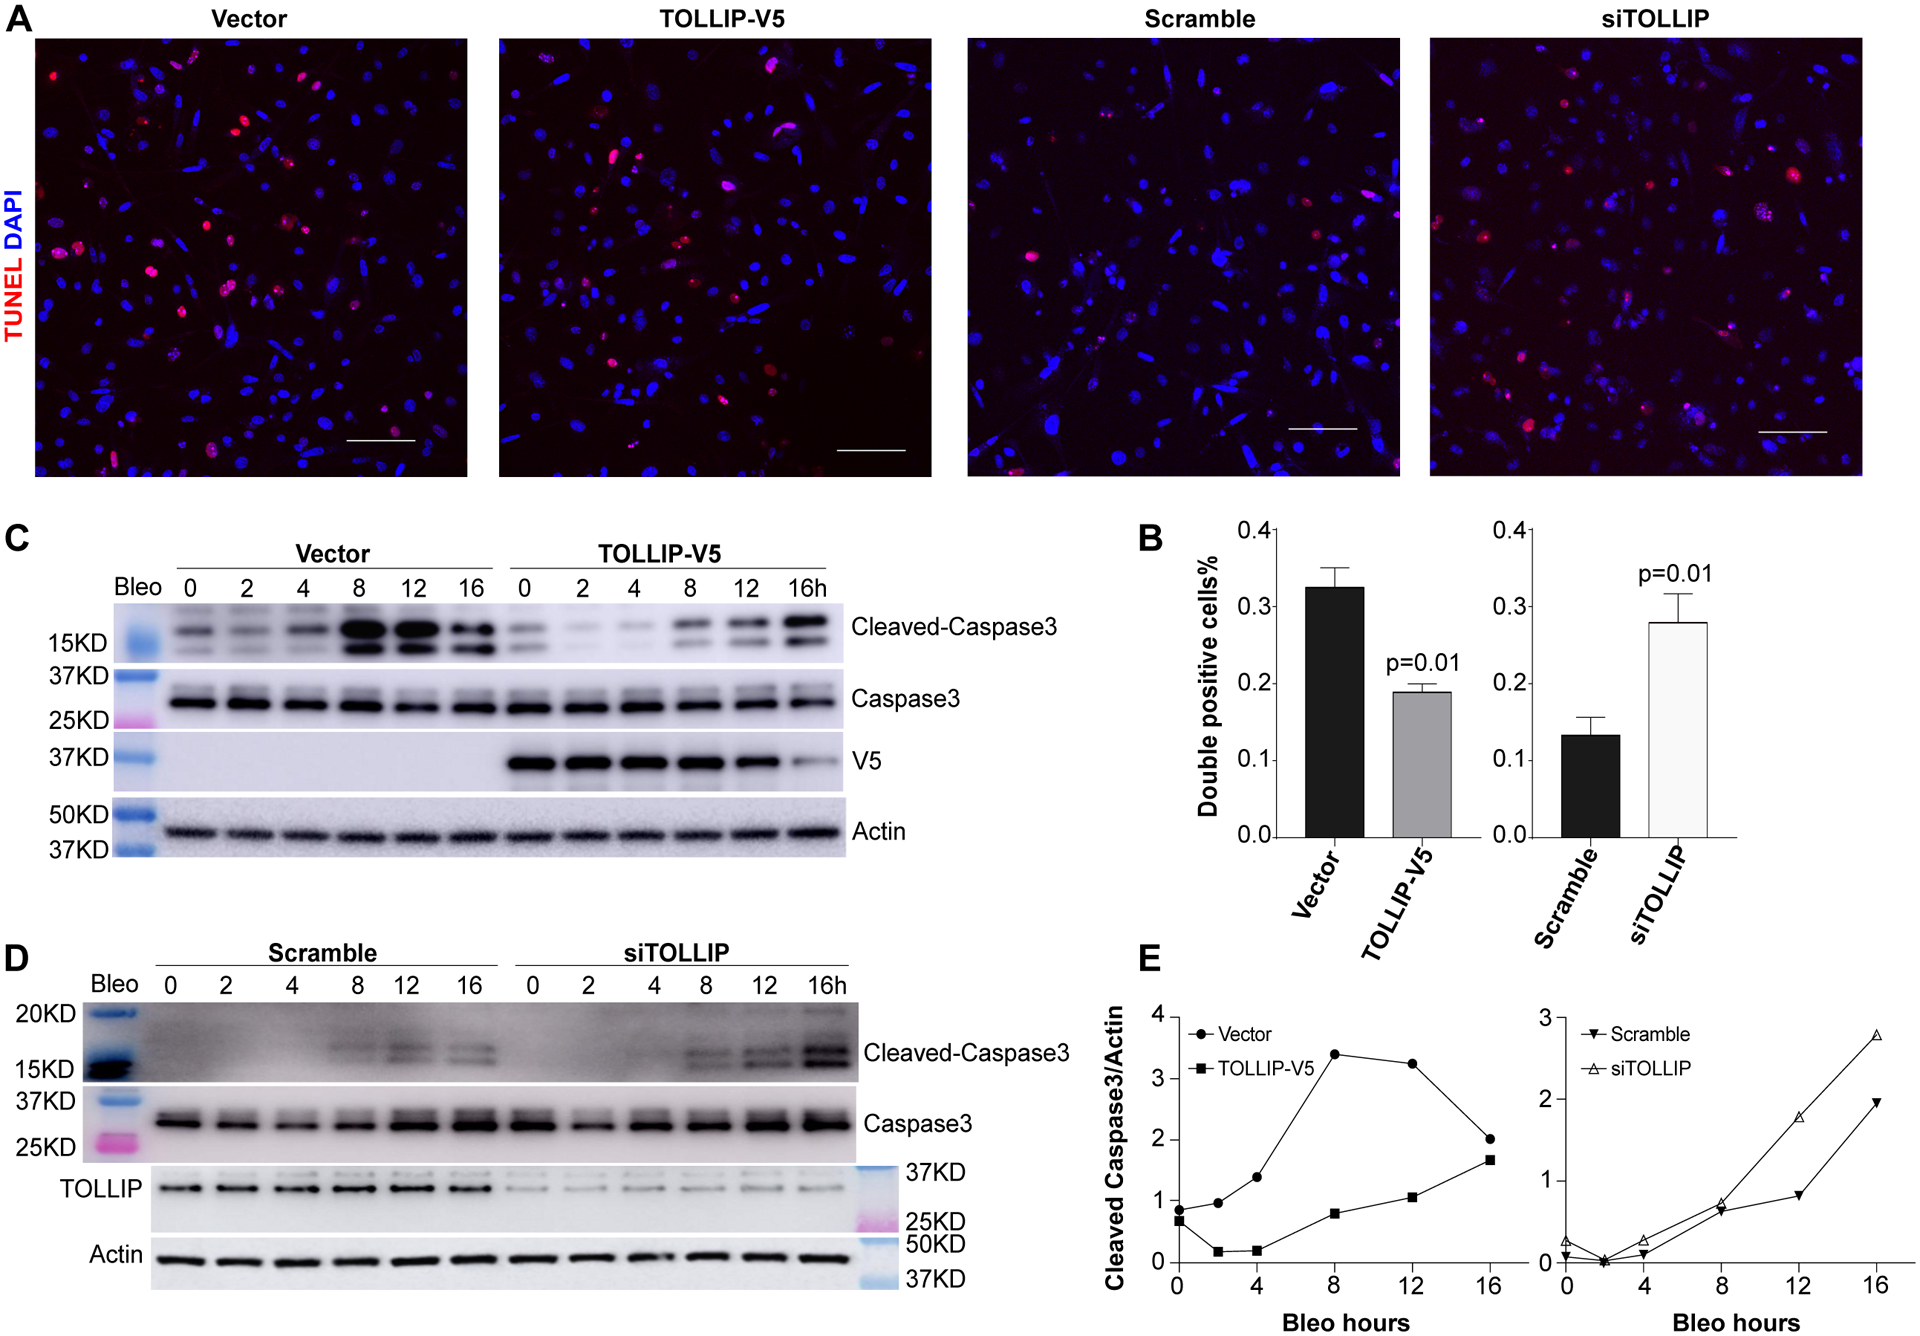
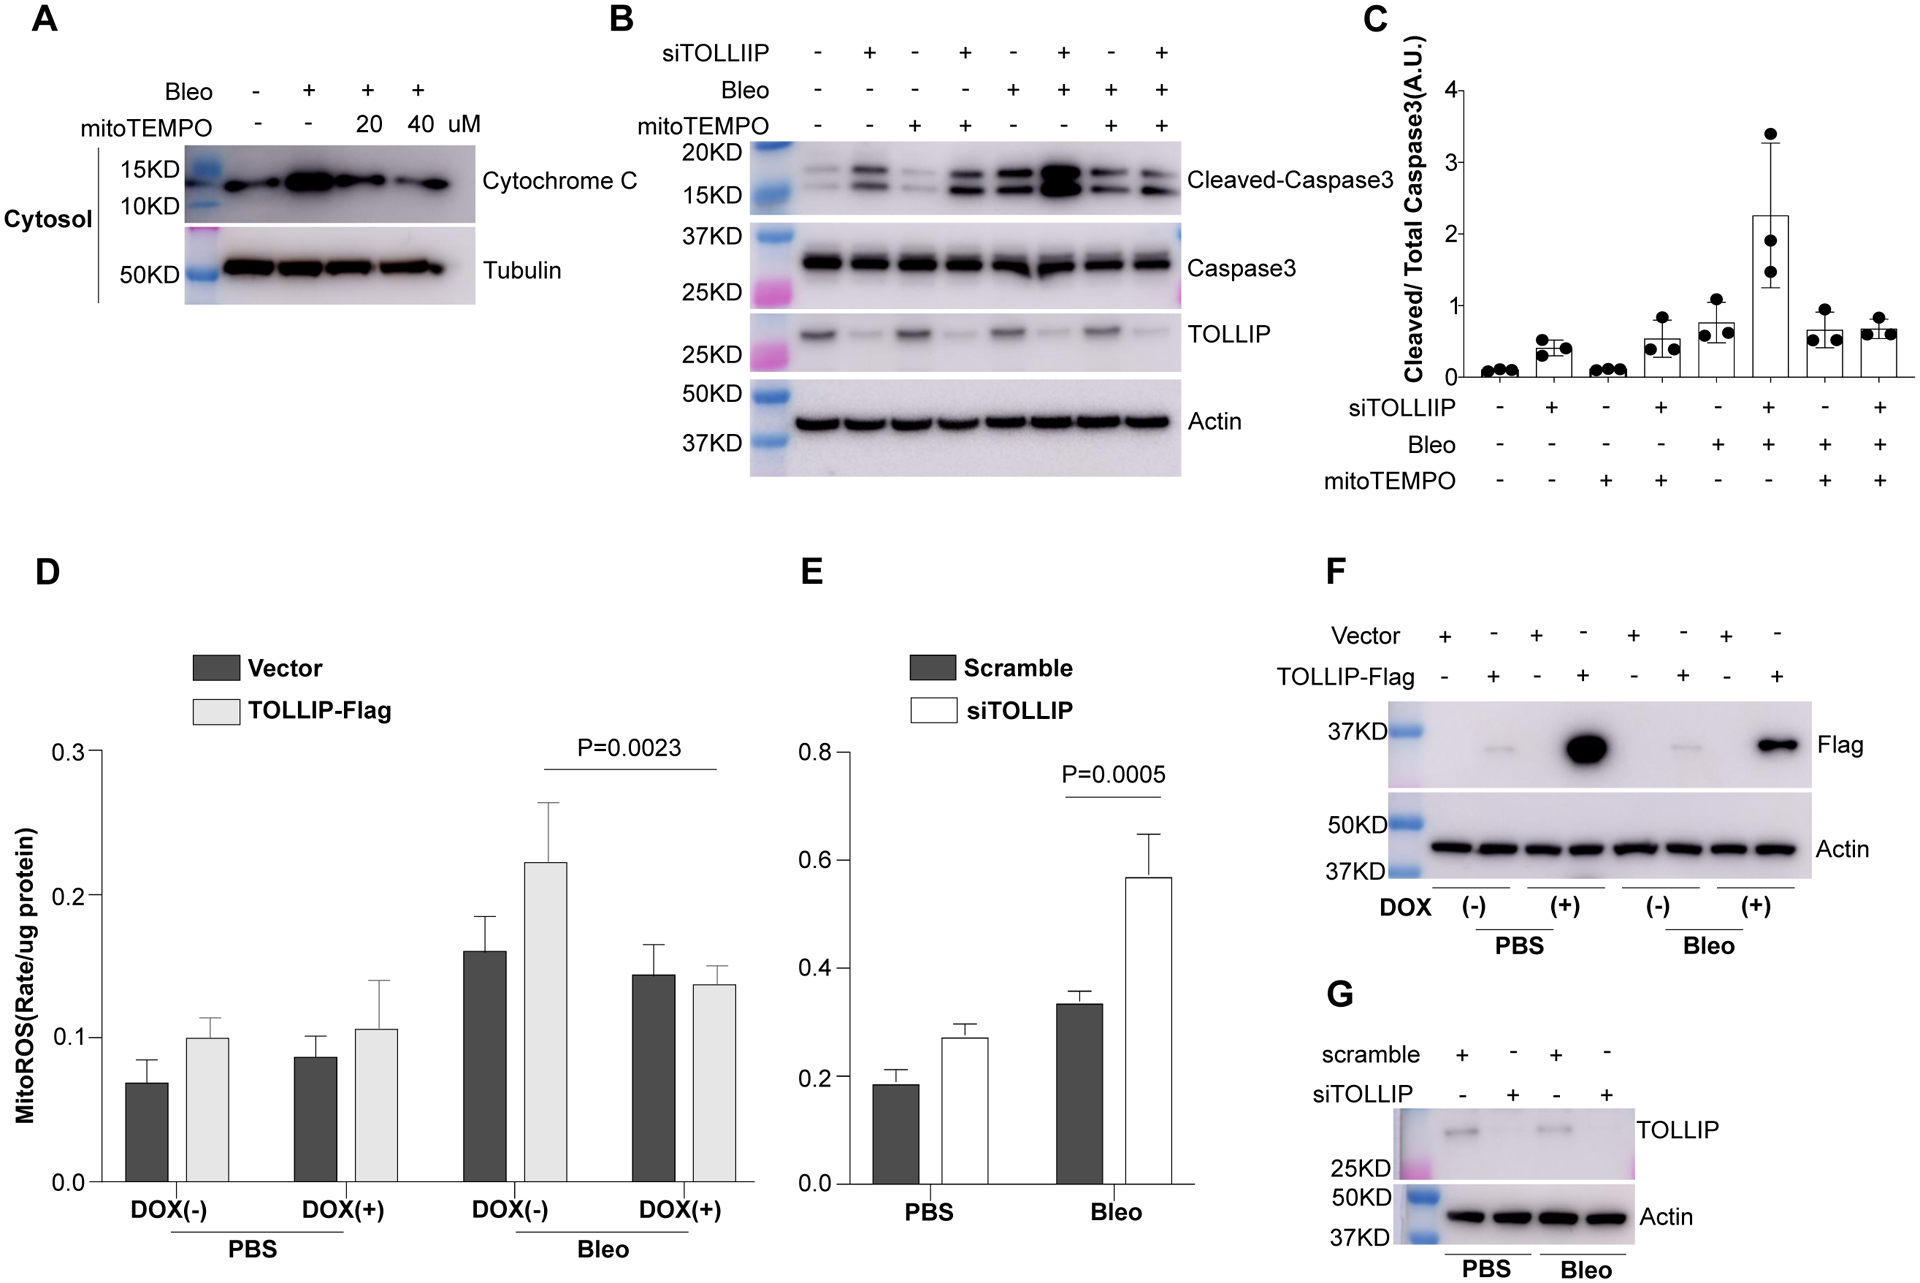
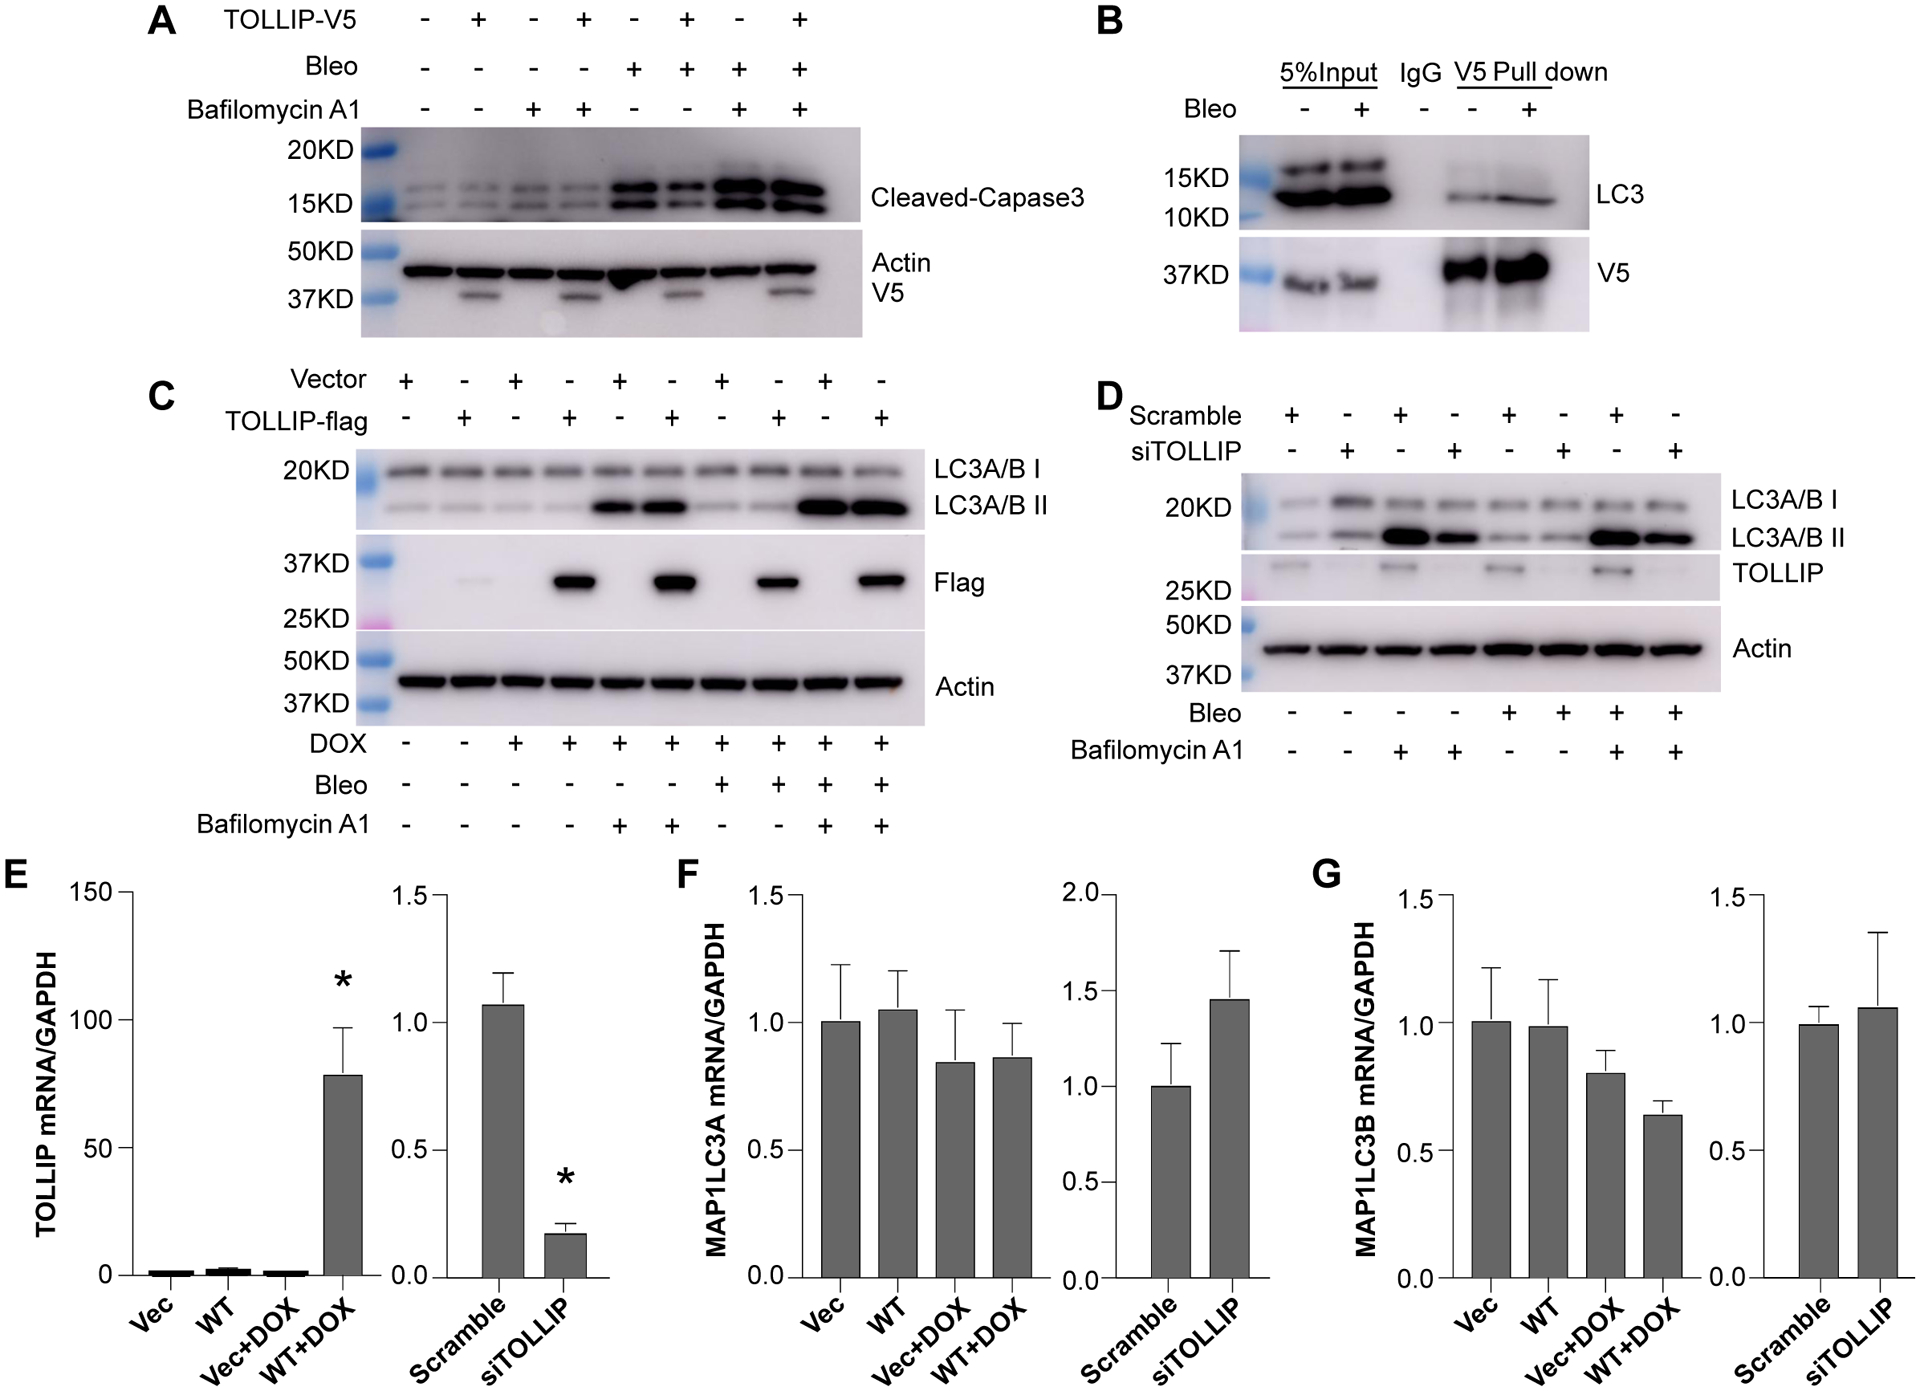
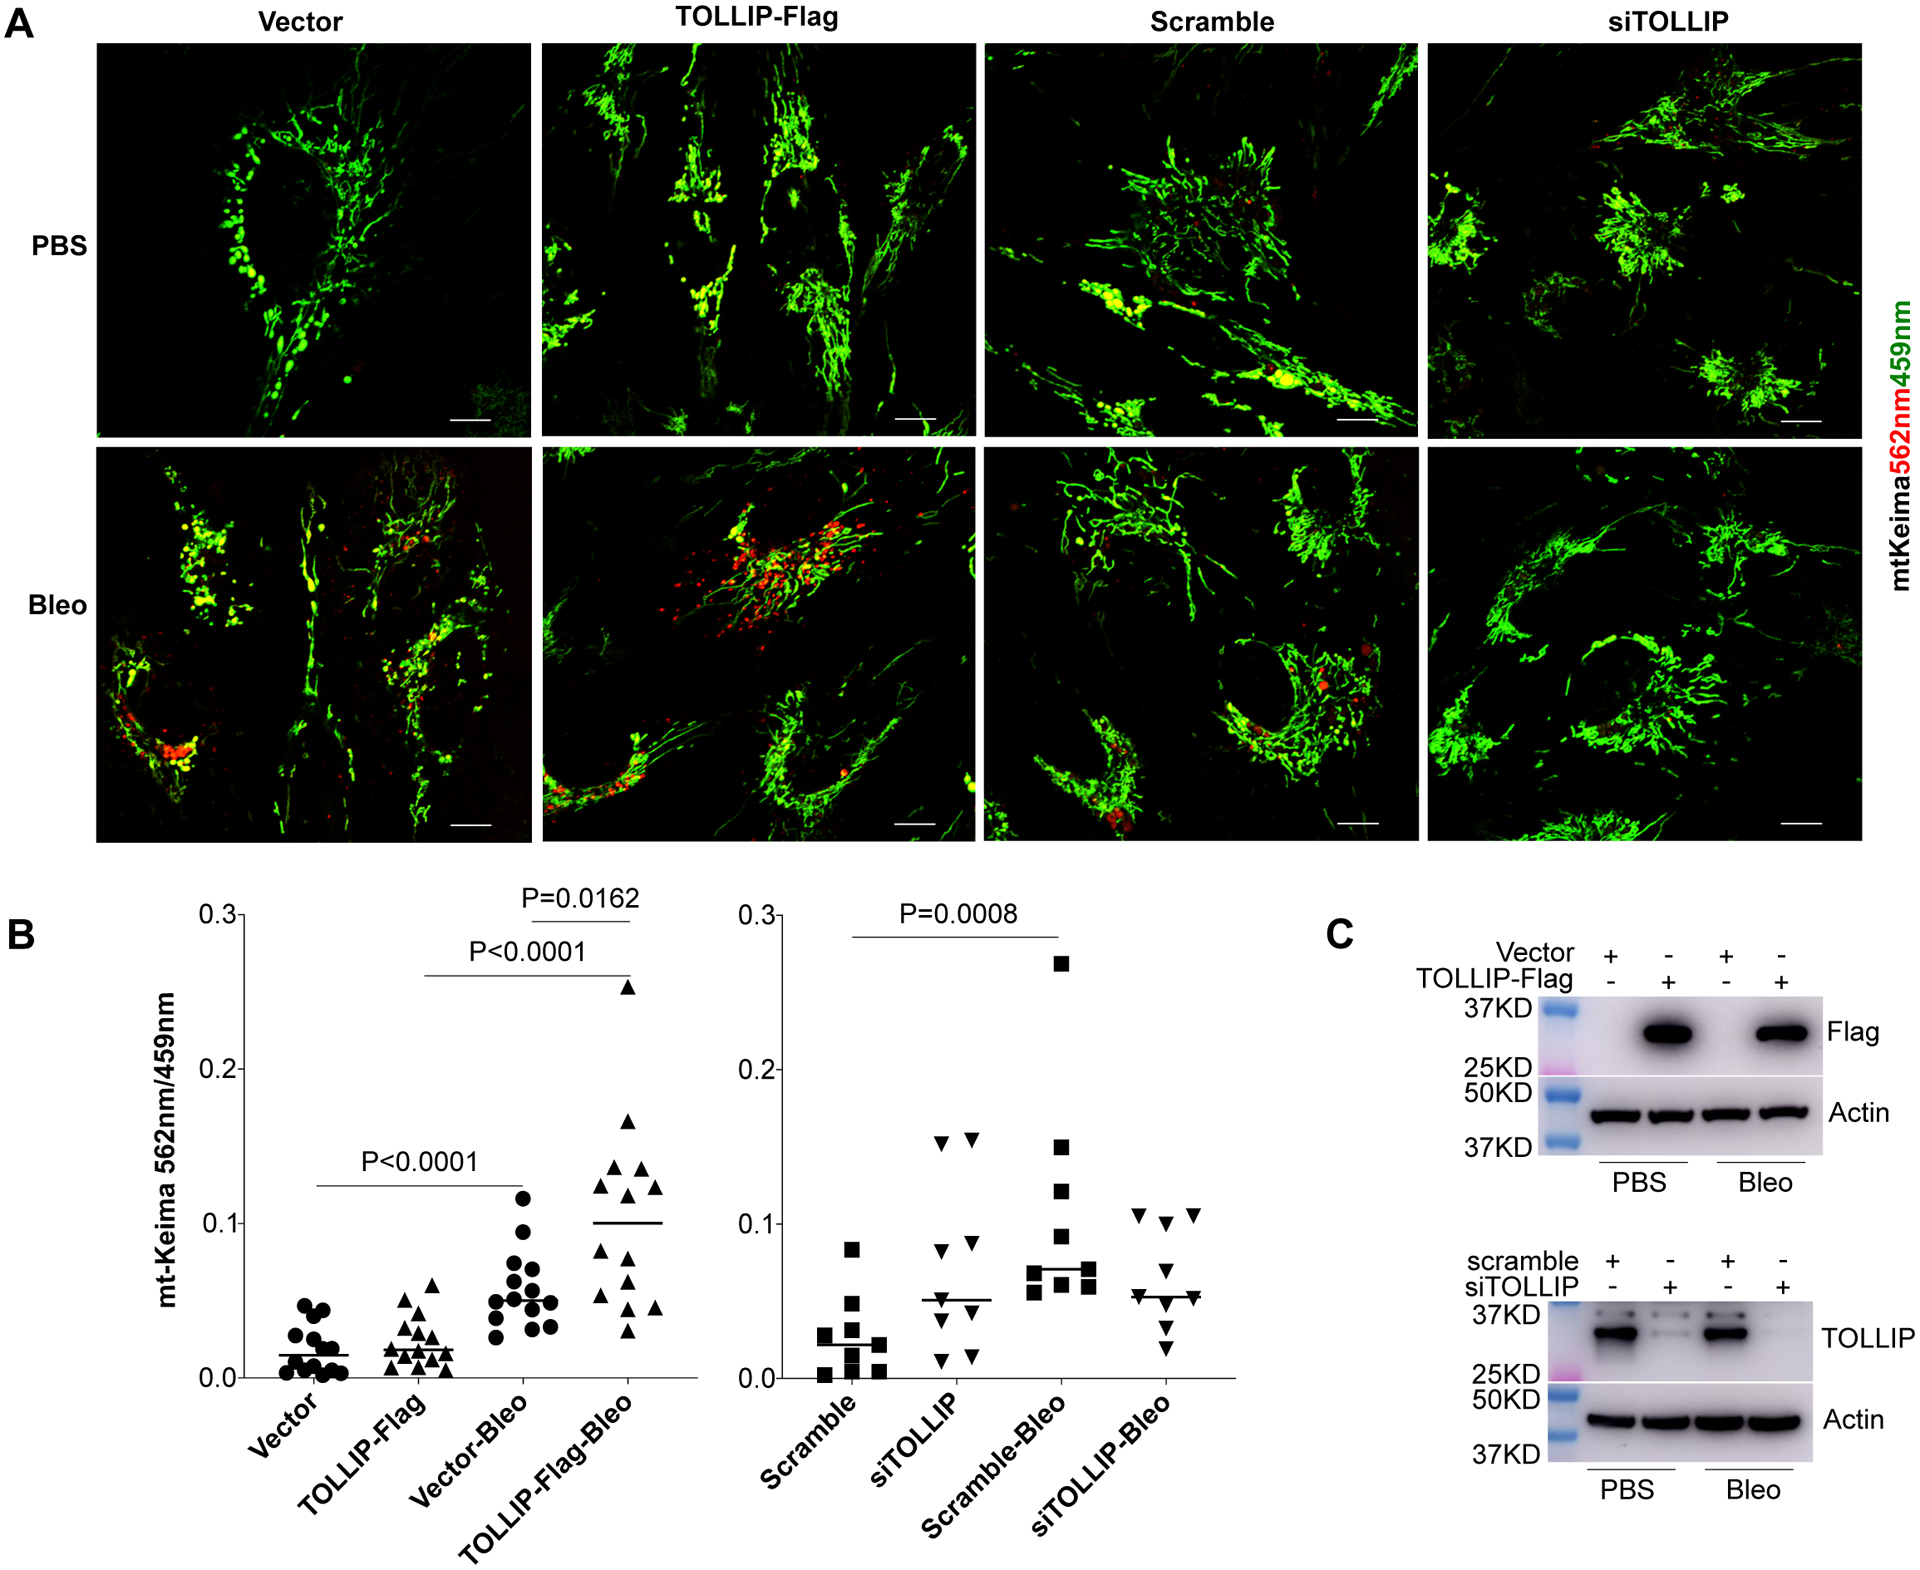
Idiopathic pulmonary fibrosis (IPF) is characterized by altered epithelial cell phenotypes, which are associated with myofibroblast accumulation in the lung. Atypical alveolar epithelial cells in IPF express molecular markers of airway epithelium. Polymorphisms within and around Toll interacting protein (TOLLIP) are associated with the susceptibility to IPF and mortality. However, the functional role of TOLLIP in IPF is unknown. Using lung tissues from IPF and control subjects, we showed that expression of TOLLIP gene in the lung parenchyma is globally lower in IPF compared to controls. Lung cells expressing significant levels of TOLLIP include macrophages, alveolar type II, and basal cells. TOLLIP protein expression is lower in the parenchyma of IPF lungs but is expressed in the atypical epithelial cells of the distal fibrotic regions. Using overexpression and silencing approaches, we demonstrate that TOLLIP protects cells from bleomycin-induced apoptosis using primary bronchial epithelial cells and BEAS-2B cells. The protective effects are mediated by reducing mitochondrial reactive oxygen species (ROS) levels and upregulating autophagy. Therefore, global downregulation of the TOLLIP gene in IPF lungs may predispose injured lung epithelial cells to apoptosis and to the development of IPF.

Keywords: TOLLIP; apoptosis; autophagy; basal cells; idiopathic pulmonary fibrosis; lung epithelial cells.


Figures

Figure 1.
Figure 1.. Lung-specific expression of TOLLIP gene.
(A) Gene expression data from the Lung Tissue Research Consortium (LGRC) were analyzed for TOLLIP expression levels. The study included 108 control subjects and 134 patients with idiopathic pulmonary fibrosis (IPF). (B) TOLLIP gene expression levels were determined by quantitative RT-PCR using total RNA isolated from parenchyma of IPF lungs (n=43) and control donor lungs (n=26). Values are means and standard deviation (SD). Non-parametric Mann-Whitney t-test was used to compare groups. Cell type specific expression of TOLLIP based on a single cell RNA sequencing study of 3 IPF lungs and 3 control lungs are shown in C-H (31). Violin plots of TOLLIP (C), EPCAM (D) and MARCO (E) expression across all cell clusters as described in the original report (listed on the right) are shown (31). Violin plots of expression levels of TOLLIP in different epithelial cells are shown in F. Control and IPF lungs are labeled with red and light green, respectively. Violin plots of TOLLIP expression in control lungs, IPF upper lobe and IPF lower lobe lungs for SFTPC (G) and KRT5 (H) positive cells are shown.
Figure 2.
Figure 2.. Lung specific expression of TOLLIP protein.
The levels of TOLLIP protein in IPF (n=10) and control (n=10) lungs were determined by immunoblot (A-B) and normalized by GAPDH (C) using ImageJ software (30). The TOLLIP specific band is indicated by an arrow. Values are means and standard deviation (SD). Non-parametric Mann-Whitney t-test was used to compare groups. Representative immunohistochemistry analysis of human lung tissue samples (n=4 in each group) are shown in D-K. TOLLIP expression in a control lung (D) and two IPF lungs (E-F) are shown with a size bar of 200 microns. Magnified fields of control lung (G) and IPF lungs (H, I, J, K) are shown (size bar = 50 microns). Immunofluorescence staining of TOLLIP and E-cadherin in lung tissues of a control (L) and an IPF patient (M). TOLLIP primary antibody was revealed with Cy3 secondary antibody (pseudo-colored green). E-cadherin was revealed with Cy5 secondary antibody (red) with a size bar of 100 microns. Nuclei were counterstained with the blue fluorescent DNA dye DAPI. Representative macrophages are indicated by asterisk and epithelial cells are indicated by arrowheads.
Figure 3.
Figure 3.. TOLLIP protects bronchial epithelial cells from bleomycin induced apoptosis.
Immunofluorescence (A) and quantitative analysis (B) of double positive TUNEL (red) and DAPI (blue) in primary human bronchial epithelial cells treated with bleomycin (50 μM for overnight). Immunoblot analyses of apoptosis marker caspase-3 and its cleaved forms in BEAS-2B cells overexpressing TOLLIP-V5 compared to vector control (C) and TOLLIP siRNA knocking down compared to scramble siRNA (D) are shown. Three independent experiments were performed. Results from a representative experiment are shown. TOLLIP-V5 overexpression and knocking down of endogenous TOLLIP protein are shown in (C) and (D), respectively. Quantifications of the immunoblot in (C) and (D) normalized by actin using ImageJ software (30) are shown in (E).
Figure 4.
Figure 4.. TOLLIP protect lung epithelial cells from bleomycin induced apoptosis by reducing mitochondrial ROS levels.
BEAS-2B cells were used for all the experiments. (A) Immunoblot analysis of cytosolic cytochrome c release after bleomycin (50 μM for overnight) and dose dependent reduction of cytochrome c by mitoTEMPO pretreatment. (B) Immunoblot analysis of apoptosis marker cleaved caspase-3 under basal condition and bleomycin alone as well as in combination with mitoTEMPO as indicated. The band densities of cleaved caspase-3 and total caspase-3 in each condition in (B) were quantified from three independent experiments using ImageJ software [30] and the cleaved/total caspase-3 ratios are shown in (C). Mitochondrial ROS production was measured by mitoSOX assay (three independent experiments performed in duplicate) when TOLLIP was overexpressed (D) using a doxycycline inducible TOLLIP-Flag BEAS-2B cell line or knocking down with siRNA (E). As controls, basal levels of ROS were analyzed in the inducible TOLLIP-Flag cell line under doxycycline alone. Overexpression of exogenous TOLLIP-Flag protein and knocking down of endogenous TOLLIP were confirmed by immunoblot as shown in (F) and (G), respectively.
Figure 5.
Figure 5.. TOLLIP is involved in autophagosome formation that is required for TOLLIP protection of lung epithelial cells from bleomycin induced apoptosis.
(A) Immunoblot analysis of cleaved caspase-3 in BEAS-2B cells overexpressing TOLLIP-V5 and treated with bleomycin and bafilomycin A1 as indicated. (B) Co-immunoprecipitation of TOLLIP-V5 protein with a specific antibody to V5 in BEAS-2B cells transiently expressing TOLLIP-V5 fusion protein with or without bleomycin treatment. IgG was used as a negative control. Binding of V5-TOLLIP to endogenous LC3 was detected by immunoblot of the immunoprecipitated proteins with an antibody specific for LC3. Immunoblot analysis of LC3A/B II, the LC3 form associated with autophagosome, in cells treated with bleomycin and bafilomycin, alone or in combination as indicated, under TOLLIP overexpression (C) and knocking down (D) conditions are shown. For bleomycin treatment, cells were treated for overnight at 50 μM. For bafilomycin A1 treatment, the cells were treated for 4 hours at 20 μM before harvesting the cells. Representative results from three independent experiments are shown. (E) Quantitative RT-PCR analysis of TOLLIP, MAP1LC3A and MAP1LC3B using total RNA isolated from cells overexpressing or knocking down of TOLLIP. Expression levels were normalized to GAPDH. Comparison of expression levels between groups were analyzed by student t-test and *P<0.05.
Figure 6.
Figure 6.. TOLLIP facilitates the clearance of damaged mitochondria induced by bleomycin injury.
(A) Representative live cell images (size bar = 100 micron) of bleomycin treated BEAS-2B mt-Keima reporter cells over-expressing TOLLIP, vector control, scramble siRNA, or TOLLIP siRNA. In the mt-Keima cells, the coral-derived protein Keima is targeted to the mitochondrial matrix with Green fluorescence (459 nm) in basal condition (at PH 8.0) and with Red fluorescence (562 nm) in acidic environment when damaged mitochondria are fused with lysosome. A total of 14 and 9 independent fields were imaged for the overexpression experiments and siRNA knockdown experiments, respectively. Results from one representative experiment of three independent experiments are shown. The ratio of Red/Green fluorescence signals was used to quantify mitophagy and shown in (B). P values were calculated using non-parametric Mann-Whitney t-test to compare differences between groups with or without bleomycin treatment. The levels of exogenous TOLLIP protein expression and knocking down of endogenous TOLLIP protein were analyzed using immunoblot shown in (C).

Similar articles

Cited by

References

    1. King TE Jr., Schwarz MI, Brown K, Tooze JA, Colby TV, Waldron JA Jr., Flint A, Thurlbeck W, and Cherniack RM (2001) Idiopathic pulmonary fibrosis: relationship between histopathologic features and mortality. American journal of respiratory and critical care medicine 164, 1025–1032 - PubMed
    1. Thannickal VJ, and Horowitz JC (2006) Evolving concepts of apoptosis in idiopathic pulmonary fibrosis. Proceedings of the American Thoracic Society 3, 350–356 - PMC - PubMed
    1. Selman M, and Pardo A (2003) The epithelial/fibroblastic pathway in the pathogenesis of idiopathic pulmonary fibrosis. American journal of respiratory cell and molecular biology 29, S93–97 - PubMed
    1. Selman M, and Pardo A (2006) Role of epithelial cells in idiopathic pulmonary fibrosis: from innocent targets to serial killers. Proceedings of the American Thoracic Society 3, 364–372 - PubMed
    1. Prasse A, Binder H, Schupp JC, Kayser G, Bargagli E, Jaeger B, Hess M, Rittinghausen S, Vuga L, Lynn H, Violette S, Jung B, Quast K, Vanaudenaerde B, Xu Y, Hohlfeld JM, Krug N, Herazo-Maya JD, Rottoli P, Wuyts WA, and Kaminski N (2019) BAL Cell Gene Expression Is Indicative of Outcome and Airway Basal Cell Involvement in Idiopathic Pulmonary Fibrosis. American journal of respiratory and critical care medicine 199, 622–630 - PMC - PubMed

Publication types

MeSH terms

LinkOut - more resources