. 2020 Sep 8;142(10):983-997.
doi: 10.1161/CIRCULATIONAHA.119.043319. Epub 2020 Jun 29.

Increasing Fatty Acid Oxidation Prevents High-Fat Diet-Induced Cardiomyopathy Through Regulating Parkin-Mediated Mitophagy

Affiliations

Increasing Fatty Acid Oxidation Prevents High-Fat Diet-Induced Cardiomyopathy Through Regulating Parkin-Mediated Mitophagy

Dan Shao et al. Circulation. .

Abstract

Background: Increased fatty acid oxidation (FAO) has long been considered a culprit in the development of obesity/diabetes mellitus-induced cardiomyopathy. However, enhancing cardiac FAO by removing the inhibitory mechanism of long-chain fatty acid transport into mitochondria via deletion of acetyl coenzyme A carboxylase 2 (ACC2) does not cause cardiomyopathy in nonobese mice, suggesting that high FAO is distinct from cardiac lipotoxicity. We hypothesize that cardiac pathology-associated obesity is attributable to the imbalance of fatty acid supply and oxidation. Thus, we here seek to determine whether further increasing FAO by inducing ACC2 deletion prevents obesity-induced cardiomyopathy, and if so, to elucidate the underlying mechanisms.

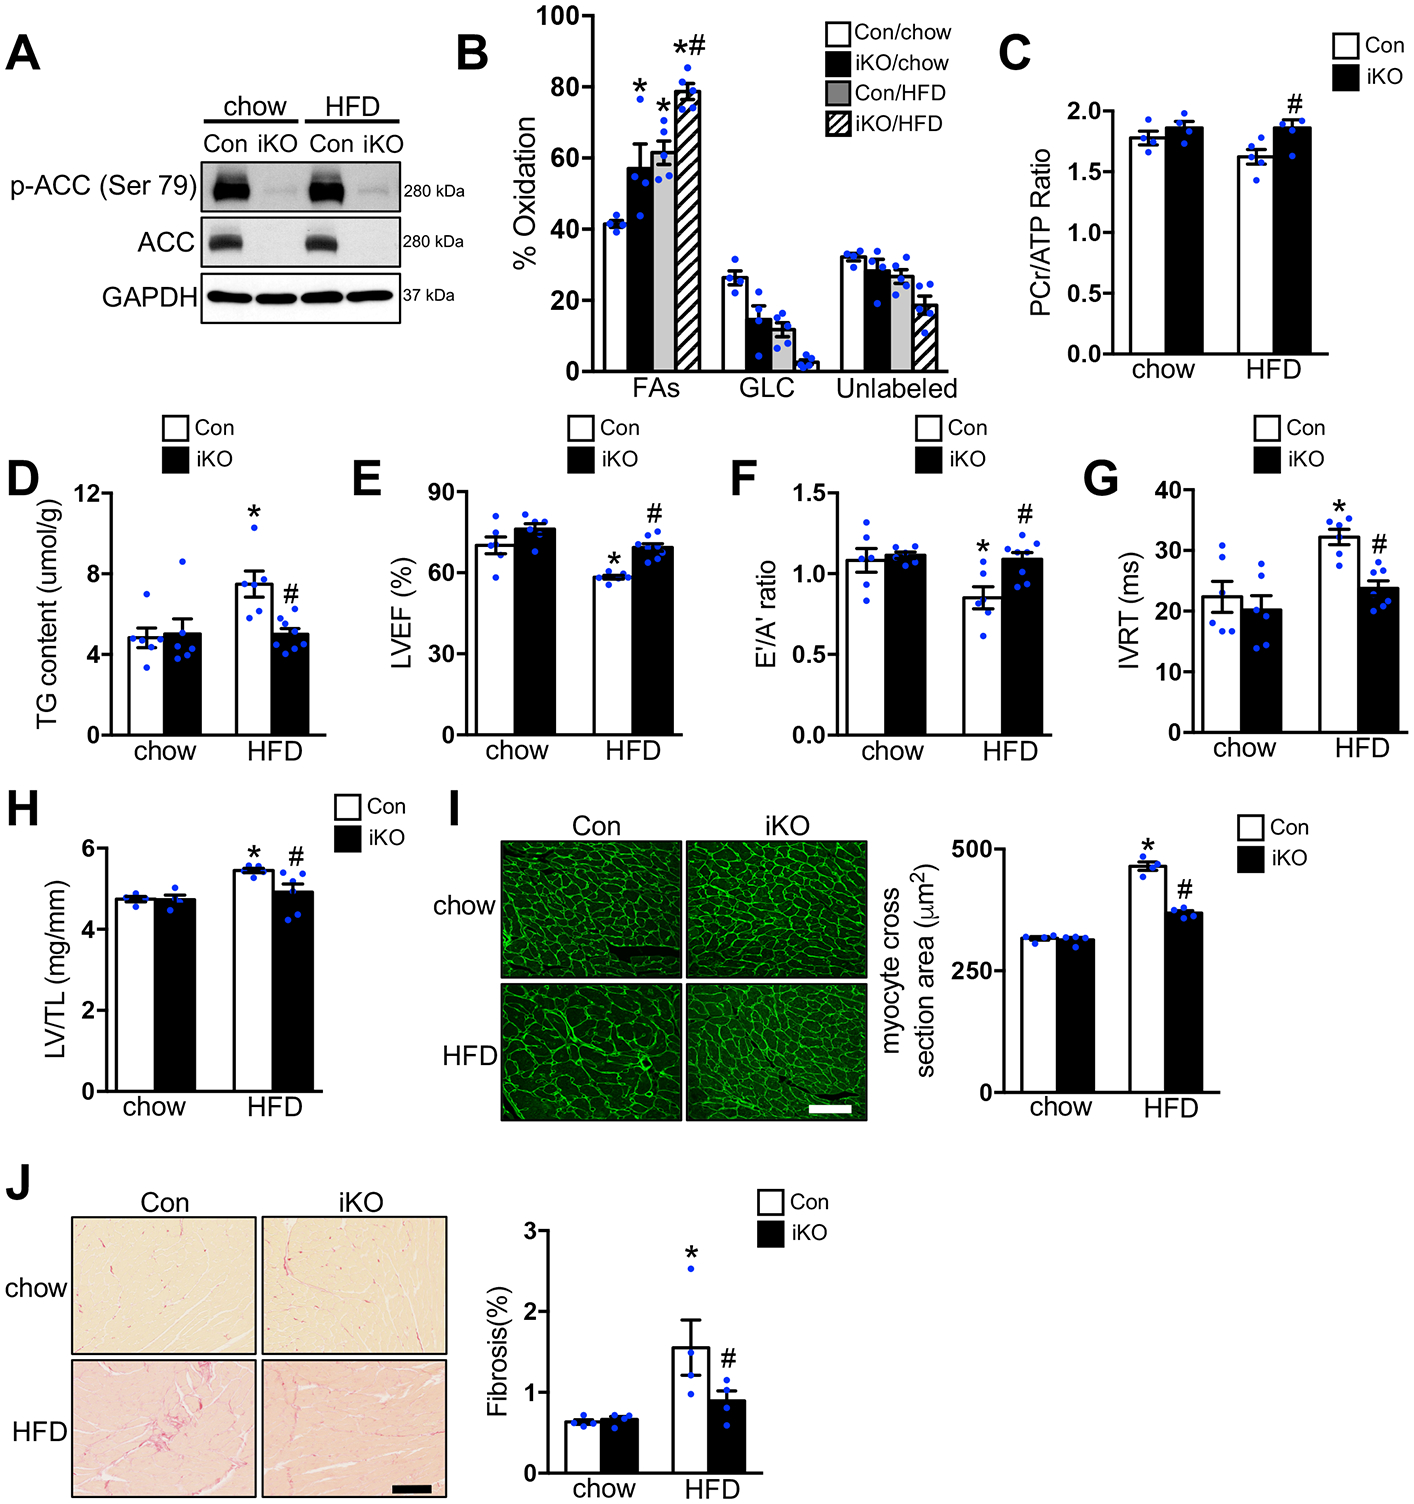
Methods: We induced high FAO in adult mouse hearts by cardiac-specific deletion of ACC2 using a tamoxifen-inducible model (ACC2 iKO). Control and ACC2 iKO mice were subjected to high-fat diet (HFD) feeding for 24 weeks to induce obesity. Cardiac function, mitochondria function, and mitophagy activity were examined.

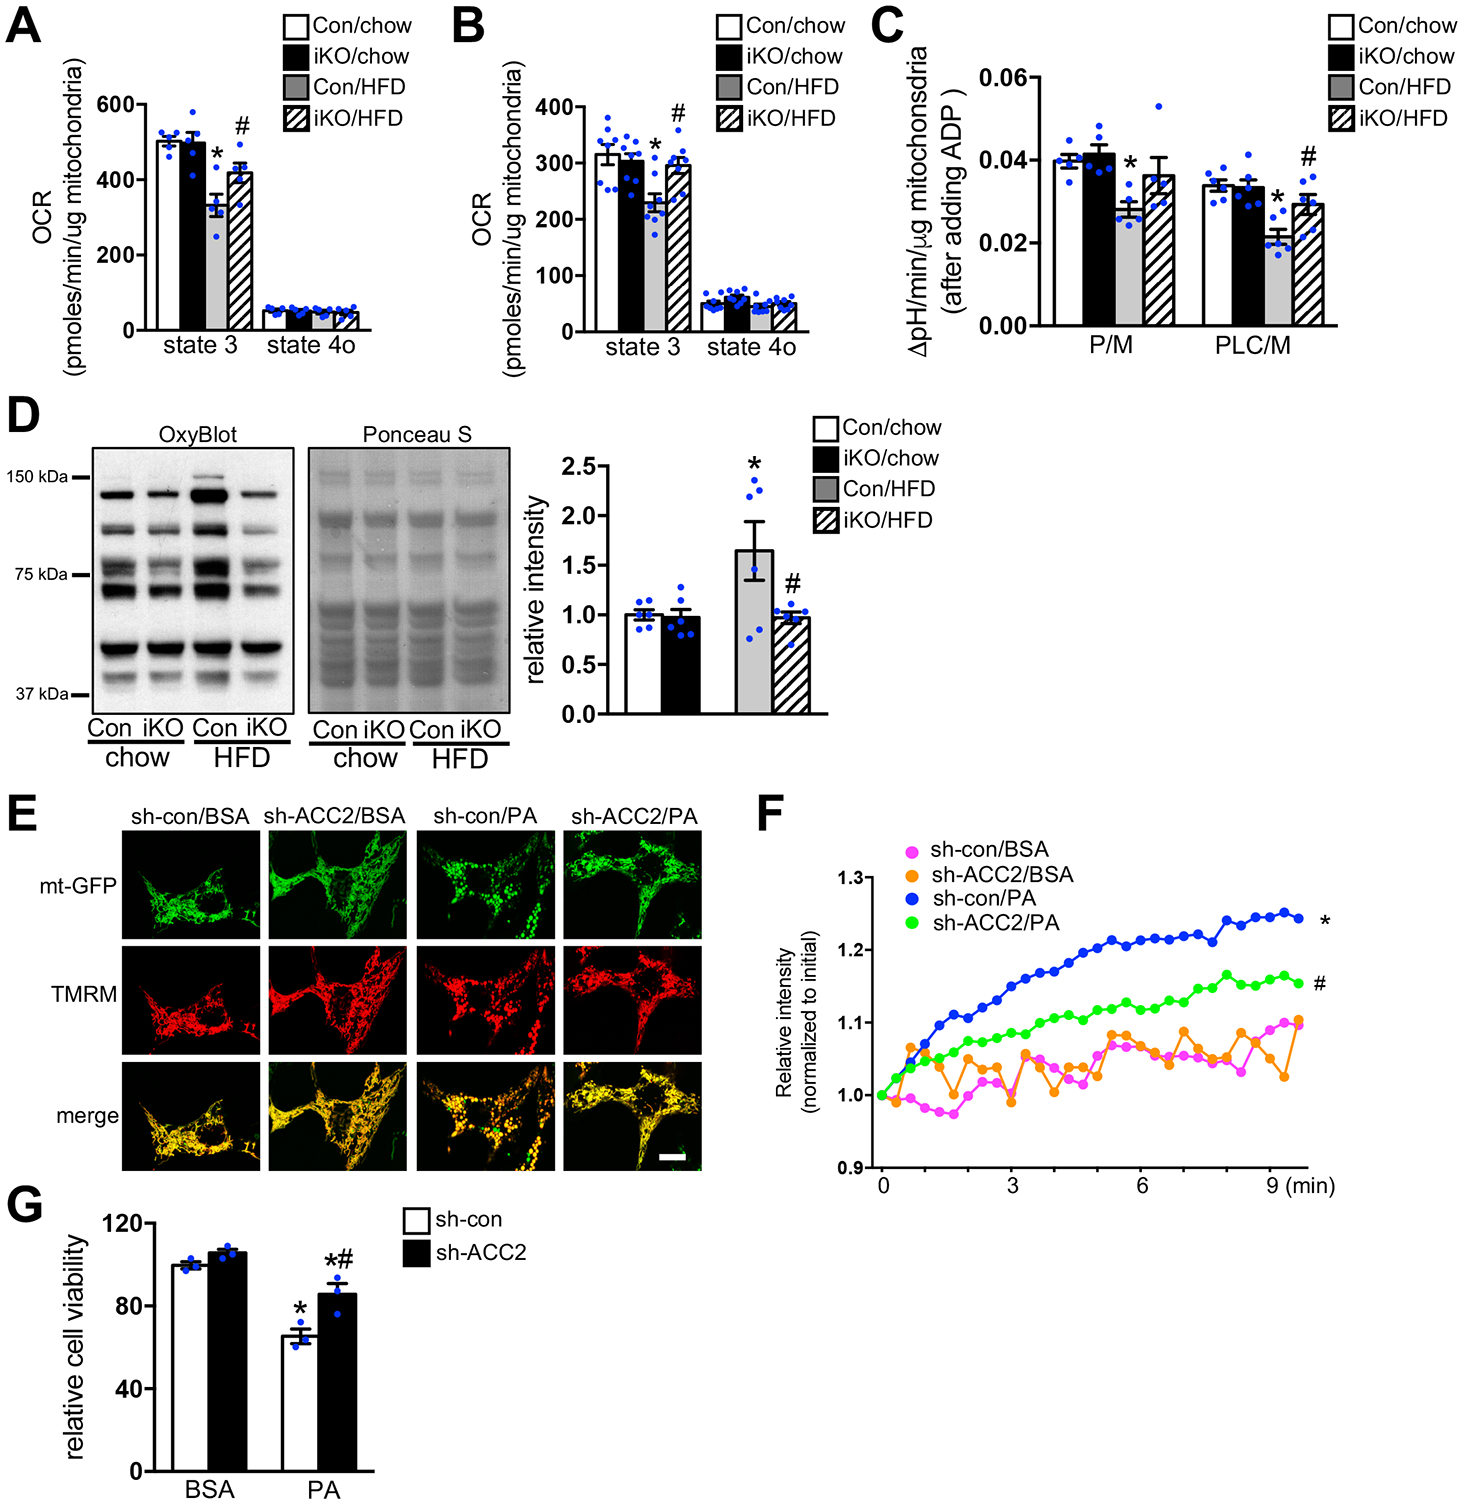
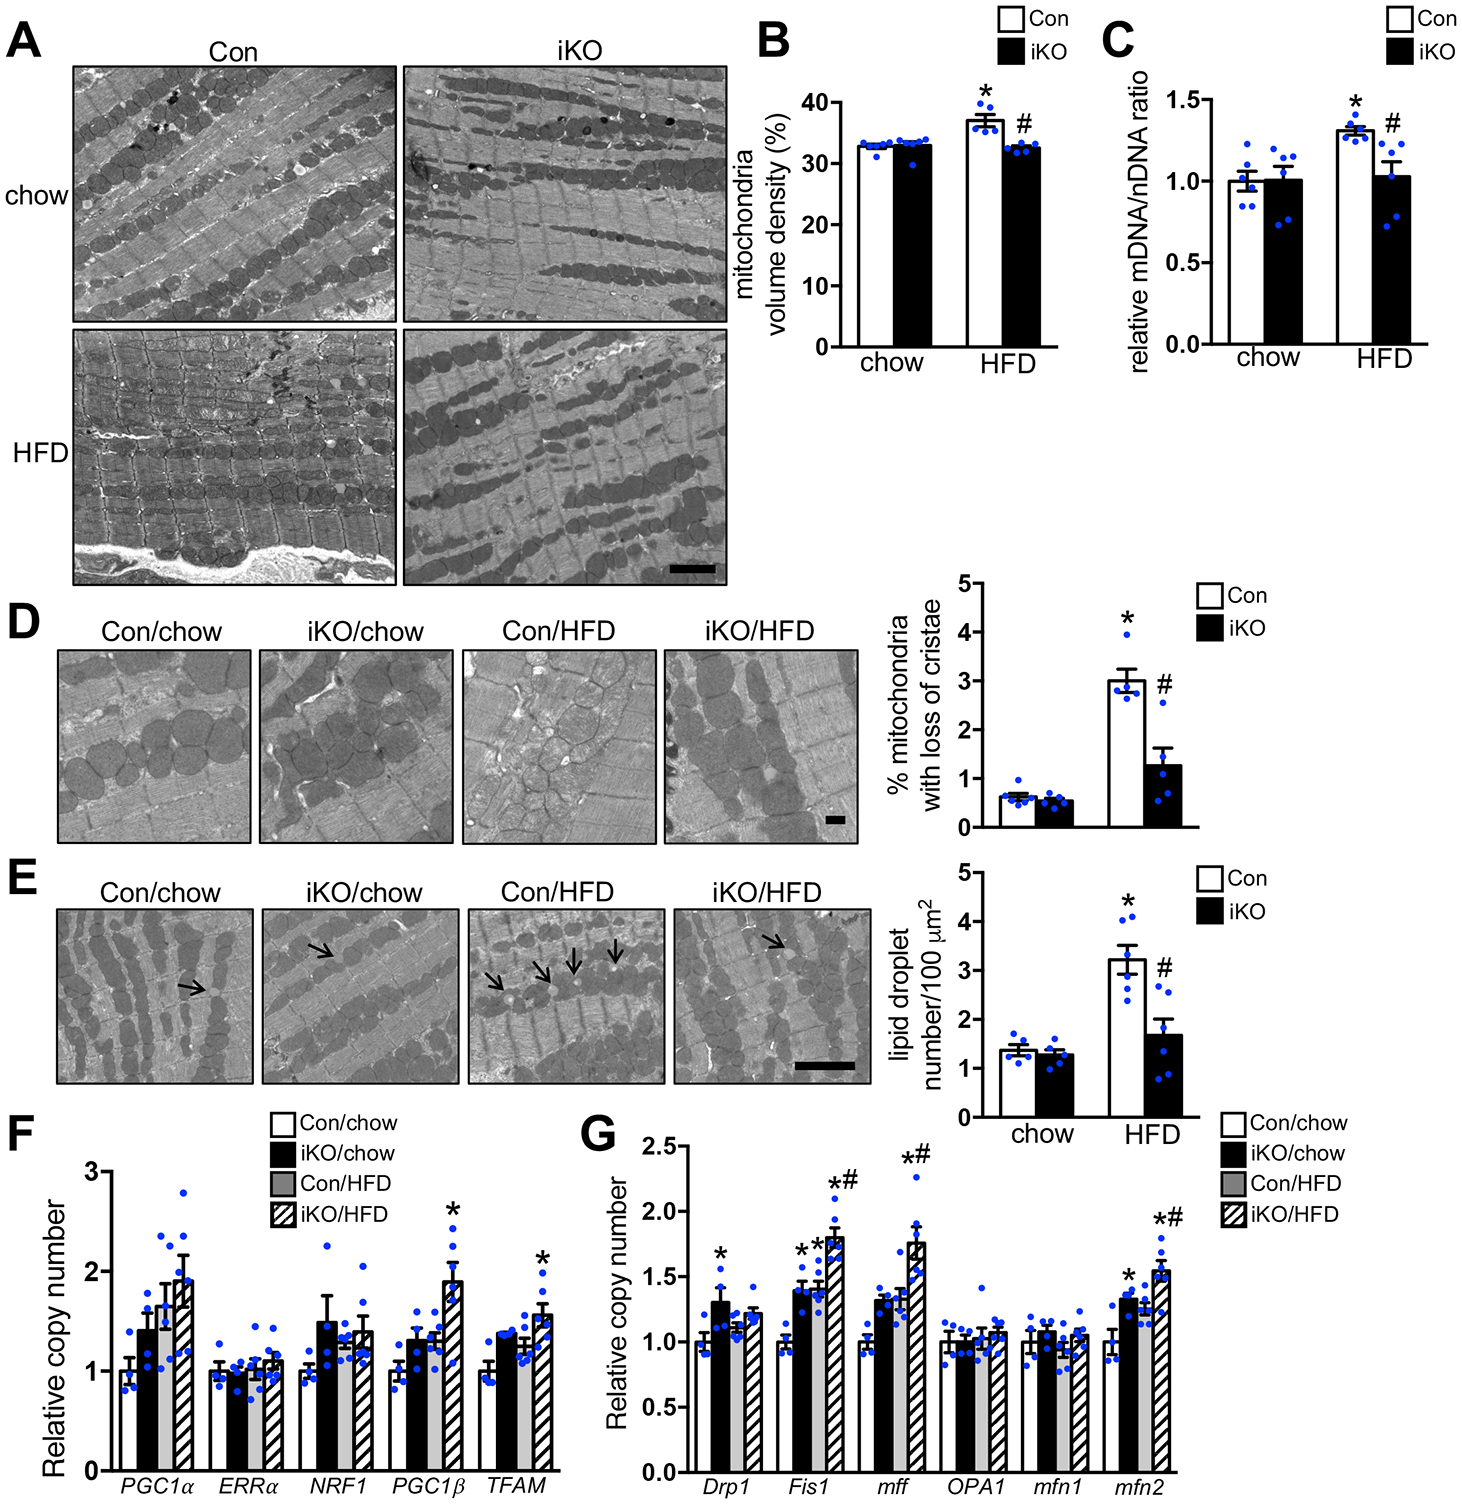
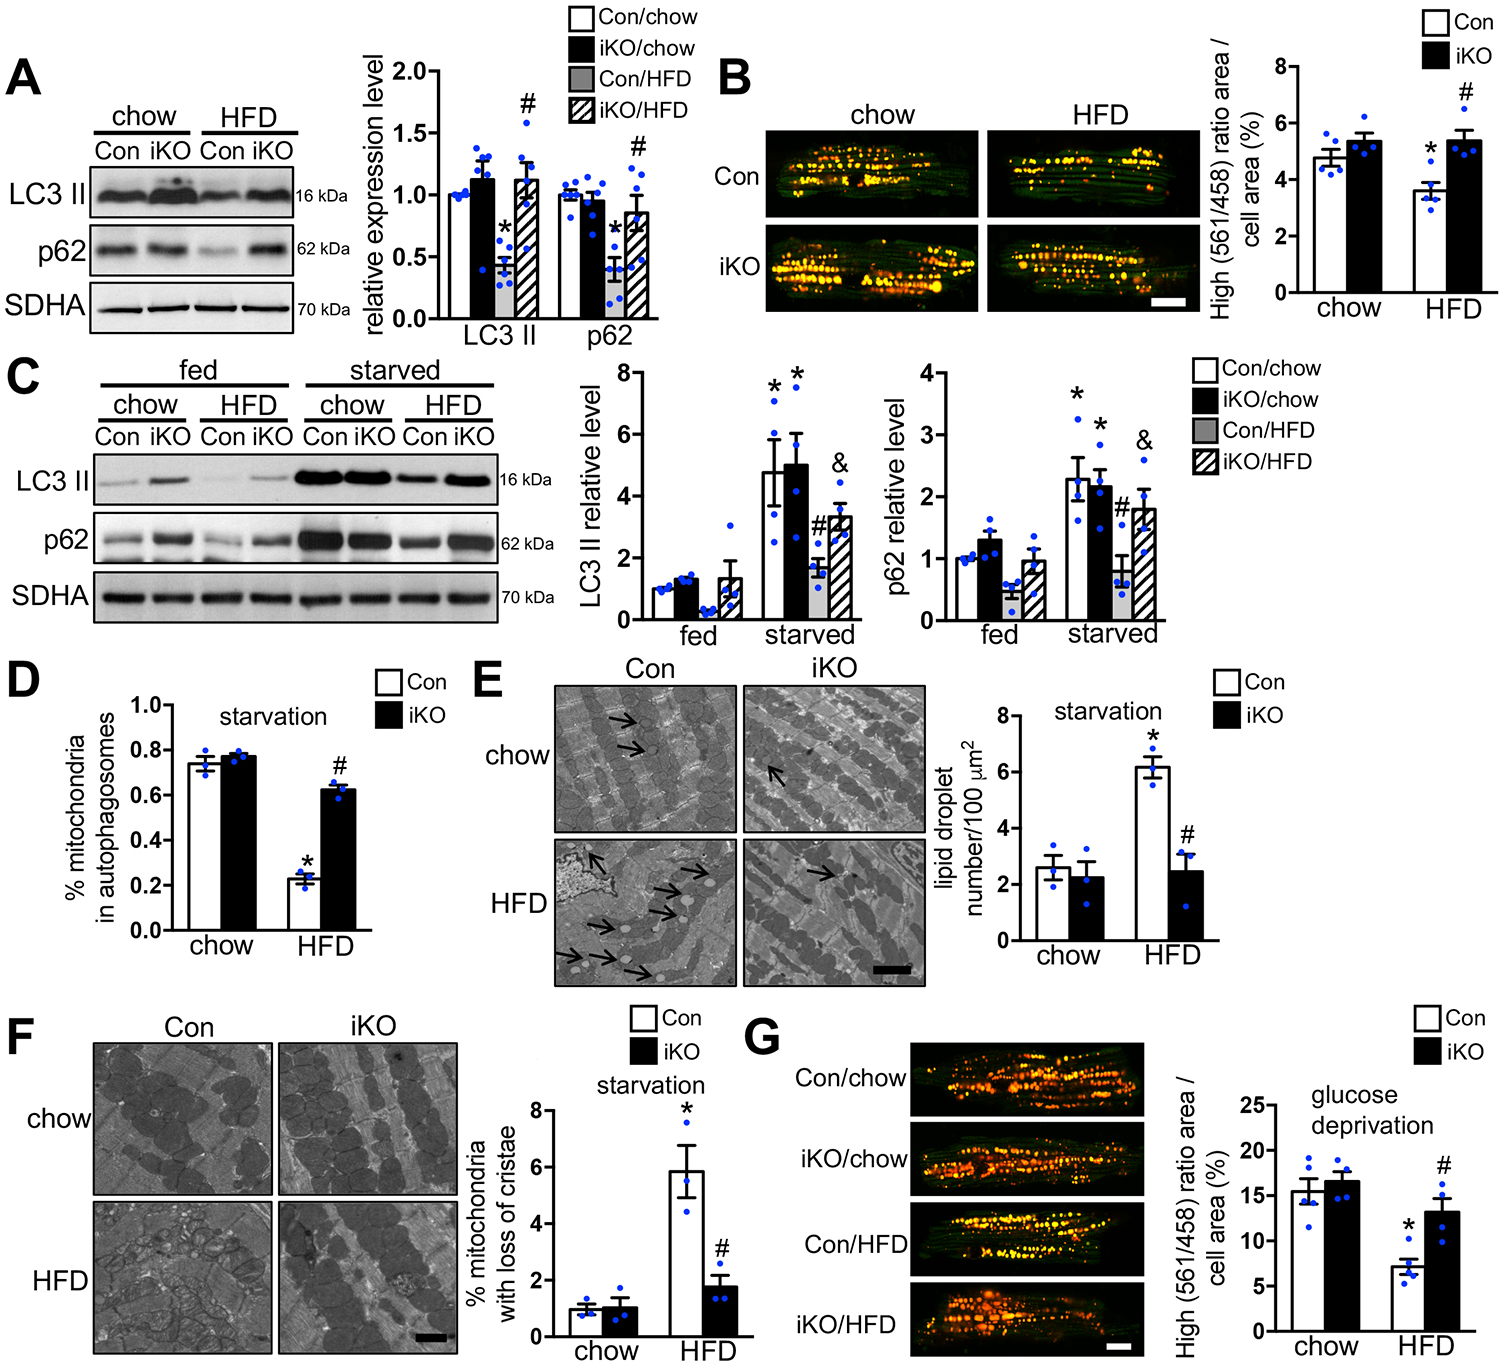
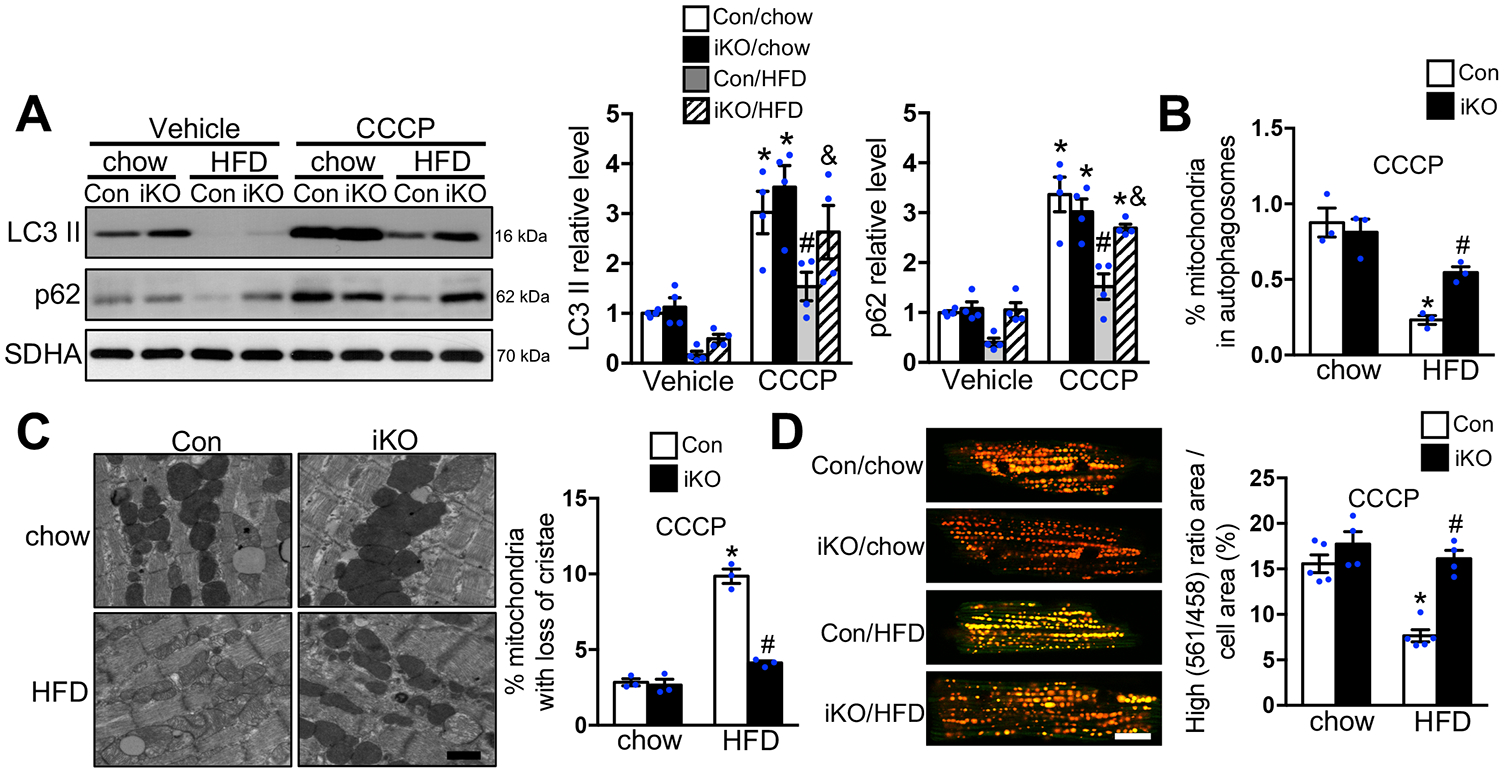
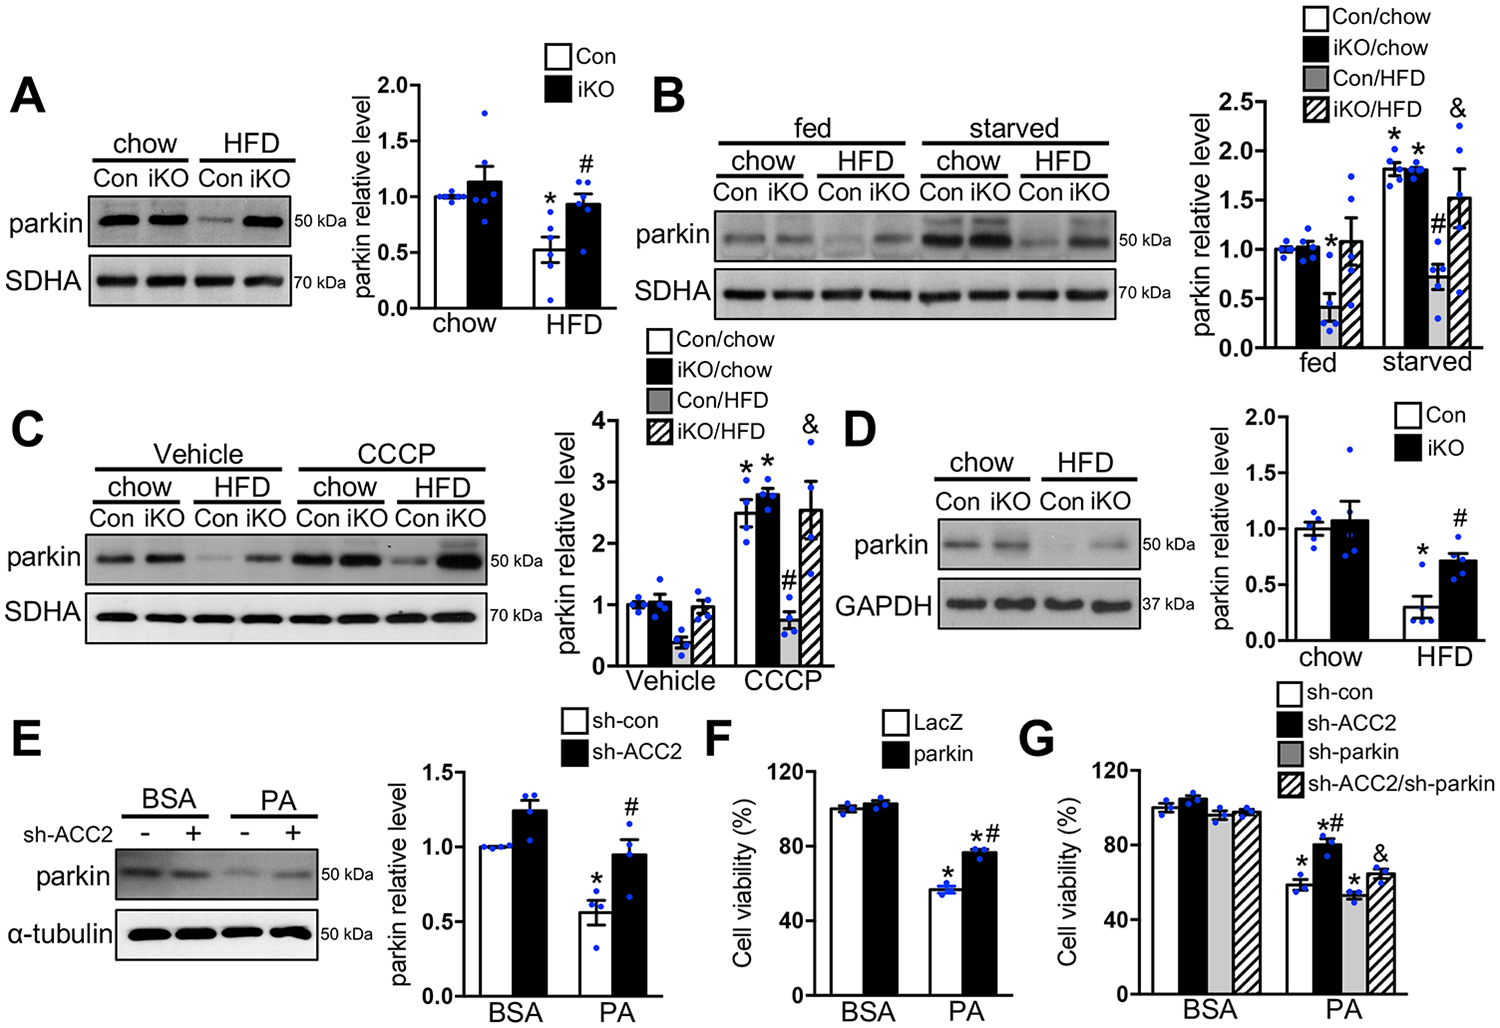
Results: Despite both control and ACC2 iKO mice exhibiting a similar obese phenotype, increasing FAO oxidation by deletion of ACC2 prevented HFD-induced cardiac dysfunction, pathological remodeling, and mitochondria dysfunction, as well. Similarly, increasing FAO by knockdown of ACC2 prevented palmitate-induced mitochondria dysfunction and cardiomyocyte death in vitro. Furthermore, HFD suppressed mitophagy activity and caused damaged mitochondria to accumulate in the heart, which was attenuated, in part, in the ACC2 iKO heart. Mechanistically, ACC2 iKO prevented HFD-induced downregulation of parkin. During stimulation for mitophagy, mitochondria-localized parkin was severely reduced in control HFD-fed mouse heart, which was restored, in part, in ACC2 iKO HFD-fed mice.

Conclusions: These data show that increasing cardiac FAO alone does not cause cardiac dysfunction, but protects against cardiomyopathy in chronically obese mice. The beneficial effect of enhancing cardiac FAO in HFD-induced obesity is mediated, in part, by the maintenance of mitochondria function through regulating parkin-mediated mitophagy. Our findings also suggest that targeting the parkin-dependent mitophagy pathway could be an effective strategy against the development of obesity-induced cardiomyopathy.

Keywords: cardiomyopathies; fatty acids; mitophagy; obesity.


Figures

Figure 1.
Figure 1.. Increasing FAO attenuated HFD induced cardiomyopathy
Con and ACC2 iKO mice were subjected to chow or HFD feeding for 24 weeks. (A) Representative immunoblots of heart lysates of p-ACC (Ser 79), ACC and GAPDH are shown. (B-C) Hearts were perfused with a buffer containing 13C labeled fatty acids, 13C labeled glucose, lactate, and insulin (mixed substrate). (B) Contribution of 13C labeled substrates to tricarboxylic acid (TCA) cycle was determined by 13C NMR spectroscopy in heart extracts. Relative contribution of fatty acids (FAs), glucose (GLC), and other unlabeled substrates (lactate, endogenous) (Unlabeled) is shown (*p<0.05 vs. Con/chow, #p<0.05 vs. Con/HFD, n=4–5). (C) Phosphocreatine to ATP (PCr/ATP) ratio was measured by 31P NMR spectroscopy in isolated perfused hearts (#p<0.05 vs. Con/HFD, n=4–5). (D) Cardiac triglyceride (TAG) content normalized to tissue weight (*p<0.05 vs. Con/chow, #p<0.05 vs. Con/HFD, n=6–8). (E-G) Left ventricular ejection fraction (LVEF), E’/A’ ratio and isovolumic relaxation time (IVRT) were measured by echocardiography (*p<0.05 vs. Con/chow, #p<0.05 vs. Con/HFD, n=6–8). (H) The left ventricle weight to tibia length (LV/TL) ratio of ACC2 iKO and Con mice under chow- or HFD-fed conditions (*p<0.05 vs. Con/chow, #p<0.05 vs. Con/HFD, n=4–6). (I) Representative wheat germ agglutinin (WGA) staining and quantification of cardiomyocyte cross-sectional area in indicated hearts after 24 weeks’ chow or HFD feeding (*p<0.05 vs. Con/chow, #p<0.05 vs. Con/HFD, n=4), Scale bar, 50μm. (J) Representative picric acid sirius red (PASR) staining and quantification of the percentage of fibrosis in indicated hearts after 24 weeks’ chow or HFD feeding (*p<0.05 vs. Con/chow, #p<0.05 vs. Con/HFD, n=4), Scale bar, 100μm.
Figure 2.
Figure 2.. Increasing FAO prevented HFD induced mitochondria dysfunction
(A-D) Mitochondria were isolated from Con and ACC2 iKO mouse hearts after 24 weeks’ chow or HFD feeding. (A) Pyruvate/malate (P/M) and (B) palmitoyl-L-carnitine/malate (PLC/M) driven respiration was measured by Seahorse XF24 Analyzer. State 3 (+ADP), State 4o (+oligomycin) (*p<0.05 vs. Con/chow, #p<0.05 vs. Con/HFD, n=5–8). (C) Absolute pH level change per minute after adding ADP in the presence of pyruvate/malate (P/M) or palmitoyl-L-carnitine/malate (PLC/M) as substrates (*p<0.05 vs. Con/chow, #p<0.05 vs. Con/HFD, n=5–6). (D) Representative immunoblot of mitochondria carbonylated proteins (left), the loading control stained with Ponceau S (middle) and statistical analysis of densitomeric measurement of carbonylated proteins to total proteins (right) are shown (*p<0.05 vs. Con/chow, #p<0.05 vs. Con/HFD, n=6). (E) NRCMs transfected with indicated adenovirus were incubated with DMEM containing BSA or 0.4 mM PA for 12 h. After the cells were stained with TMRM, mitochondria morphology and membrane potential were imaged using the confocal microscopy. Results are representative of three independent experiments. Scale bar, 10μm. (F) NRCMs transfected with indicated adenovirus for 72 h were incubated with DMEM containing BSA or 0.4 mM PA for 12 h. After incubation with MitoSOX red, mitochondria superoxide production was examined using the confocal microscopy (*p<0.05 vs. sh-con/BSA, #p<0.05 vs. sh-con/PA, 10–15 cells were analyzed per condition, n=4). (G) NRCMs transfected with indicated adenovirus for 72 h were incubated with DMEM containing BSA or 0.4 mM PA for 24 h. The cell viability was examined (*p<0.05 vs. sh-con/BSA, #p<0.05 vs. sh-con/PA, n=3).
Figure 3.
Figure 3.. Increasing FAO prevented the accumulation of damaged mitochondria in vivo
Con and ACC2 iKO mice were subjected to chow or HFD feeding for 24 weeks. (A) Representative images of heart sections from electron microcopy, Scale bar 2μm. (B) Mitochondria density was determined by the percentage of mitochondria area per field area. (*p<0.05 vs. Con/chow, #p<0.05 vs. Con/HFD, 10–15 random fields (10000x) per heart, n=5–6). (C) The ratio of mitochondrial DNA (mDNA) to nuclear DNA (nDNA) was determined by RT-PCR and represented as fold change compared with Con-chow, arbitrarily defined as 1. (*p<0.05 vs. Con/chow, #p<0.05 vs. Con/HFD, n=6). (D) (Left) Representative EM image showing disarrayed cristae and reduced electron density of the matrix in the mitochondria of Con-HFD heart but not ACC2 iKO-HFD heart. Scale bar 500nm. (Right) Quantification of the percent of damaged mitochondria. About 12–15 random fields with 1500–1800 mitochondria were analyzed per heart sample (*p<0.05 vs. Con/chow, #p<0.05 vs. Con/HFD, n=5–6). (E) (Left) Representative EM image showing lipid droplet accumulation in the Con-HFD heart but not in ACC2 iKO-HFD heart, arrows indicate lipid droplets. Scale bar 2μm. (Right) Quantification of the lipid droplet number (*p<0.05 vs. Con/chow, #p<0.05 vs. Con/HFD, 10–15 random fields (10000x) per heart sample, n=5–6). (F) qRT-PCR measurements of indicated genes involved in mitochondria biogenesis (*p<0.05 vs. Con/chow, n=4–6). (G) qRT-PCR measurements of indicated genes involved in mitochondria fusion and fission process (*p<0.05 vs. Con/chow, #p<0.05 vs. Con/HFD, n=4–6).
Figure 4.
Figure 4.. Increasing FAO attenuated HFD induced suppression of mitophagy
(A) Mitochondria isolated from Con and ACC2 iKO mouse hearts after 24 weeks’ chow or HFD feeding were subjected to immunoblot analysis. Representative immunoblots of LC3 II, p62 and SDHA in mitochondria homogenates (left) and statistical analyses of densitometric measurements of LC3 II and p62 (right) are shown (*p<0.05 vs. Con/chow, #p<0.05 vs. Con/HFD, n=6). (B) Cardiomyocytes were isolated from Con/mt-Keima and ACC2 iKO/mt-Keima bigenic mice after 24 weeks’ chow or HFD feeding. High (561/458) ratio area/total cell area was quantified as an index of mitophagy. About 25 to 35 cardiomyocytes per heart were analyzed (*p<0.05 vs. Con/chow, #p<0.05 vs. Con/HFD, n=4–5), Scale bar 15μm. (C-F) Con and ACC2 iKO mice after 24 weeks’ chow or HFD feeding were subjected to starvation for 24 hours. (C) Representative immunoblots of LC3 II, p62 and SDHA in mitochondria homogenates (left) and statistical analyses of densitomeric measurements of LC3 II and p62 (right) are shown (*p<0.05 vs. Con/chow, #p<0.05 vs. Con/chow/starvation, &p<0.05 vs. Con/HFD/starvation, n=4). (D) Quantification of the percentage of mitochondria sequestered in autophagosomes under starvation condition. About 15–20 random fields with 2000–2500 mitochondria were analyzed per heart sample (*p<0.05 vs. Con/chow, #p<0.05 vs. Con/HFD, n=3). (E) (Left) Representative EM image showing lipid droplet accumulation in the Con-HFD but not in ACC2 iKO-HFD heart under starvation condition, arrows indicate lipid droplets. Scale bar 2μm. (Right) Quantification of the lipid droplet number (*p<0.05 vs. Con/chow, #p<0.05 vs. Con/HFD, 10–15 random fields (10000x) per heart sample, n=3–4). (F) (Left) Representative EM image showing more disarrayed cristae and reduced electron density of the matrix in the Con-HFD than in ACC2 iKO-HFD heart under starvation condition. Scale bar 500nm. (Right) Quantification of damaged mitochondria percentage. About 15–20 random fields with 2000–2500 mitochondria were analyzed per heart sample (*p<0.05 vs. Con/chow, #p<0.05 vs. Con/HFD, n=3). (G) Cardiomyocytes isolated from Con/mt-Keima and ACC2 iKO/mt-Keima bigenic mice after 24 weeks’ chow or HFD feeding were incubated with no glucose DMEM for 4 hours. High (561/458) ratio area/total cell area was quantified as an index of mitophagy. About 25 to 35 cardiomyocytes per heart were analyzed (*p<0.05 vs. Con/chow, #p<0.05 vs. Con/HFD, n=4–5), Scale bar 15μm.
Figure 5.
Figure 5.. HFD suppressed CCCP induced mitophagy activation in Con but not in ACC2 iKO mice
(A-C) Con and ACC2 iKO mice after 24 weeks’ chow or HFD feeding were subjected to CCCP (5mg/kg) injection for 12 hours. (A) Representative immunoblots of LC3 II, p62 and SDHA in mitochondria homogenates (left) and statistical analyses of densitomeric measurements of LC3 II and p62 (right) are shown (*p<0.05 vs. Con/chow/Vehicle, #p<0.05 vs. Con/chow/CCCP, &p<0.05 vs. Con/HFD/CCCP, n=4). (B) Quantification of the percentage of mitochondria sequestered in autophagosomes with CCCP injection. About 15–20 random fields with 2000–2500 mitochondria were analyzed per heart sample (*p<0.05 vs. Con/chow, #p<0.05 vs. Con/HFD, n=3). (C) (Left) Representative EM image showing more disarrayed cristae and reduced electron density of the matrix in the Con-HFD than in ACC2 iKO-HFD heart with CCCP injection. Scale bar 500nm. (Right) Quantification of damaged mitochondria percentage. About 15–20 random fields with 2000–2500 mitochondria were analyzed per heart sample (*p<0.05 vs. Con/chow, #p<0.05 vs. Con/HFD, n=3). (D) Cardiomyocytes isolated from Con/mt-Keima and ACC2 iKO/mt-Keima bigenic mice after 24 weeks’ chow or HFD feeding were incubated with 2μM CCCP for 4 hours. High (561/458) ratio area/total cell area was quantified as an index of mitophagy. About 25 to 35 cardiomyocytes per heart were analyzed (*p<0.05 vs. Con/chow, #p<0.05 vs. Con/HFD, n=4–5), Scale bar 15μm.
Figure 6.
Figure 6.. Increasing FAO prevented lipid induced downregulation of parkin
(A-D) Con and ACC2 iKO mice were subjected to chow or HFD feeding for 24 weeks. (A) Representative immunoblots of parkin and SDHA in mitochondria homogenates (left) and statistical analysis of densitomeric measurement of parkin (right) is shown (*p<0.05 vs. Con/chow, #p<0.05 vs. Con/HFD, n=6). After 24-hour starvation (B) or 12-hour CCCP (5mg/kg) injection (C), mitochondria were isolated and subjected to immunoblot analysis. Representative immunoblots of parkin and SDHA in mitochondria homogenates (left) and statistical analysis of densitomeric measurement of parkin (right) is shown (*p<0.05 vs. Con/chow, #p<0.05 vs. Con/chow/starvation or CCCP, &p<0.05 vs. Con/HFD/starvation or CCCP, n=4–5). (D) Representative immunoblots of parkin and SDHA in total heart lysates (left) and statistical analysis of densitometric measurement of parkin (right) is shown (*p<0.05 vs. Con/chow, #p<0.05 vs. Con/HFD, n=5). (E) NRCMs transfected with indicated adenovirus for 72 hours were incubated with DMEM containing BSA or 0.4 mM PA for 12 hours. Representative immunoblots of parkin and SDHA in total cell lysates (left) and statistical analysis of densitometric measurement of parkin (right) is shown (*p<0.05 vs. sh-con/BSA, #p<0.05 vs. sh-con/PA, n=4). (F-G) NRCMs transfected with indicated adenovirus for 48 hours (F) or 72 hours (G) were incubated with DMEM containing BSA or 0.4 mM PA for 24 hours. The cell viability was examined (*p<0.05 vs. LacZ/BSA or sh-con/BSA, #p<0.05 vs. LacZ/PA or sh-con/PA, &p<0.05 vs. sh-ACC2/PA, n=3).

References

    1. Goldberg IJ, Trent CM and Schulze PC. Lipid metabolism and toxicity in the heart. Cell Metab. 2012;15:805–812. - PMC - PubMed
    1. Fukushima A and Lopaschuk GD. Cardiac fatty acid oxidation in heart failure associated with obesity and diabetes. Biochim Biophys Acta. 2016;1861:1525–1534. - PubMed
    1. Wende AR and Abel ED. Lipotoxicity in the heart. Biochim Biophys Acta. 2010;1801:311–319. - PMC - PubMed
    1. Yang J, Sambandam N, Han X, Gross RW, Courtois M, Kovacs A, Febbraio M, Finck BN and Kelly DP. CD36 deficiency rescues lipotoxic cardiomyopathy. Circ Res. 2007;100:1208–1217. - PubMed
    1. Listenberger LL, Han X, Lewis SE, Cases S, Farese RV Jr., Ory DS and Schaffer JE. Triglyceride accumulation protects against fatty acid-induced lipotoxicity. Proc Natl Acad Sci U S A. 2003;100:3077–3082. - PMC - PubMed

Publication types

MeSH terms