. 2020 Jun 29:9:e56615.
doi: 10.7554/eLife.56615.

A Tgfbr1/Snai1-dependent developmental module at the core of vertebrate axial elongation

Affiliations

A Tgfbr1/Snai1-dependent developmental module at the core of vertebrate axial elongation

André Dias et al. Elife. .

Abstract

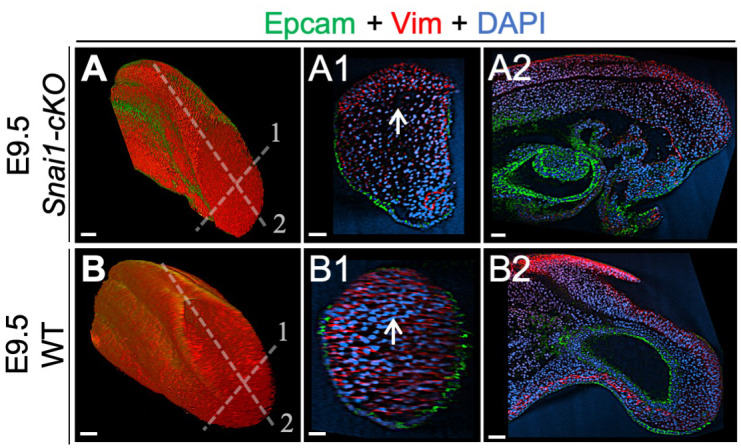
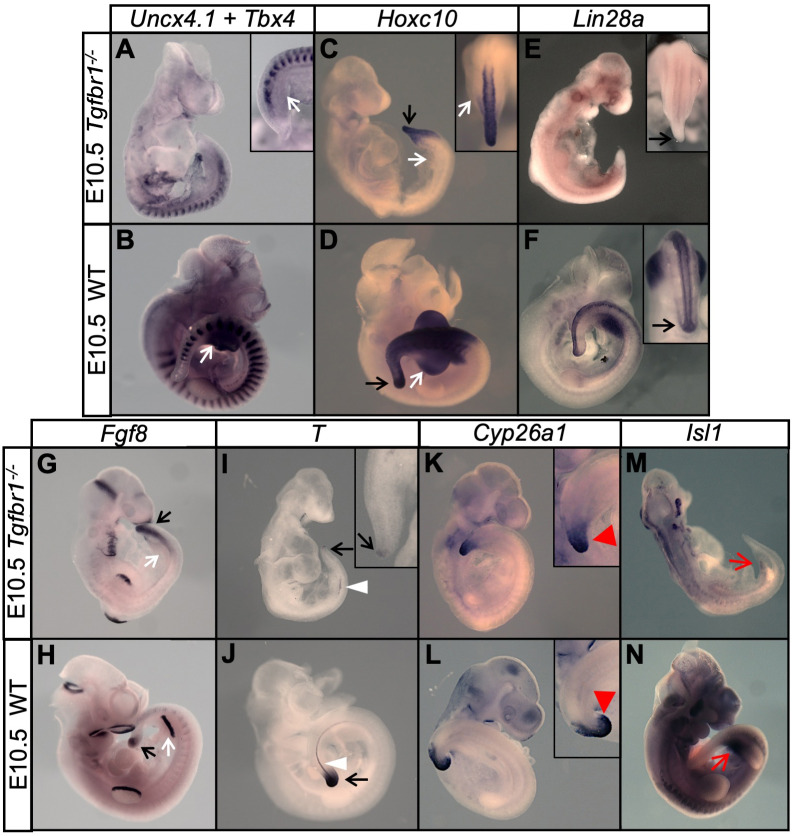
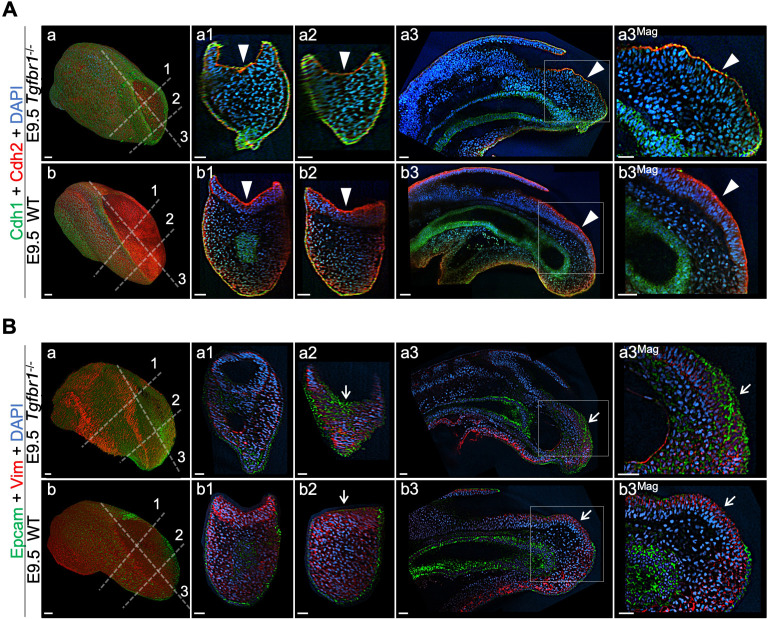
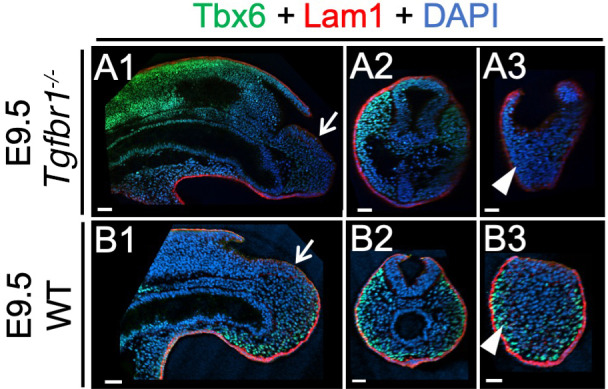
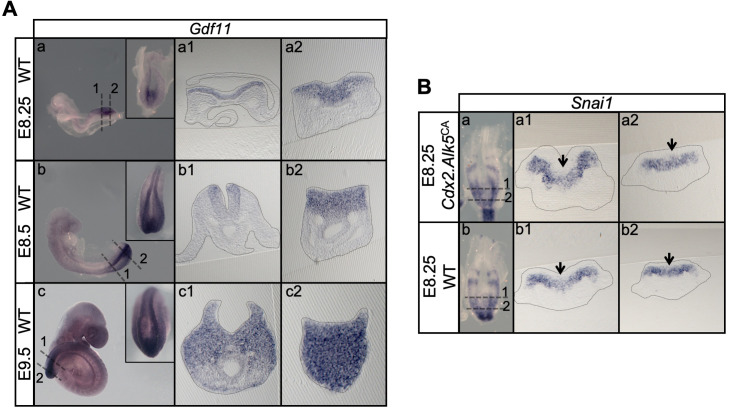
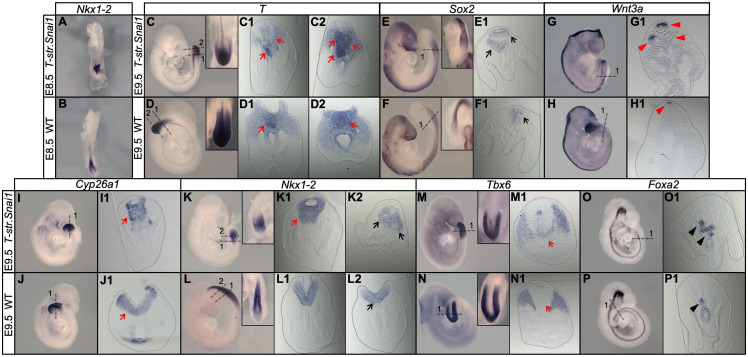
Formation of the vertebrate postcranial body axis follows two sequential but distinct phases. The first phase generates pre-sacral structures (the so-called primary body) through the activity of the primitive streak on axial progenitors within the epiblast. The embryo then switches to generate the secondary body (post-sacral structures), which depends on axial progenitors in the tail bud. Here we show that the mammalian tail bud is generated through an independent functional developmental module, concurrent but functionally different from that generating the primary body. This module is triggered by convergent Tgfbr1 and Snai1 activities that promote an incomplete epithelial to mesenchymal transition on a subset of epiblast axial progenitors. This EMT is functionally different from that coordinated by the primitive streak, as it does not lead to mesodermal differentiation but brings axial progenitors into a transitory state, keeping their progenitor activity to drive further axial body extension.

Keywords: EMT; axial elongation; axial progenitors; developmental biology; mouse; snai1; tail bud; tgfbr1.


Conflict of interest statement

AD, AL, FW, AN, AB, DS, GM, VW, MM No competing interests declared

Figures

Figure 1.
Figure 1.. Axial progenitors undergo an incomplete EMT during axial extension.
(A) PCA analysis of CLE scRNA-seq datasets from E8.0, E8.5 and E9.5 embryos. Dimension one represents developmental time, whereas dimension two shows differences in cell characteristics. Epiblast and mesodermal clusters are indicated. During primary body formation, epiblast clusters converge towards the mesodermal compartment. (B) Z-score heatmap gene expression analysis of selected genes and marker genes (highlighted in bold), obtained with the SC3 when pre-clustered E8.0 and E9.5 epiblast single-cells are forced to form two clusters. Downregulation of some epithelial-associated genes (e.g. Cdh1 and Epcam) together with upregulation of several mesenchymal-related genes (e.g. Cdh2, Vim, Zeb1) at E9.5 is observed. P-values are shown in Figure 1—source data 1. (C) Diagrams showing the regions used for the analysis in D and E. (D) Comparative heatmap representation of microarray gene expression between E8.5 node-streak border (NSB) and E10.5 chordoneural hinge (CNH). Epithelial and mesenchymal markers are indicated. (E) Comparative heatmap representation of RNA-seq gene expression in tail bud axial progenitors and a similar-staged reference total tail bud. Both (D and E) analysis indicated that loss of epithelial markers in tail bud axial progenitors is not complete (e.g. Tjp1 and Krt10). NT: Neural Tube; PM: Paraxial Mesoderm; LM: Lateral Mesoderm; GT: Gut; PS: Primitive Streak; * means Average.
Figure 1—figure supplement 1.
Figure 1—figure supplement 1.. SC3 clustering analysis enables the distinction of epiblast from early mesoderm cells.
Analysis of E8.0 single-cells (A), E9.5 single cells (B) and of pre-clustered E8.0 and E9.5 epiblast single-cells (C). For each study, the first PCA (Aa, Ba and Ca) suggested the existence of two clusters, which can be observed in orange and blue in the second PCA (Ab, Bb and Cb). Single-cell clustering consensus matrices (Ac, Bc and Cc) indicate resemblances between the two clusters of each analysis. SC3 marker gene expression (Ad and Bd) shows that differences between epiblast and mesoderm cells decrease from E8.0 to E9.5. P-values are shown in Figure 1—source data 1.
Figure 2.
Figure 2.. T and Sox2 double-positive cells acquire mesenchymal properties during primary body formation.
(A) RPKM (Reads per kilo base per million mapped reads) SPRING analysis of pre-clustered epiblast E8.0 and E9.5 single cells, organizes them in two clusters according to their developmental stage. T and Sox2 double-positive cells are shown circled in yellow. (B) Comparative gene expression analysis of epithelial (upper row) and mesenchymal (lower row) markers focused on T+ and Sox2+ epiblast cells suggest that they undergo an EMT between E8.0 and E9.5. The scRNA-seq values in RPKM used for this analysis are shown in Figure 2—source data 1.
Figure 2—figure supplement 1.
Figure 2—figure supplement 1.. Snai1 is expressed at low levels in regions known to contain axial progenitors.
(A) Analysis of clustered epiblast and mesoderm single-cells from E8.0, E8.5 and E9.5 wild type embryos, indicate that Snai1 is expressed in early mesoderm cells and also in some cells of the caudal lateral epiblast (CLE). (B) During primary body formation, according to Wymeersch et al., 2019 datasets, Snai1 is expressed in the primitive streak (PS) and its expression in axial progenitor regions [node-streak border (NSB) and chordoneural hinge (CNH)] increases during tail bud formation.
Figure 2—figure supplement 2.
Figure 2—figure supplement 2.. Tgfbr1 is expressed in regions known to contain axial progenitors.
(A) Tgfbr1 expression is present in several clustered caudal lateral epiblast (CLE) and early mesoderm single cells. (B) According to Wymeersch et al., 2019 microarray datasets, the transition from primary to secondary body formation entails an increase of Tgfbr1 expression in the chordoneural hinge (CNH) when compared to the primitive streak (PS) and node-streak border (NSB) regions.
Figure 3.
Figure 3.. Axial extension is disrupted, at the level of the trunk-to-tail transition, in the absence of Snai1.
(A) Wholemount in situ hybridization with the indicated probes in E9.5 wild type (WT) and Snai1-cKO embryos. Axial progenitor-related markers Fgf8, Nkx1-2, Cyp26a1 were abnormally restricted to the epithelium of the caudal protuberance of Snai1-cKO embryos (red arrows) and T and Wnt3a-stained embryos were substantially downregulated in the central component of the bulge mesenchyme. Tbx6 expression was observed in the epithelial-like component of the bulge (black arrowhead) in addition to its mesenchymal expression. Msgn1 was present in the presomitic mesoderm and in the mesenchymal component of the bulge. The white arrows in the Noto-stained embryos indicate the bifurcated or inverted notochord growth in the absence of Snai1. Sox2 was absent from the bulge region (white arrowhead) of Snai1-cKO embryos. Black arrows in the Foxa2 labelled embryos highlight the abnormal localization of hindgut endoderm in Snai1-cKO embryos. (B) 3D reconstructions of E9.5 Snai1-cKO and WT posterior/caudal structures: neural tube (green), open epiblast (light green), presomitic mesoderm (light blue), somites (dark blue), notochord (red) and endoderm (yellow). At this stage, the ectopic bulge of Snai1-cKO embryos forms a structure that resembles an abnormally extended open epiblast in which the closing neural plate fails to extend caudally. The notochord often bifurcates, with one end following the posterior gut endoderm that is detached from the rest of the embryonic structures (black arrow).
Figure 4.
Figure 4.. Snai1-cKO embryos develop fairly-well organized primary body structures but are unable to form a tail bud.
(A) Wholemount in situ hybridization with the indicated markers in wild type (WT) and Snai1-cKO mutant embryos at E9.5 and E10.5. The insets show close ups of the caudal region. Transverse sections at the levels indicated in the whole-mount embryo are also shown. Cdx2 and Hoxc10 expression in Snai1-cKO embryos indicate that the bulge is the equivalent of the tail bud in similar stage wild type embryos. The black arrows in the Pax2-stained embryos indicate the presence of intermediate mesoderm in both Snai1-cKO and wild type embryos. At E9.5, Tbx18 expression and the combined in situ hybridization for Uncx4.1/Tbx4 and Uncx4.1/Pitx1, indicate the presence of fairly-well organized trunk somites and hindlimb buds (white arrowheads) in Snai1-cKO embryos, which is also highlighted in some mutant embryos, that survived at E10.5, with Tbx5 and Tbx4 expression. White arrows indicate that Sox2 is still downregulated in the bulge of E10.5 Snai1-cKO embryos, in comparison to the tail bud of wild type littermates. (B) 3D reconstructions of caudal structures of E10.5 wild type and Snai1-cKO embryos. Wild type embryos have a closed neural tube (in green), dorsal to the presomitic mesoderm (in blue) and somites (in dark blue). In contrast, Snai1-cKO embryos have a bifurcated notochord (red), detached endoderm (yellow) and the bulge resembles a still open caudal epiblast (in green). Somites are shown in dark blue and extra mesoderm in Snai1-cKO embryos is highlighted in cyan. Note that the structures posterior to the last somites in Snai1-cKO embryos did not extend further than at E9.5, leading to a shorter axis.
Figure 5.
Figure 5.. Snai1-cKO embryos develop an ectopic bulge associated with the PS.
(A) Wholemount in situ hybridization with the indicated markers in wild type (WT) and Snai1-cKO mutant embryos at E8.5. The inlets show close ups of the caudal region. Transverse sections at the levels indicated in the whole-mount embryo are also shown. In the absence of Snai1, a protuberance (black arrowheads) starts to arise from the PS around E8.25. This ectopic bulge is positive for Lfng and Nkx1-2, but not for Sox2. Lfng and Nkx1-2 expression are restricted to the epithelial-part of the bulge. Msng1 was only found in the mesenchymal component. (B) 3D reconstruction of E8.5 Snai1-cKO and wild type posterior/caudal structures: neural tube (green), open epiblast (light green), presomitic mesoderm (light blue), somites (dark blue), notochord (red) and endoderm (yellow). At E8.5, Snai1-cKO embryos contain an ectopic bulge (black arrowhead) associated with the PS and the hindgut endoderm shows abnormal development.
Figure 5—figure supplement 1.
Figure 5—figure supplement 1.. Lfng dynamic activity in the bulge of Snai1-cKO embryos.
Snai1-cKO embryos display variable ectopic Lfng expression in the bulge region (arrow).
Figure 6.
Figure 6.. 3D two-photon live imaging of LuVeLu reporter expression in E8.5 Snai1-cKO and control embryos.
(A) Snapshot at time-point = 0 of the LuVeLu reporter, in Snai1-cKO (from Figure 6—video 1) and control (from Figure 6—video 2) E8.5 embryos. In addition to the normal LuVeLu signal in the presomitic mesoderm, Snai1-cKO embryos display ectopic LuVeLu expression in the epithelial-like component of the bulge. (B) Snapshots from Figure 6—video 1 and Figure 6—video 2, of time-lapsed two-photon live imaging of the LuVeLu reporter in E8.5 Snai1-cKO and control embryos at the indicated time points. Snai1-cKO embryos have ectopic LuVeLu expression in the epithelial-like component of the bulge in addition to the normal LuVeLu signal in the presomitic mesoderm. (C) Quantitative analysis of LuVeLu cycling activity in the bulge of Snai1-cKO embryos. Intensity mean was calculated in the region highlighted by the blue spot (Ca) and plotted for each imaged time-point (8.5 min interval; Ca’). The existence of two-peaks (at t = 1.3 hr and t = 3.6 hr of the time-lapse) and a substantial decrease between them, suggests cycling activity in the bulge of the mutant embryo. These waves occur from anterior to posterior, once the higher intensity mean peak observed in the posterior part of the bulge (red spot; Cb) occurred later than the higher peak measured in the anterior part of the bulge (green spot; Cb). The higher measured wave peak in the posterior part of the bulge (red spot; Cb) coincides with the time-point corresponding to the higher intensity mean peak detected in the newly formed somite (yellow spot; Cc). No signs of LuVeLu cycling activity were observed near the PS (purple spot; Cd) in LuVeLu+/0 control embryos. Scale bar: 50 μm.
Figure 7.
Figure 7.. T and Sox2 double-positive cells are restricted to the epiblast of Snai1-cKO embryos.
Wholemount immunostaining for T (green), Sox2 (red) and DAPI (blue) in E9.5 (A and B) series) and E10.5 (C and D) series) Snai1-cKO and wild type (WT) embryos. Transversal and sagittal optical sections together with magnifications (Mag.) are also shown. In E9.5 wild type embryos, T+/Sox2+ cells are found in the mesenchyme below the epiblast (white arrows). Conversely, in similar staged Snai1-cKO embryos, they are restricted to the epithelial component of the bulge. At E10.5 most of the bulge’s epithelium, of Snai1-cKO embryos, closed into a tube that is mostly negative for Sox2 and positive for T. In contrast, T and Sox2 double-positive cells are still found in mesenchymal compartments of the tail bud of wild type embryos. Magnifications are shown without DAPI. Scale bars correspond to 50 μm.
Figure 8.
Figure 8.. Axial progenitors acquire mesenchymal properties in the absence of Snai1.
Wholemount immunostainings for Cdh1 (green) plus Cdh2 (red) (A) and Tbx6 (green) plus Lam1 (red) (B), in E8.5 and E9.5 Snai1-cKO and wild type (WT) embryos. Transversal and sagittal optical sections in the indicated regions are also shown together with magnifications (Mag.). The transition from Cdh1 to Cdh2 still occurs in the epithelial component of the bulge in the absence of Snai1 (white arrows). This region of Snai1-cKO embryos contains ectopic Tbx6-positive cells (yellow arrow) and a severely disorganized Lam1 expression (white arrowheads). Yellow arrowheads highlight posterior gut bifurcation in E9.5 Snai1-cKO embryos. Scale bars: 50 μm. DAPI staining in blue.
Figure 8—figure supplement 1.
Figure 8—figure supplement 1.. Wholemount immunohistochemistry in wild type and Snai1-cKO embryos.
Immunostaining of E9.5 Snai1-cKO (A series) and wild type (WT) (B series) embryos for Epcam (green) and Vim (red). Transversal and sagittal optical sections are shown. Vim, and not Epcam, is highly expressed in the axial progenitor regions of both WT and Snai1-cKO embryos. Scale bars: 50 μm. DAPI staining in blue.
Figure 9.
Figure 9.. Tgfbr1 mutant embryos are unable to undergo the trunk-to-tail transition.
(A–N) Wholemount in situ hybridization with the indicated markers in E10.5 Tgfbr1-/- and wild type (WT) embryos. Absent hindlimb bud formation in Tgfbr1 mutants is highlighted by absent Tbx4, Fgf8 and Hoxc10 expression (A–D, G and H) in the relevant area (white arrows). Tail bud formation is deficient in Tgfbr1 mutant embryos (black arrows). Lin28a and T are drastically downregulated in the tail of Tgfbr1 mutant embryos (black arrows in E and I), suggesting that these mutants are caudally truncated at this stage. The white arrowheads indicate the notochord, which did not continue its development to more caudal regions in Tgfbr1 mutant embryos. Red arrowheads highlight the abnormal Cyp26a1 expression in the Tgfbr1-/- tail. Red arrows in M) and N) indicate absent Isl1 expression in the prospective developing cloaca of Tgfbr1 mutant embryos.
Figure 10.
Figure 10.. Tail bud EMT is compromised in the absence of Tgfbr1.
Wholemount immunostaining for Cdh1 (green) plus Cdh2 (red) (A) and Epcam (green) plus Vim (red) (B) in Tgfbr1-/- and wild type (WT) embryos. Transversal and sagittal optical sections through the indicated regions are also shown together with magnifications (Mag.). White arrowheads indicate incomplete Cdh1 to Cdh2 switch in Tgfbr1 mutants. White arrows show persistent Epcam and deficient Vim expression in the epithelium of the mutant embryos. DAPI staining is shown in blue. Scale bars: 50 μm.
Figure 10—figure supplement 1.
Figure 10—figure supplement 1.. Whole mount immunohistochemistry in wild type and Tgfbr1 embryos.
Wholemount immunostaining for Tbx6 (green), Lam1 (red) and DAPI (blue) of E9.5 wild type (B series) and Tgfbr1 mutant embryos (A series). Sagittal and transversal optical sections are also shown, highlighting the downregulation of Tbx6 in more posterior tissues (white arrowheads) and normal laminin patterns in the epiblast (white arrows) of Tgfbr1 mutant embryos. Scale bars: 50 μm.
Figure 11.
Figure 11.. Snai1 is not a downstream target of Tgfbr1.
(A) Wholemount in situ hybridization for Gdf11 in E8.25, E8.5 and E9.5 wild type (WT) embryos. Transversal sections through the areas indicated in the whole mounted embryo highlight the increase of Gdf11 in caudal tissues during primary body formation. (B) Overexpression of a constitutively active form of Tgfbr1 (transgenic Cdx2-Alk5CA) does not result in increased Snai1 expression as shown in transversal sections of the areas indicated in the wholemount embryo. Arrows indicate the position of the PS, where low levels of Snai1 expression can be observed both in the WT (Bb) and transgenic embryos (Ba).
Figure 12.
Figure 12.. Extended Snai1 expression in the PS is sufficient to mobilize axial progenitors from the epiblast.
(A–R) Wholemount in situ hybridization for the indicated markers in wild type (WT) and transgenic T-str-Snai1 embryos. Nkx1-2 expression in the transgenic embryos (A) indicates an already deformed caudal epiblast at E8.5. At E9.5 T-str-Snai1 embryos are caudally truncated and display a complete premature closure of their caudal epiblast. Red arrows in C2, I1 and K1 highlight the ventrally extended T, Cyp26a1 and Nkx1-2 expression, indicating ectopic mobilization of axial progenitors. Black arrows in E1 and K2 show ventrally located ectopic neural tubes in T-str-Snai1 embryos. Red arrows in C1 and M1 indicate T, Tbx6-positive cells intermingled with the ectopic neural tubes. The black arrowheads in O1 and P1 indicate the floor plate, showing conserved ventral patterning in ectopic neural tubes of T-str.Snai1 embryos. The red arrowheads in G1 show Wnt3a expression in the dorsal region of the ectopic neural tubes.

References

    1. Acloque H, Adams MS, Fishwick K, Bronner-Fraser M, Nieto MA. Epithelial-mesenchymal transitions: the importance of changing cell state in development and disease. Journal of Clinical Investigation. 2009;119:1438–1449. doi: 10.1172/JCI38019. - DOI - PMC - PubMed
    1. Aires R, Jurberg AD, Leal F, Nóvoa A, Cohn MJ, Mallo M. Oct4 is a key regulator of vertebrate trunk length diversity. Developmental Cell. 2016;38:262–274. doi: 10.1016/j.devcel.2016.06.021. - DOI - PubMed
    1. Aires R, Dias A, Mallo M. Deconstructing the molecular mechanisms shaping the vertebrate body plan. Current Opinion in Cell Biology. 2018;55:81–86. doi: 10.1016/j.ceb.2018.05.009. - DOI - PubMed
    1. Aires R, de Lemos L, Nóvoa A, Jurberg AD, Mascrez B, Duboule D, Mallo M. Tail bud progenitor activity relies on a network comprising Gdf11, Lin28, and Hox13 genes. Developmental Cell. 2019;48:383–395. doi: 10.1016/j.devcel.2018.12.004. - DOI - PubMed
    1. Anderson MJ, Naiche LA, Wilson CP, Elder C, Swing DA, Lewandoski M. TCreERT2, a transgenic mouse line for temporal control of Cre-mediated recombination in lineages emerging from the primitive streak or tail bud. PLOS ONE. 2013;8:e62479. doi: 10.1371/journal.pone.0062479. - DOI - PMC - PubMed

Publication types

MeSH terms

Substances