. 2020;14(1-2):101-121.
doi: 10.3233/ISB-200474.

Dynamical modeling of pro- and anti-inflammatory cytokines in the early stage of septic shock

Affiliations

Dynamical modeling of pro- and anti-inflammatory cytokines in the early stage of septic shock

J Tallon et al. In Silico Biol. 2020.

Abstract

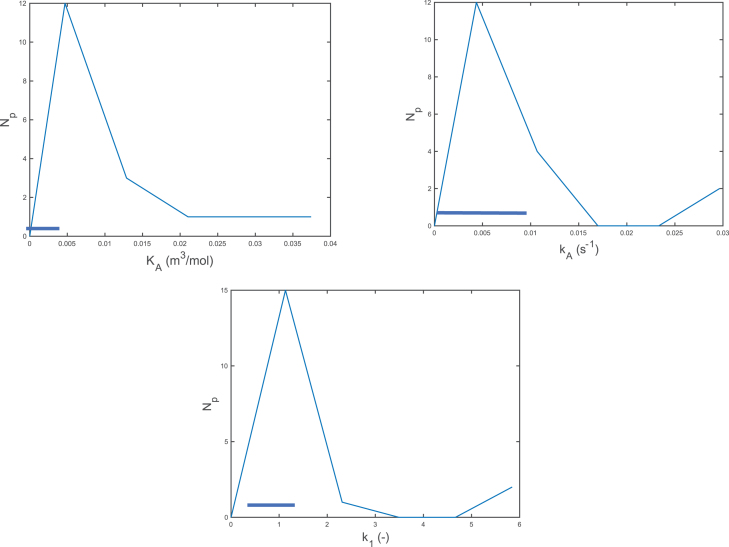
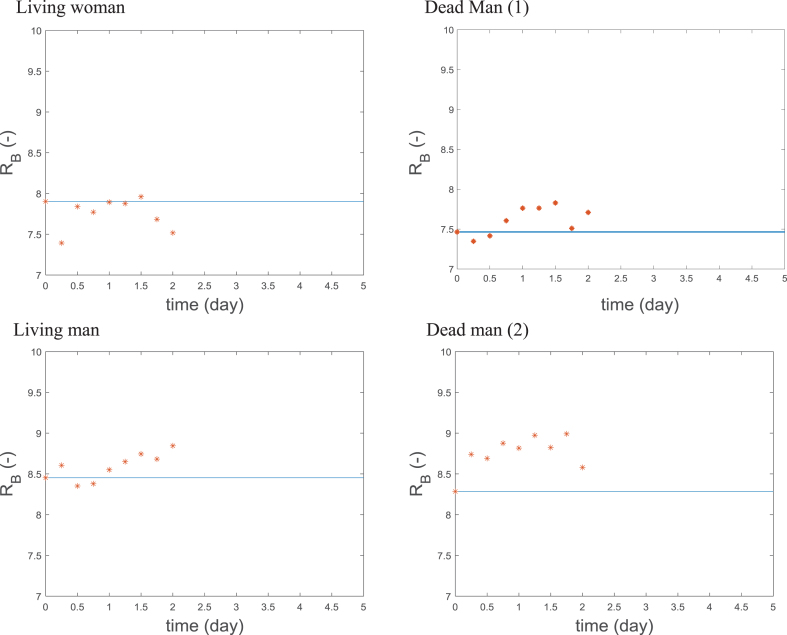
A dynamical model of the pathophysiological behaviors of IL18 and IL10 cytokines with their receptors is tested against data for the case of early sepsis. The proposed approach considers the surroundings (organs and bone marrow) and the different subsystems (cells and cyctokines). The interactions between blood cells, cytokines and the surroundings are described via mass balances. Cytokines are adsorbed onto associated receptors at the cell surface. The adsorption is described by the Langmuir model and gives rise to the production of more cytokines and associated receptors inside the cell. The quantities of pro and anti-inflammatory cytokines present in the body are combined to give global information via an inflammation level function which describes the patient's state. Data for parameter estimation comes from the Sepsis 48 H database. Comparisons between patient data and simulations are presented and are in good agreement. For the IL18/IL10 cytokine pair, 5 key parameters have been found. They are linked to pro-inflammatory IL18 cytokine and show that the early sepsis is driven by components of inflammatory character.

Keywords: Early sepsis; IL18 and IL10 cytokines; dynamic modeling; inflammation; parameter estimation.


Figures

Fig. 1
Fig. 1
Mean X-ray fluorescence signal measured for IL18 and IL10 cytokines at 0, 24 h and 48 h after septic shock. The corresponding signals obtained for the healthy volunteers are also reported as control data. The bars correspond to the standard deviation (n = 28 and 25 for sick and healthy patients, respectively).
Fig. 2
Fig. 2
Schematic representation of adsorption and production mechanisms related to IL18 and IL10 cytokines.
Fig. 3
Fig. 3
Calibration curve for protein concentration from Average X-ray fluorescence values in healthy patients.
Fig. 4
Fig. 4
Representation of the blood system.
Fig. 5
Fig. 5
Estimated parameter distributions by number of patients, Np for KA, KB, kA, kB, kBA, k1, k2, kc.
Fig. 6
Fig. 6
Cytokine source terms, SA and SB, relative to cell source term, Sc. Black dots indicate deceased patients and grey dots represent survivors.
Fig. 7
Fig. 7
Parameter value distributions by number of patients for KA, KB, kA, k1, k2.
Fig. 8
Fig. 8
Parameter value distributions by number of patients for KA, kA, k1 and the intervals corresponding to all dead patients.
Fig. 9
Fig. 9
Cytokine source terms, SA and SB, relative to cell source term, Sc. Black dots indicate deceased patients and grey dots represent survivors.
Fig. 10
Fig. 10
Parity plots for calculated Nc, A, B, RA, RB fluorescence against measured data (each color corresponds to one patient). Pearsons correlation coefficient values are 0.906 for Nc, 0.715 for A, 0.818 for B, 0.855 for RA and 0.874 for RB.
Fig. 11
Fig. 11
Calculated and measured pro-inflammatory cytokine A fluoresence versus time, markers indicate measured data, simulation results are shown as lines.
Fig. 12
Fig. 12
Calculated and measured recepetor of pro-inflammatory cytokine RA fluoresence versus time, markers indicate measured data, simulation results are shown as lines.
Fig. 13
Fig. 13
Calculated and measured anti-inflammatory cytokine B fluoresence versus time, markers indicate measured data, simulation results are shown as lines.
Fig. 14
Fig. 14
Calculated and measured receptor of anti-inflammatory cytokine RB fluoresence versus time, markers indicate measured data, simulation results are shown as lines.
Fig. 15
Fig. 15
Calculated and measured cell number Nc versus time, markers indicate measured data, simulation results are shown as lines.
Fig. 16
Fig. 16
calculated and measured inflammation level function f versus time, markers indicate measured data, simulation results are shown as lines.

References

    1. Singer M., Deutschman C.S., Seymour C.W., Shankar-Hari M., Annane D., Bauer M., Bellomo R., Bernard G.R., Chiche J.-D., Coopersmith C.M., Hotchkiss R.S., Levy M.M., Marshall J.C., Martin G.S., Opal S.M., Rubenfeld G.D., van der Poll T., Vincent J.-L. and Angus D.C., The Third International Consensus Definitions for Sepsis and Septic Shock (Sepsis-3), JAMA 315(8) (2016), 801. - PMC - PubMed
    1. Delano M.J. and Ward P.A., The immune system’s role in sepsis progression, resolution, and long-term outcome, Immunological Reviews 274(1) (2016), 330–353. - PMC - PubMed
    1. Hotchkiss R.S., Monneret G. and Payen D., Sepsis-induced immunosuppression from cellular dysfunctions to immunotherapy, Nature Rev. Immunol. 13 (2013), 862–874. - PMC - PubMed
    1. Sakr Y., Jaschinski U., Wittebole X., Szakmany T., Lipman J., Ñamendys-Silva S.A., Martin-Loeches I., Leone M., Lupu M.-N., Vincent J.-L., and ICON Investigators, Sepsis in Intensive Care Unit Patients: Worldwide Data From the Intensive Care over Nations Audit, Open Forum Infectious Diseases 5(12) (2018). - PMC - PubMed
    1. Reinhart K., Daniels R., Kissoon N., Machado F.R., Schachter R.D. and Finfer S., Recognizing Sepsis as a Global Health Priority — A WHO Resolution, New England Journal of Medicine 377(5) (2017), 414–417. - PubMed

MeSH terms