. 2020 Aug 3;130(8):4195-4212.
doi: 10.1172/JCI136174.

Kv1.3 modulates neuroinflammation and neurodegeneration in Parkinson's disease

Affiliations

Kv1.3 modulates neuroinflammation and neurodegeneration in Parkinson's disease

Souvarish Sarkar et al. J Clin Invest. .

Abstract

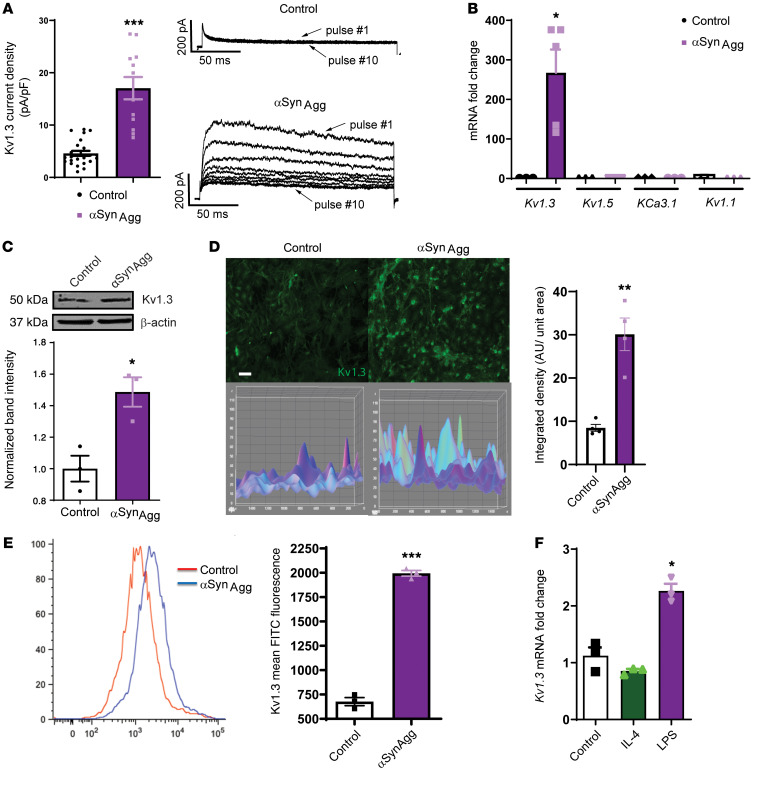
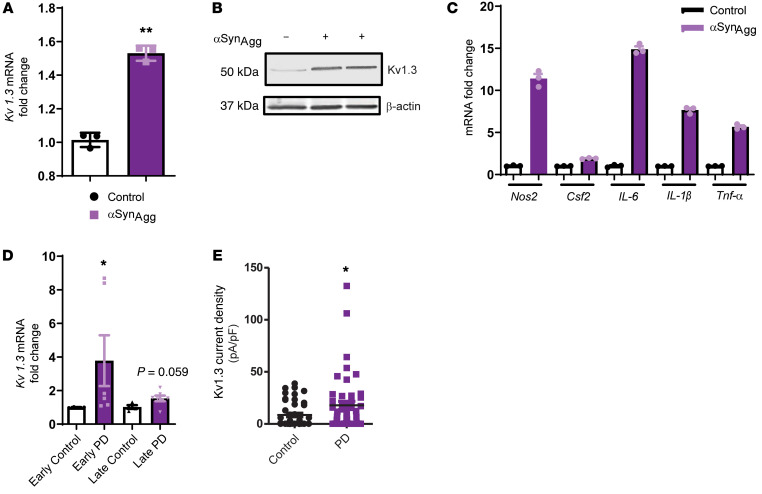
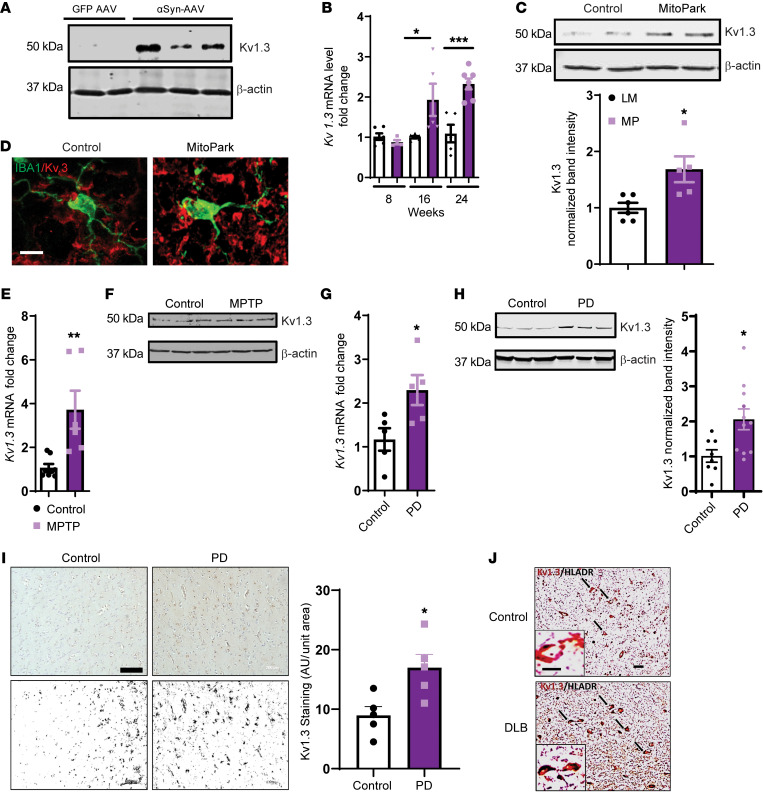
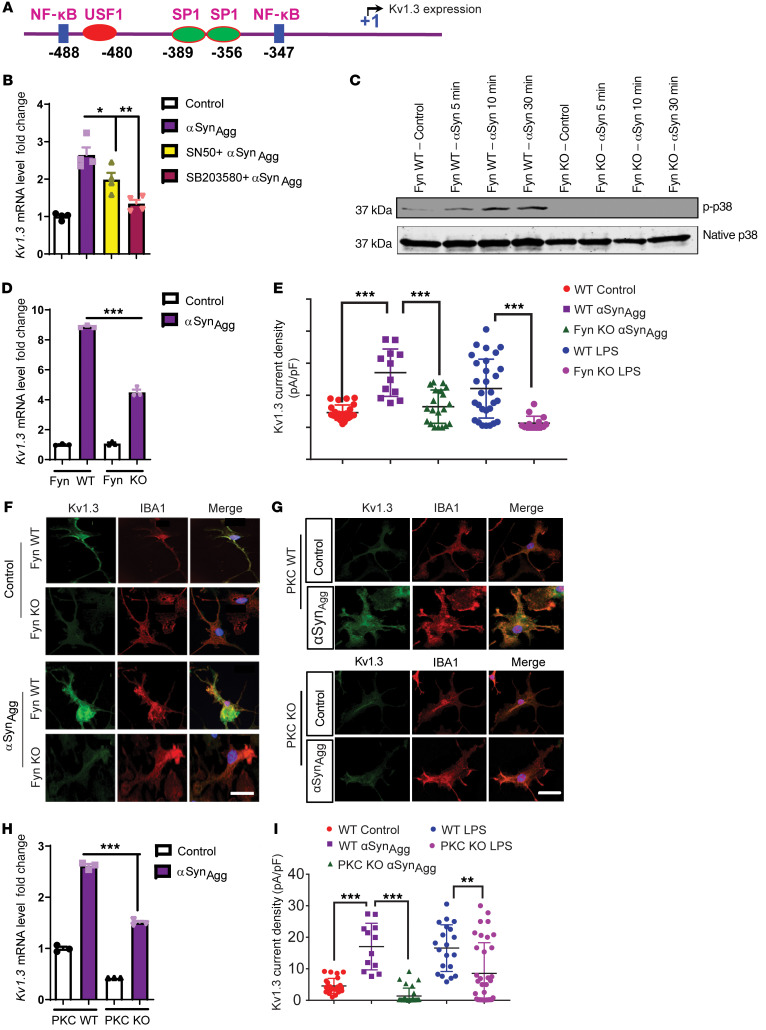
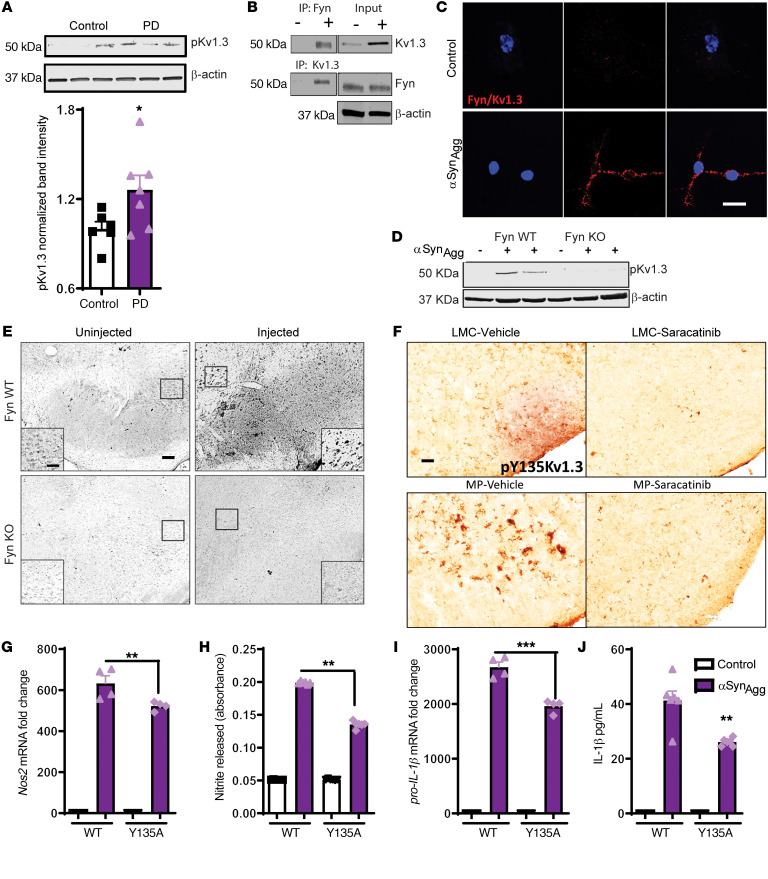
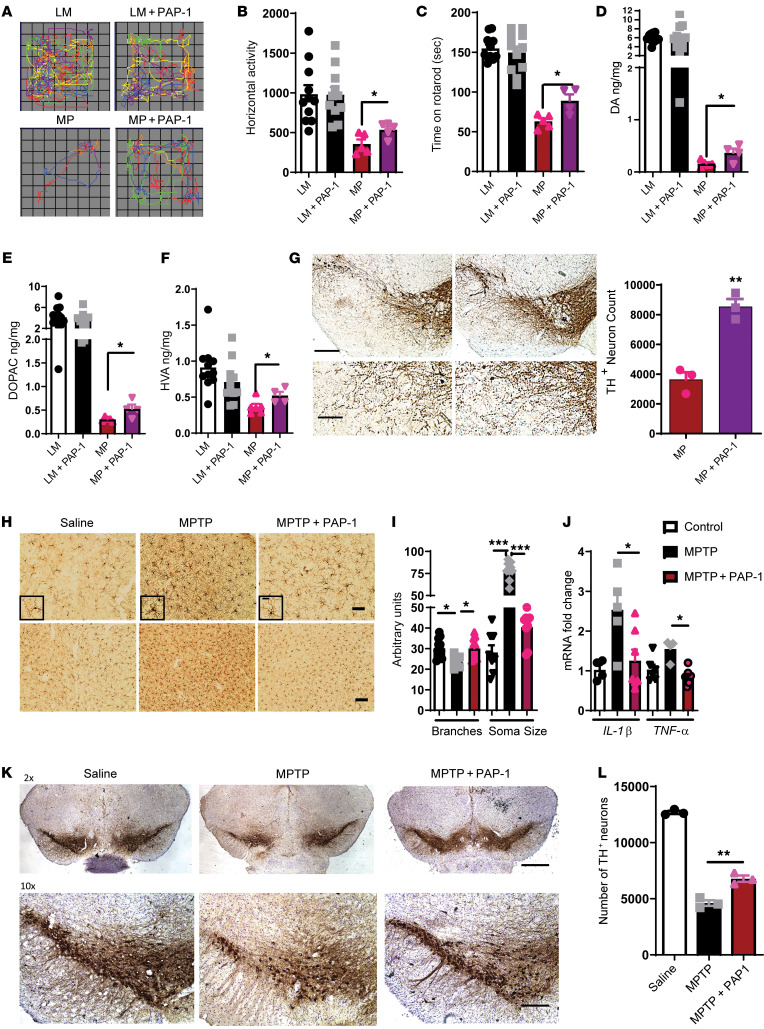
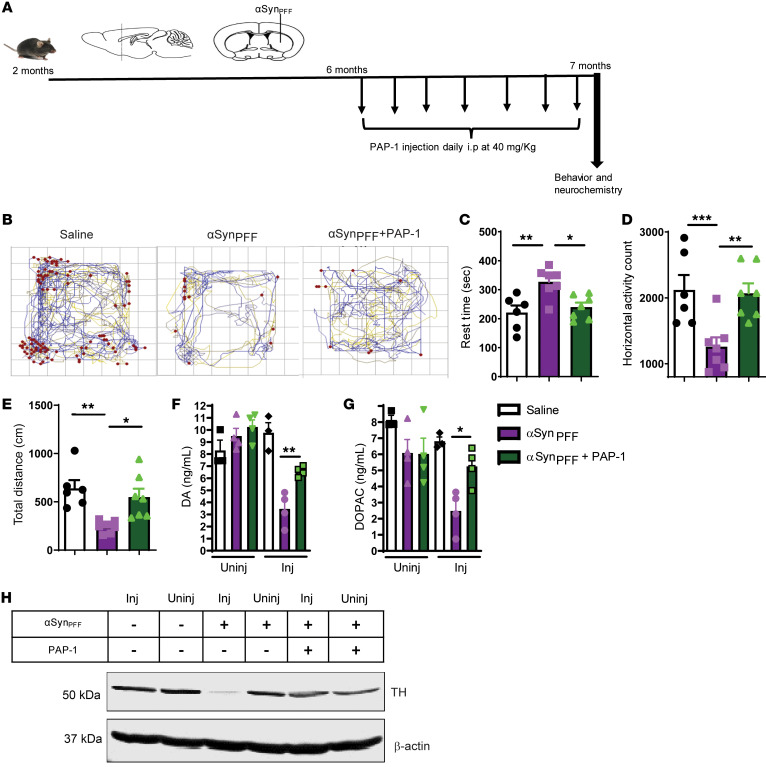
Characterization of the key cellular targets contributing to sustained microglial activation in neurodegenerative diseases, including Parkinson's disease (PD), and optimal modulation of these targets can provide potential treatments to halt disease progression. Here, we demonstrated that microglial Kv1.3, a voltage-gated potassium channel, was transcriptionally upregulated in response to aggregated α-synuclein (αSynAgg) stimulation in primary microglial cultures and animal models of PD, as well as in postmortem human PD brains. Patch-clamp electrophysiological studies confirmed that the observed Kv1.3 upregulation translated to increased Kv1.3 channel activity. The kinase Fyn, a risk factor for PD, modulated transcriptional upregulation and posttranslational modification of microglial Kv1.3. Multiple state-of-the-art analyses, including Duolink proximity ligation assay imaging, revealed that Fyn directly bound to Kv1.3 and posttranslationally modified its channel activity. Furthermore, we demonstrated the functional relevance of Kv1.3 in augmenting the neuroinflammatory response by using Kv1.3-KO primary microglia and the Kv1.3-specific small-molecule inhibitor PAP-1, thus highlighting the importance of Kv1.3 in neuroinflammation. Administration of PAP-1 significantly inhibited neurodegeneration and neuroinflammation in multiple animal models of PD. Collectively, our results imply that Fyn-dependent regulation of Kv1.3 channels plays an obligatory role in accentuating the neuroinflammatory response in PD and identify Kv1.3 as a potential therapeutic target for PD.

Keywords: Inflammation; Neurodegeneration; Neuroscience; Parkinson’s disease; Potassium channels.


Conflict of interest statement

Conflict of interest: AGK and VA have an equity interest in PK Biosciences Corporation located in Ames, Iowa, USA. The terms of this arrangement have been reviewed and approved by ISU in accordance with its conflict-of-interest policies. HW is an inventor on a 2004 University of California patent claiming PAP-1 as an immunosuppressant (5-Phenoxyalkoxypsoralens and methods for selective inhibition of the voltage-gated Kv1.3 potassium channel, patent no. US7557138B2).

Figures

Figure 1
Figure 1. Upregulated expression of the potassium channel Kv1.3 upon aggregated αSyn stimulation in microglial cells in vitro.
(A) Whole-cell patch-clamp recordings of PMCs treated with 1 μM αSynAgg for 24–48 hours, showing αSynAgg-induced increased Kv1.3 activity (control n = 24 and αSynAgg n = 12). Kv1.3 was identified by its characteristic use dependence, which was revealed when applying a train of ten 200-ms pulses from –80 to 40 mV at 1-second intervals (1 Hz). (B) qRT-PCR showing that αSynAgg induced Kv1.3 mRNA expression without significantly altering other potassium channels. (C) Western blot of αSynAgg-induced Kv1.3 protein expression in PMCs. (D) ICC of αSynAgg-induced Kv1.3 protein expression in PMCs. Scale bar: 100 μm. (E) Flow cytometric analysis of immortalized MMCs treated with 1 μM αSynAgg for 24 hours, showing αSynAgg-induced Kv1.3 surface expression. (F) qRT-PCR of human microglia treated with LPS (1 μg/mL) and IL-4 (20 ng/mL) for 6 hours, showing LPS-induced Kv1.3 expression. A 1-way ANOVA was used to compare multiple groups. In most cases, Tukey’s post hoc analysis was applied in B and F. A 2-tailed Student’s t test was used for all other figures when comparing 2 groups. Each dot on the bar graphs represents a biological replicate. Data are presented as the mean ± SEM, with 3–5 biological replicates from 2–3 independent experiments unless otherwise noted. *P ≤ 0.05, **P < 0.01, and ***P < 0.001.
Figure 2
Figure 2. Upregulated expression of the potassium channel Kv1.3 upon aggregated αSyn stimulation in ex vivo slices and B cells derived from patients with PD.
(A) Midbrain slice cultures were treated with 1 μM αSynAgg for 24 hours. qRT-PCR shows upregulated Kv1.3 mRNA expression. (B) Western blot shows upregulated Kv1.3 protein level in midbrain slice cultures treated with 1 μM αSynAgg for 24 hours. (C) qRT-PCR of midbrain slice cultures treated with 1 μM αSynAgg for 24 hours, revealing upregulation of the proinflammatory factors Nos2, Csf2, IL-6, IL-1β, and Tnfa. (D) qRT-PCR shows increased Kv1.3 mRNA expression in B cell lymphocytes isolated from patients with PD compared with expression in B cell lymphocytes from age-matched controls. (E) Whole-cell patch clamping of B cell lymphocytes isolated from patients with PD showed higher Kv1.3 channel activity compared with that observed in age-matched controls (n = 3 control and n = 3 PD). A 1-way ANOVA was used to compare multiple groups in C and D. Tukey’s post hoc analysis was applied. A 2-tailed Student’s t test was used to compare 2 groups. Each dot on the bar graphs represents a biological replicate. Data are presented as the mean ± SEM, with 3–7 biological replicates from 2–3 independent experiments unless otherwise indicated. *P ≤ 0.05 and **P < 0.01.
Figure 3
Figure 3. Kv1.3 expression is highly induced in microglial cells in experimental models of PD and postmortem PD brains.
(A) Western blot showing increased Kv1.3 protein levels in the substantia nigra of the Syn-AAV mouse model of PD. (B) qRT-PCR analysis of 8- to 24-week-old nigral tissues from the MitoPark mouse model of PD showing Kv1.3 induction compared with age-matched littermate controls. (C) Western blot of 24-week-old nigral tissues from the MitoPark mouse model of PD (MP) showing induction of Kv1.3 protein expression compared with age-matched littermate control mice (LM). (D) IHC in 24-week-old nigral tissues from the MitoPark mouse model of PD showing higher Kv1.3 protein levels (red) in IBA1-positive microglial cells (green) compared with age-matched controls as revealed by their colocalization (yellow). Scale bar: 20 μm. (E) qRT-PCR analysis of nigral tissues from the MPTP mouse model revealing induction of Kv1.3 mRNA expression. (F) Western blot showing increased Kv1.3 protein levels in substantia nigra of the MPTP mouse model of PD. (G) qRT-PCR analysis of postmortem human PD brains showing elevated Kv1.3 mRNA expression. (H) Western blot of the SN region of postmortem human PD brain showing induction of Kv1.3 protein expression compared with age-matched controls. n = 6–8. (I) Immunostaining revealing higher Kv1.3 levels in the prefrontal cortex of postmortem human PD brains compared with age-matched controls. Lower panel shows the deconvoluted binary image used for analysis. Three regions per brain were analyzed. Scale bar: 200 μm. (J) Dual DAB staining showing induction of Kv1.3 expression in HLA-DR–positive microglial cells in patients with DLBs compared with age-matched controls. Scale bars: 100 μm; 20 μm (enlarged insets). A 1-way ANOVA was used to compare multiple groups. Tukey’s post hoc analysis was applied B. A 2-tailed Student’s t test was used to compare 2 groups. Each dot on the bar graphs represents a biological replicate. Data are presented as the mean ± SEM, with 3–9 biological replicates from 2–3 independent experiments unless otherwise indicated. *P ≤ 0.05, **P < 0.01, and ***P < 0.001.
Figure 4
Figure 4. Fyn modulates the transcriptional regulation of Kv1.3 in microglial cells through the Fyn/PKCδ kinase signaling cascade.
(A) In silico analysis of the promoter sequence of Kv1.3 revealed probable Nf-κB– and SP1-binding sites. (B) qRT-PCR analysis of immortalized MMCs cotreated with αSynAgg and either SN50 (100 μg/mL) or SB203580 (1 μM), showing that both compounds attenuated αSynAgg-induced Kv1.3 expression. (C) Western blot of Fyn WT and KO PMCs treated with αSynAgg, showing that Fyn KO reduced the induction of the p38 MAPK pathway. (D) qRT-PCR analysis revealed that Fyn KO reduced αSynAgg-induced Kv1.3 mRNA levels. (E) Whole-cell patch-clamp recording showing that Fyn KO attenuated αSynAgg- and LPS-induced Kv1.3 activity compared with Fyn WT PMCs (WT control n = 24, WT αSynAgg n = 12, WT LPS n = 29, Fyn KO αSynAgg n = 20, Fyn KO LPS n = 15). (F) ICC showing that Fyn KO reduced αSynAgg-induced Kv1.3 protein levels in PMCs. Scale bar: 15 μm. (G) ICC of PMCs revealed that αSynAgg-induced Kv1.3 protein expression was reduced by PKCδ KO. Scale bar: 15 μm. (H) qRT-PCR analysis of PMCs showing that PKC KO reduced the expression of αSynAgg-induced Kv1.3 mRNA. (I) Whole-cell patch clam recording of PMCs showing that PKC KO attenuated αSynAgg- and LPS-induced Kv1.3 activity compared with PKC WT PMCs (WT control n = 24, WT αSynAgg n = 12, WT LPS n = 20, PKC-KO αSynAgg n = 29, PKC-KO LPS n = 35). Data are presented as the mean ± SD. A 1-way ANOVA was used to compare multiple groups. In most cases, Tukey’s post hoc analysis was applied. Each dot on the bar graphs represents a biological replicate. Data are presented as the mean ± SEM, with 3–4 biological replicates from 2–3 independent experiments unless otherwise indicated. *P ≤ 0.05, **P < 0.01, and ***P < 0.001.
Figure 5
Figure 5. Fyn modulates the posttranslational modification of Kv1.3. (A) Western blot analysis of postmortem human PD and age-matched control brains showing increased phosphorylation of Kv1.3. (B) Immunoprecipitation of Fyn and Kv1.3 showing direct Fyn-Kv1.3 interaction after αSynAgg treatment.
(C) Duolink PLA showing αSynAgg-induced interaction between Kv1.3 and Fyn. Scale bar: 25 μm. (D) Western blot of Fyn WT and KO PMCs revealed that Kv1.3 phosphorylation at residue 135 was Fyn dependent. (E) IHC analysis of substantia nigra from Fyn+/+ and Fyn–/– mice showing reduced phosphorylation of Kv1.3 after αSynPFF injection. Scale bars: 100 μm; 60 μm (insets). (F) IHC of substantia nigra from MitoPark mice and their littermate controls showing that pharmacological inhibition of Fyn by saracatinib reduced Kv1.3 phosphorylation. Scale bar: 100 μm. (GJ) Immortalized MMCs were either transfected with WT Kv1.3 or aY135A Kv1.3 plasmid. (G) qRT-PCR analysis and (H) Griess assay showing reduced levels of inducible NOS (iNOS) and nitrite release, respectively, in Y135A Kv1.3-transfected cells compared with WT cells. (I) qRT-PCR analysis showing reduced IL-1β production in Y135A Kv1.3–transfected versus WT Kv1.3–transfected MMCs. (J) Luminex assay showing reduced IL-1β secretion in Y135A Kv1.3–transfected compared with WT Kv1.3–transfected MMCs. A 1-way ANOVA was used to compare multiple groups. In most cases, Tukey’s post hoc analysis was applied. A 2-tailed Student’s t test was used to compare 2 groups in A. Each dot on the bar graphs represents a biological replicate. Data are presented as the mean ± SEM, with 3–4 biological replicates from 2–3 independent experiments. *P ≤ 0.05, **P < 0.01, and ***P < 0.001.
Figure 6
Figure 6. Kv1.3 modulates neuroinflammation in a cell culture model of PD.
(AC) Kv1.3 WT and KO PMCs were treated with 1 μM αSynAgg for 24 hours. Luminex analysis shows that Kv1.3 KO reduced the release of the αSynAgg-induced proinflammatory factors (A) TNF-α, (B) IL-12, and (C) IL-1β. (DH) Immortalized MMCs were transfected with WT a Kv1.3 plasmid, and then 48 hours after transfection, cells were treated with 1 μM αSynAgg for 24 hours. (DF) qRT-PCR analysis showing that Kv1.3 overexpression aggravated αSynAgg-induced production of the proinflammatory factors (D) Nos2, (E) pro–IL-1β, and (F) TNF-α. (G and H) Luminex analysis showing that Kv1.3 overexpression potentiated the release of the proinflammatory factors (G) IL-6 and (H) IL-12. (I) Voltage ramp from –120 mV to 40 mV elicited a characteristic outward rectifying current in αSynAgg-treated microglia that was sensitive to the Kv1.3-selective inhibitor PAP-1. (J) LDH assay showing that PAP-1 reduced αSynAgg-induced LDH release from microglial cells. (KM) Luminex assay revealing that PAP-1 attenuated the αSynAgg-induced proinflammatory factors (K) IL-12, (L) TNF-α, and (M) IL-6. (N) Western blot analysis demonstrating that PAP-1 reduced αSynAgg-induced NLRP3 expression. (O) ICC analysis revealed that PAP-1 reduced NLRP3 expression induced by αSynAgg. Scale bar: 25 μm. A 1-way ANOVA was performed to compare multiple groups. In most cases, Tukey’s post hoc analysis was applied. Each dot on the bar graphs represents a biological replicate. Data are presented as the mean ± SEM, with 3–4 biological replicates from 2–3 independent experiments. *P ≤ 0.05, **P < 0.01, and ***P < 0.001.
Figure 7
Figure 7. PAP-1 reduces inflammation and neurodegeneration in mouse models of PD.
(AH) MitoPark mouse model. (A) Representative movement tracks showing that PAP-1 rescued movement deficits of MitoPark mice at 20 weeks. (B) VersaMax open-field test showed increased horizontal activity of MitoPark mice treated with PAP-1 compared with the vehicle-treated control group. (C) Behavior test revealed increased time spent on the rotarod by MitoPark mice treated with PAP-1 compared with the vehicle-treated group. (DF) HPLC showing that PAP-1 treatment protected MitoPark mice from loss of (D) dopamine (DA), (E) DOPAC, and (F) HVA. (G) IHC of SNpc showing that PAP-1 protected against loss of TH-positive neurons in MitoPark mice and stereology analysis of the SNpc showing that PAP-1 decreased the loss of TH-positive neurons in MitoPark mice. Scale bars: 200 μm (top panel); 100 μm (bottom panel). (HL) MPTP mouse model. (H) IHC of MPTP-exposed substantia nigra and striatum showing that PAP-1 altered microgliosis. Scale bars: 50 μm (top panel); 20 μm (insets); 100 μm (bottom panel). (I) ImageJ analysis of MPTP-exposed substantia nigra showing that PAP-1 reduced soma size and increased the number of microglial branches. (J) qRT-PCR analysis of striatum after MPTP showing reduced mRNA expression of proinflammatory factors IL-1β and TNF-α. (K) IHC of SNpc showing that PAP-1 protected against MPTP-induced loss of TH-positive neurons. Scale bars: 500 μm (top panel); 200 μm (bottom panel). (L) Stereological analysis of the SNpc showing that PAP-1 decreased the loss of TH-positive neurons after MPTP treatment. One-way ANOVA was used to compare multiple groups. In most cases, Tukey’s post hoc analysis was applied. Each dot on the bar graphs represents a biological replicate. Data are presented as the mean ± SEM, with 3–7 animals per group. *P ≤ 0.05, **P < 0.01, and ***P < 0.001.
Figure 8
Figure 8. Kv1.3 inhibition protects against αSynPFF-induced behavior deficit and dopaminergic neuronal loss.
(A) Treatment paradigm corresponding to the αSynPFF mouse model of PD. (B) Representative movement tracks showing that PAP-1 rescued movement deficits induced by αSynPFF. (CE) A VersaMax open-field test showed decreased (C) rest time and increased (D) horizontal activity and (E) total distance traveled for αSynPFF mice treated with PAP-1. (F and G) HPLC showing that PAP-1 treatment protected against loss of (F) dopamine and (G) DOPAC induced by αSynPFF. (H) Western blot analysis of TH showing loss of TH induced by αSynPFF in the SNpc region. A 1-way ANOVA was used to compare multiple groups. In most cases, Tukey’s post hoc analysis was applied. Each dot on the bar graphs represents a biological replicate. Data are presented as the mean ± SEM, with 3–7 animals per group. *P ≤ 0.05, **P < 0.01, and ***P < 0.001.

References

    1. Doorn KJ, et al. Emerging roles of microglial activation and non-motor symptoms in Parkinson’s disease. Prog Neurobiol. 2012;98(2):222–238. doi: 10.1016/j.pneurobio.2012.06.005. - DOI - PubMed
    1. Wolters ECh Non-motor extranigral signs and symptoms in Parkinson’s disease. Parkinsonism Relat Disord. 2009;15 Suppl 3:S6–12. - PubMed
    1. Tansey MG, Goldberg MS. Neuroinflammation in Parkinson’s disease: its role in neuronal death and implications for therapeutic intervention. Neurobiol Dis. 2010;37(3):510–518. doi: 10.1016/j.nbd.2009.11.004. - DOI - PMC - PubMed
    1. Block ML, Zecca L, Hong JS. Microglia-mediated neurotoxicity: uncovering the molecular mechanisms. Nat Rev Neurosci. 2007;8(1):57–69. doi: 10.1038/nrn2038. - DOI - PubMed
    1. Glass CK, Saijo K, Winner B, Marchetto MC, Gage FH. Mechanisms underlying inflammation in neurodegeneration. Cell. 2010;140(6):918–934. doi: 10.1016/j.cell.2010.02.016. - DOI - PMC - PubMed

Publication types

MeSH terms