. 2020 Aug 3;130(8):4182-4194.
doi: 10.1172/JCI136618.

Lymph node fibroblastic reticular cells deposit fibrosis-associated collagen following organ transplantation

Affiliations

Lymph node fibroblastic reticular cells deposit fibrosis-associated collagen following organ transplantation

Xiaofei Li et al. J Clin Invest. .

Abstract

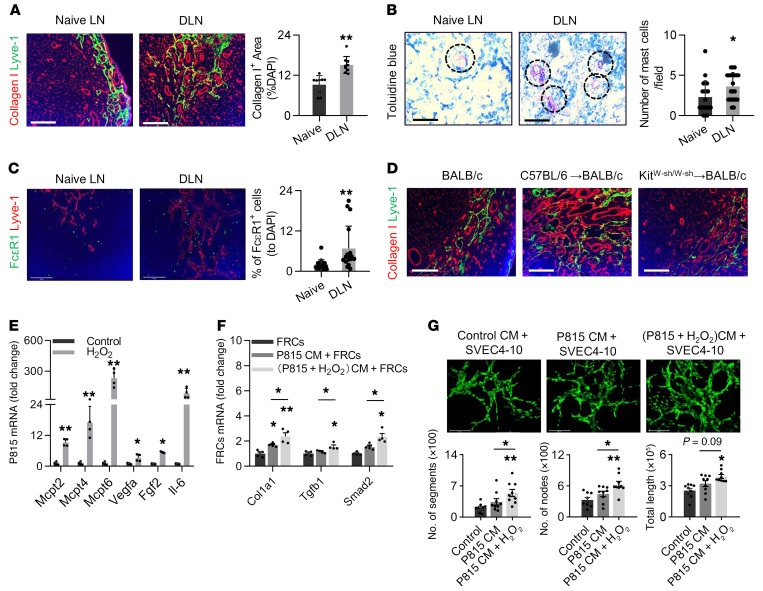
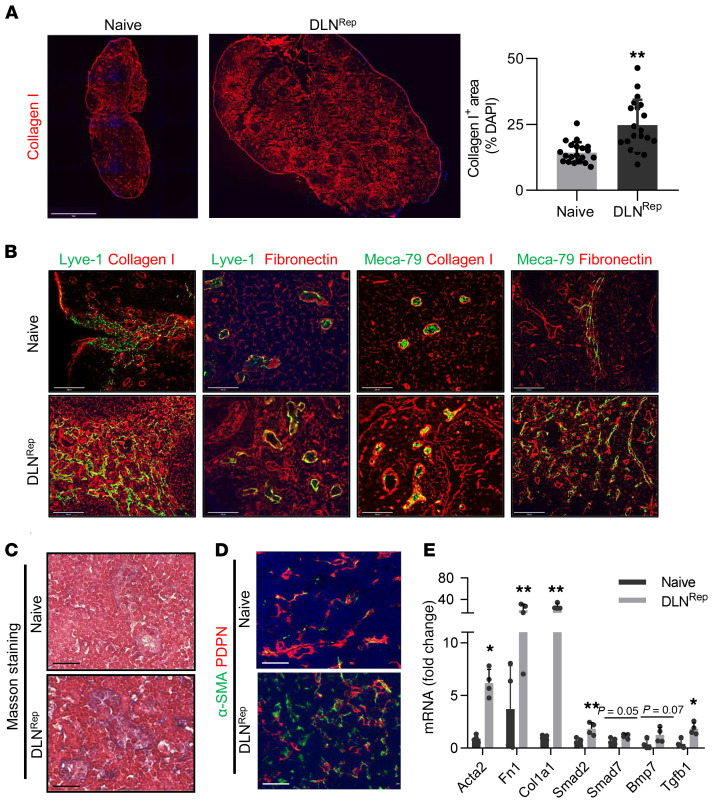
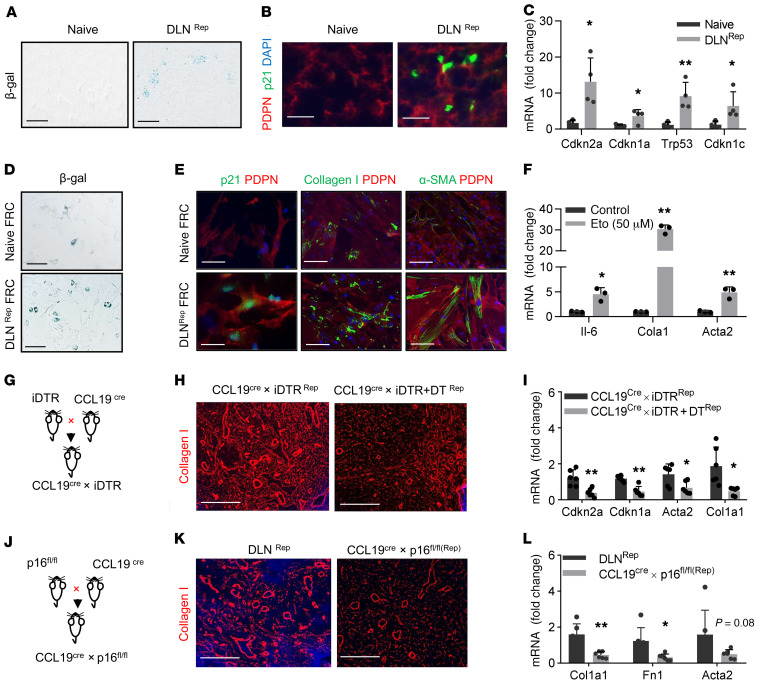
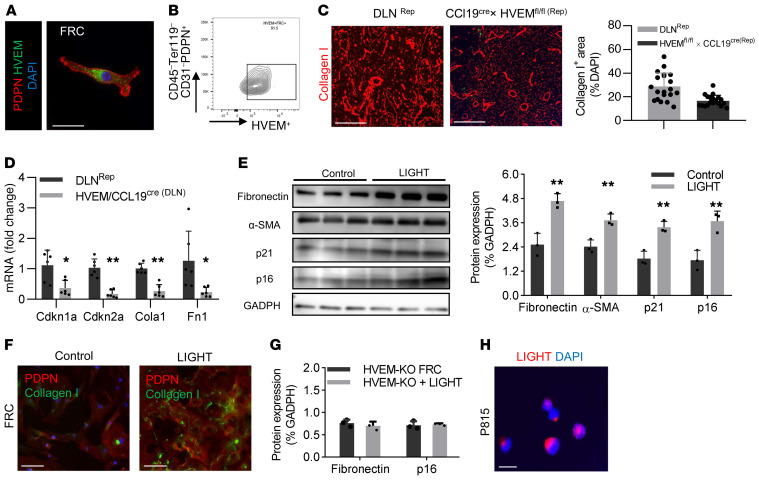
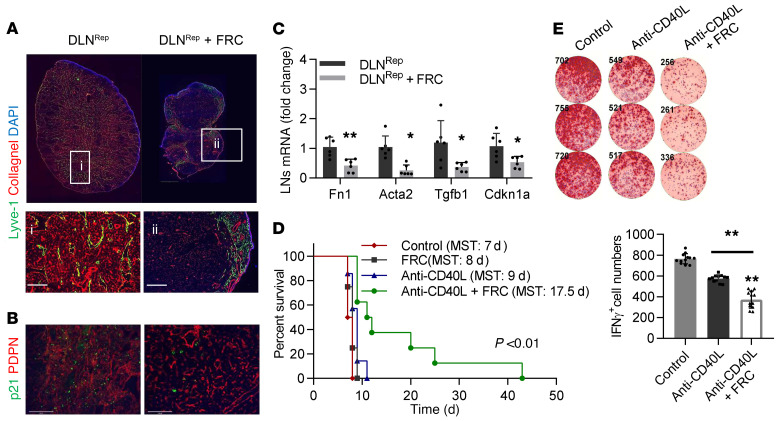
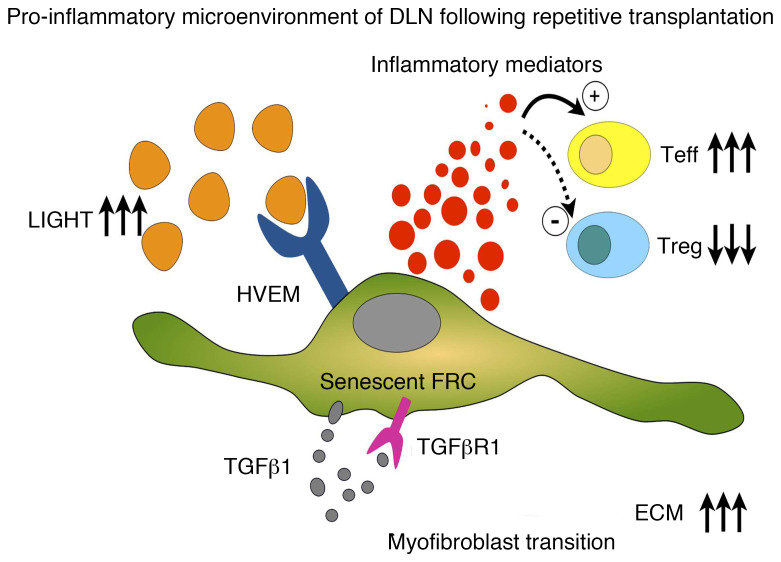
Although the immune response within draining lymph nodes (DLNs) has been studied for decades, how their stromal compartment contributes to this process remains to be fully explored. Here, we show that donor mast cells were prominent activators of collagen I deposition by fibroblastic reticular cells (FRCs) in DLNs shortly following transplantation. Serial analysis of the DLN indicated that the LN stroma did not return to its baseline microarchitecture following organ rejection and that the DLN contained significant fibrosis following repetitive organ transplants. Using several FRC conditional-knockout mice, we show that induction of senescence in the FRCs of the DLN resulted in massive production of collagen I and a proinflammatory milieu within the DLN. Stimulation of herpes virus entry mediator (HVEM) on FRCs by its ligand LIGHT contributed chiefly to the induction of senescence in FRCs and overproduction of collagen I. Systemic administration of ex vivo-expanded FRCs to mice decreased DLN fibrosis and strengthened the effect of anti-CD40L in prolonging heart allograft survival. These data demonstrate that the transformation of FRCs into proinflammatory myofibroblasts is critically important for the maintenance of a proinflammatory milieu within a fibrotic DLN.

Keywords: Fibrosis; Immunology; Organ transplantation; Therapeutics.


Conflict of interest statement

Conflict of interest: The authors have declared that no conflict of interest exists.

Figures

Figure 1
Figure 1. Mast cells as early inducers of collagen I deposition in the DLN.
(A) Images show a comparison of collagen I (red) expression between the DLNs of mice on day 1 after allogeneic skin transplantation and the LNs of naive mice. Scale bars: 50 μm. Semiquantitative assessment is shown in the graph. n = 4. (B) Toluidine blue staining of mast cells (dashed circles) and comparison of their populations in DLNs and naive LNs. Scale bars: 50 μm. n = 4. (C) Representative IF staining of mast cells and semiquantitative assessment of FcεRI (green) expression by mast cells in DLNs. Lyve-1+ lymphatic endothelium (red) and DAPI+ nuclei (blue) staining is also shown. Scale bars: 50 μm. n = 4. (D) IF staining of collagen I (red) and Lyve-1 (green) in the LNs of naive BALB/c mice, as well as the DLNs of C57BL/6→BALB/c skin-transplanted mice and KitW-sh/W-sh→BALB/c skin-transplanted mice. Scale bars: 50 μm. n = 4. (E) Gene expression levels of the mast cell proteases as well as Vegfa, Fgf2, and Il6 with and without H2O2 stimulation (n = 4; each dot represents 1 sample). (F) Gene expression levels of Col1a1, Tgfb1, and Smad2 in FRCs following treatment with different mast cell–conditioned media (CM). n = 4. (G) Micrographs and tube formation analysis of SVEC4-10 cells treated with different mast cell–conditioned media. Scale bars: 100 μm. The percentage of the areas stained positive in the fluorescence micrographs was assessed in 3–6 random microscopic fields for each mouse. Data are presented as the mean ± SD. *P < 0.05 and **P < 0.01, by 2-tailed Student’s t test (AC, and E) and 2-way ANOVA with Tukey’s multiple comparisons post hoc test (F and G).
Figure 2
Figure 2. Repetitive skin transplantation induces fibrosis in DLNs.
(A) Collagen I fibers (red) in the DLNs (axillary LNs, DLNRep) of mice following repetitive skin transplantation in comparison with the axillary LNs of age-matched naive mice and semiquantitative analysis. Scale bar: 1500 μm. n = 5. (B) Costaining of Meca-79+ HEVs (green) and Lyve-1+ lymphatic vessels (green) with collagen I fibers (red) and fibronectin fibers (red) in DLNRep and age-matched naive LNs. Scale bars: 100 μm. (C) Masson’s trichrome stain of fibrosis in DLNRep and age-matched naive LNs. Scale bars: 50 μm. (D) Fluorescence micrographs showing expression of the myofibroblast marker α-SMA by PDPN+ FRCs in DLNRep and naive LNs. Scale bars: 100 μm. (E) Gene expression levels of fibrosis markers and TGF-β signaling molecules in the DLNRep and LNs of naive mice. n = 4. The percentage of the areas stained positive in the fluorescence micrographs was assessed in 3–6 random microscopic fields for each mouse. Data are presented as the mean ± SD. *P < 0.05 and **P < 0.01, by Student’s t test.
Figure 3
Figure 3. Senescent FRCs play a crucial role in the accumulation of ECM following transplantation.
(A) Representative images of β-gal (senescence marker) staining in DLNRep and a LN of an age-matched naive mouse. Scale bars: 50 μm. (B) Costaining of PDPN+ FRCs (red) and the senescence marker p21Waf1/Cip1 (p21) in sections of DLNRep and an age-matched naive LN. Scale bars: 50 μm. (C) Expression levels of senescence genes in DLNRep and an age-matched naive LN. n = 4 (each dot represents 1 sample). (D) Staining with β-gal and (E) costaining with PDPN (red) for p21, collagen I, and α-SMA in FRCs from a naive LN and DLNRep. Scale bars: 50 μm. (F) Gene expression levels of Il6, Col1a1, and Acta2 in FRCs following in vitro treatment with the senescence inducer etoposide (Eto). (G) Schematic of the generation of CCL19Cre iDTR mice. (H) Collagen I+ fibers (red) in the DLNs of CCL19Cre iDTR allogeneic skin transplant recipient mice with or without DT treatment. Scale bars: 50 μm. (I) Gene expression levels of Cdkn2a, Cdkn1a, Acta2, and Col1a1 in DLNs from CCL19Cre iDTR allogeneic skin transplant recipient mice with or without DT treatment (n = 6). (J) Schematic of the generation of CCL19Cre p16fl/fl mice with FRC conditional knockout of p16. (K) Collagen I fibers (red) in DLNs of C57BL/6J and CCL19Cre p16fl/fl recipient mice following allogeneic repetitive skin transplantation. Scale bars: 50 μm. (L) Gene expression levels of Col1a1, Fn1, and Acta2 in DLNs (n = 6). The percentage of areas stained positive in the fluorescence micrographs was assessed in 3–6 random microscopic fields for each mouse. Data are presented as the mean ± SD. *P < 0.05 and **P < 0.01, by Student’s t test.
Figure 4
Figure 4. LIGHT increases ECM accumulation in DLNs by binding to HVEM in FRCs following transplantation.
(A) IF staining for HVEM (green) expression in PDPN+ FRCs (red) in vitro. Scale bar: 10 μm. (B) Flow cytometric analysis of HVEM expression by FRCs through gating on the CD45CD31PDPN+ cell population from LNs. (C) Staining and semiquantitative analysis of collagen I fibers (red) in DLNRep (staining was normalized to DAPI). Scale bars: 10 μm. n = 4. (D) Gene expression levels of senescence and fibrosis genes in FRCs from WT and HVEM-KO mice treated with LIGHT (25 ng/mL). n = 6. (E) Western blot and quantification of protein levels of fibronectin, α-SMA, p21, and p16 in cultured WT FRCs after treatment with LIGHT (25 ng/mL). (F) IF staining of cultured WT FRCs with collagen I (green) and PDPN (red) after LIGHT (25 ng/mL) treatment compared with no treatment. Scale bars: 10 μm. (G) Measurement of protein levels of fibronectin and p16 in cultured HVEM-KO FRCs after LIGHT stimulation. (H) IF staining for LIGHT expression in mast cells. Scale bar:10 μm. The percentage of areas stained positive in the fluorescence micrographs was assessed in 3–6 random microscopic fields for each mouse. Data are presented as the mean ± SD. *P < 0.05 and **P < 0.01, by Student’s t test.
Figure 5
Figure 5. Injection of healthy FRCs decreases ECM accumulation induced by transplantation.
(A) IF staining of collagen I fibers (red) in DLNRep and DLNRep plus FRC mice. Scale bars: 1000 μm and 50 μm (enlarged insets). (B) Costaining of the senescence indicator p21 (green) with PDPN (red) in the DLNRep and DLNRep plus FRC treatment groups. Scale bars: 50 μm. (C) Gene expression levels of Fn1, Acta-2, Tgfb1, and Cdkn1a in the DLNRep of untreated mice and those treated with healthy FRCs (n = 6). (D) Kaplan-Meier survival curve for untreated mice (control: red, n = 4) and mice treated with FRCs (5 × 10⁴/mouse, black, n = 4), anti-CD40L (9 μg/mouse, blue, n = 7), and anti-CD40L (9 μg/mouse) plus FRCs (5 × 10⁴/mouse) (green, n = 8) following allogeneic heart transplantation. MST, mean survival time.**P < 0.01, by log-rank (Mantel-Cox) test. (E) ELISpot assay shows the number of IFN-γ+ splenocytes in the untreated group, the anti-CD40L treatment group, and the anti-CD40L plus FRC treatment group on day 7 after heart transplantation (n = 4). The percentage of areas stained positive in the fluorescence micrographs was assessed in 3–6 random microscopic fields for each mouse. Data are presented as the mean ± SD. *P < 0.05 and **P < 0.01, by 2-tailed Student’s t test (AC) and 2-way ANOVA with Tukey’s multiple comparisons post hoc test (E).
Figure 6
Figure 6. Schematic presentation of a senescent FRC in the proinflammatory microenvironment of the DLN following repetitive transplantation.
Sustained stimulation of HVEM by LIGHT on the surface of the FRC results in increased production of ECM and its phenotypic transformation toward a myofibroblast, creating and nurturing an immunostimulatory milieu in the LN. Teff, effector T cell.

Comment in

References

    1. Fletcher AL, et al. Reproducible isolation of lymph node stromal cells reveals site-dependent differences in fibroblastic reticular cells. Front Immunol. 2011;2:35. - PMC - PubMed
    1. Hammerschmidt SI, et al. Stromal mesenteric lymph node cells are essential for the generation of gut-homing T cells in vivo. J Exp Med. 2008;205(11):2483–2490. doi: 10.1084/jem.20080039. - DOI - PMC - PubMed
    1. Cording S, et al. The intestinal micro-environment imprints stromal cells to promote efficient Treg induction in gut-draining lymph nodes. Mucosal Immunol. 2014;7(2):359–368. doi: 10.1038/mi.2013.54. - DOI - PubMed
    1. Bénézech C, et al. Lymphotoxin-β receptor signaling through NF-κB2-RelB pathway reprograms adipocyte precursors as lymph node stromal cells. Immunity. 2012;37(4):721–734. doi: 10.1016/j.immuni.2012.06.010. - DOI - PMC - PubMed
    1. Fletcher AL, Acton SE, Knoblich K. Lymph node fibroblastic reticular cells in health and disease. Nat Rev Immunol. 2015;15(6):350–361. doi: 10.1038/nri3846. - DOI - PMC - PubMed

Publication types