. 2020 Aug 3;130(8):4118-4132.
doi: 10.1172/JCI130955.

A CLN6-CLN8 complex recruits lysosomal enzymes at the ER for Golgi transfer

Affiliations

A CLN6-CLN8 complex recruits lysosomal enzymes at the ER for Golgi transfer

Lakshya Bajaj et al. J Clin Invest. .

Abstract

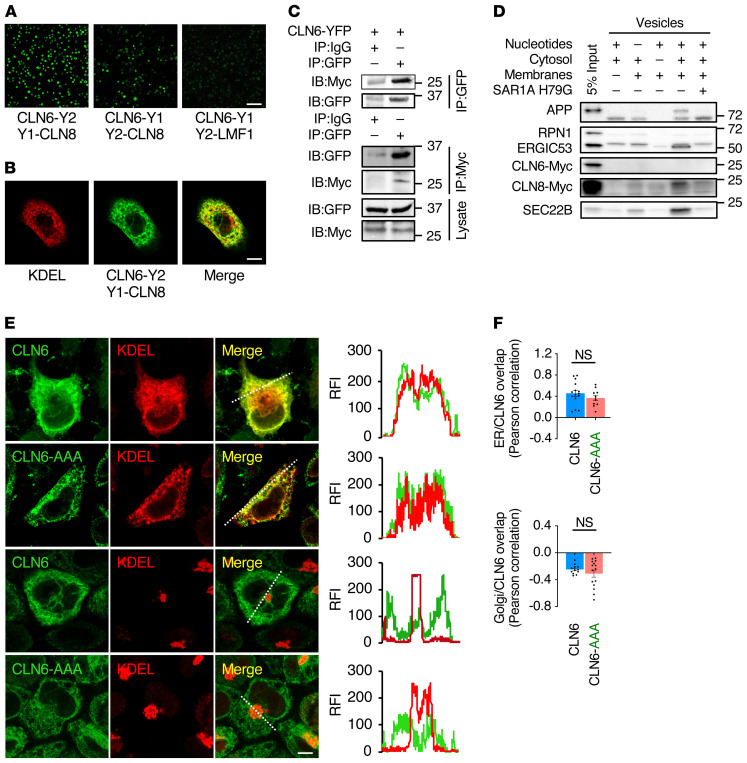
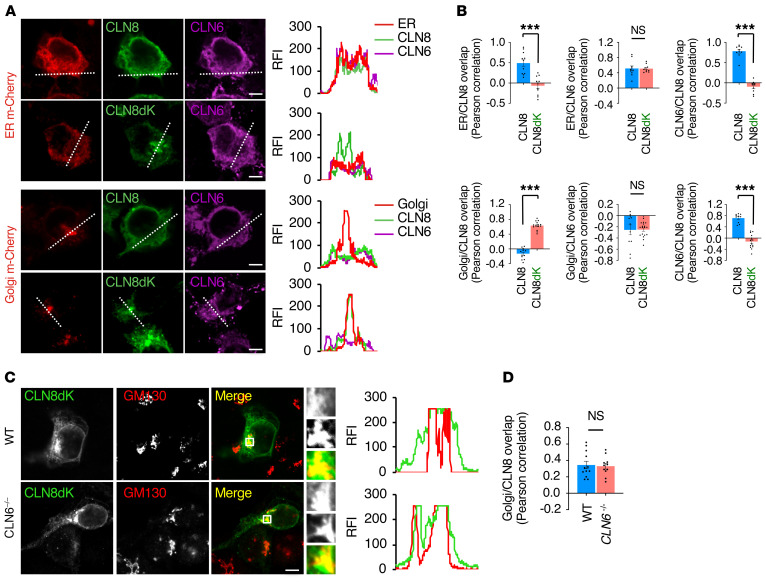
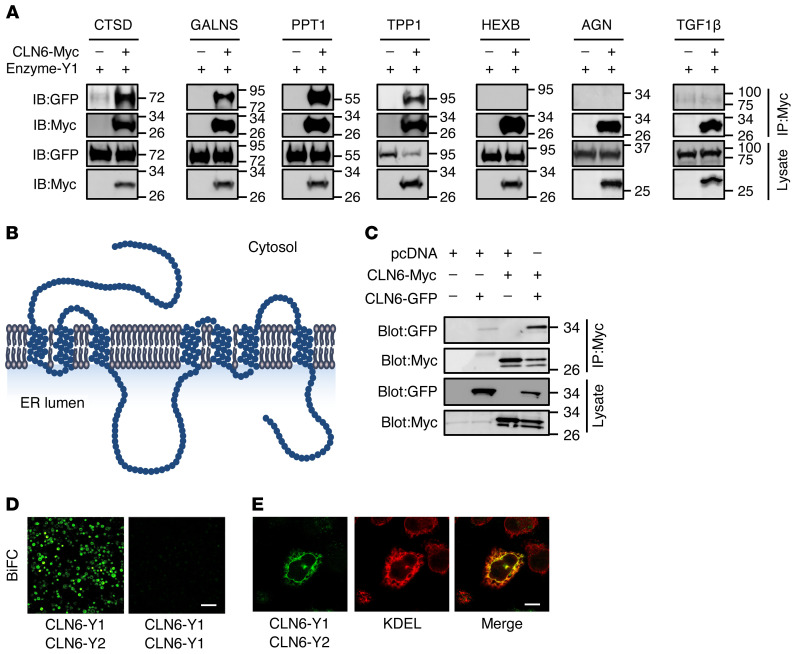
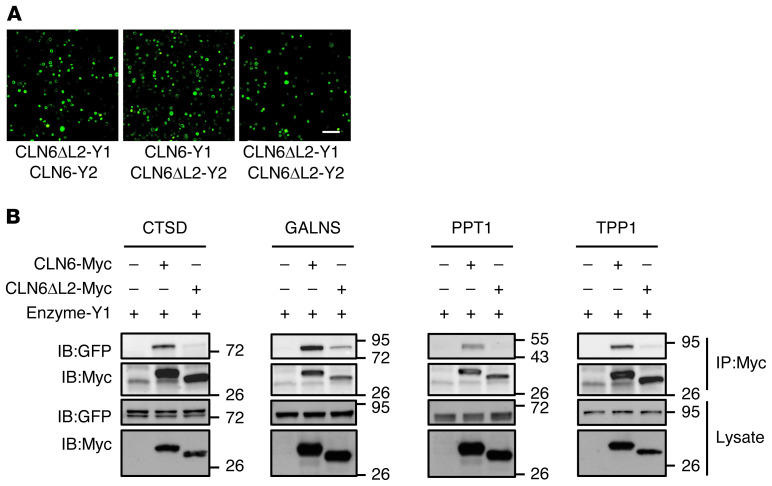
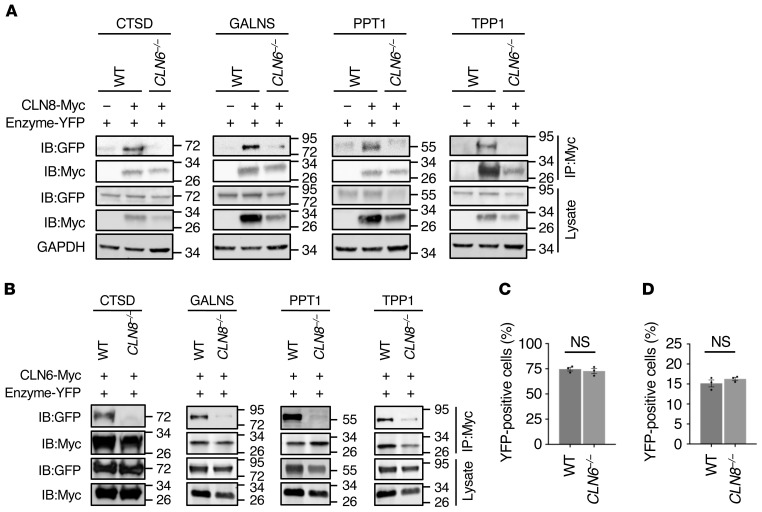
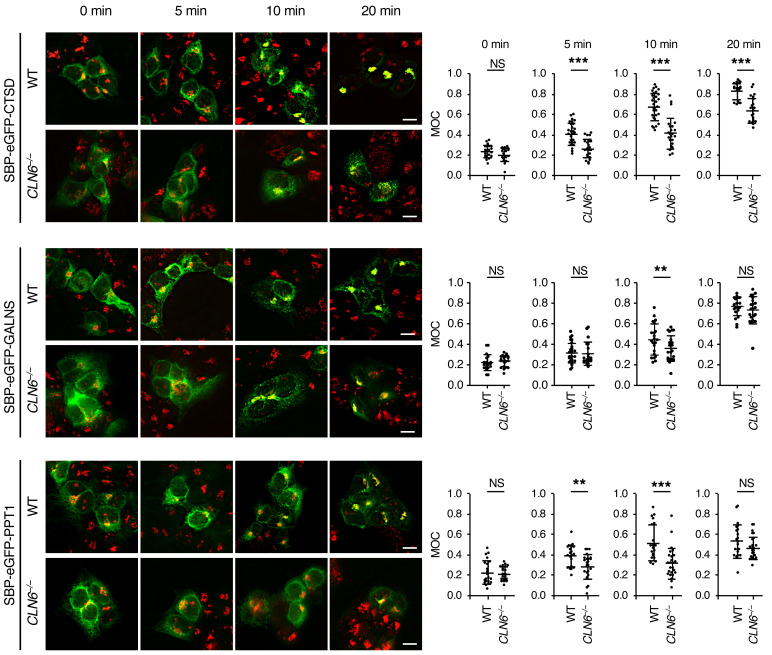
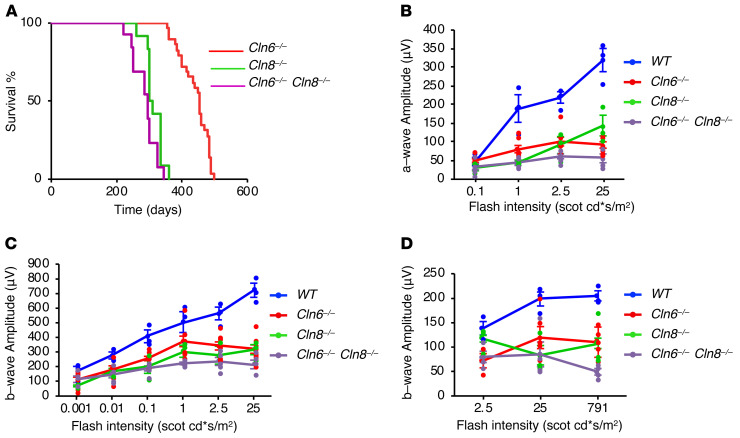
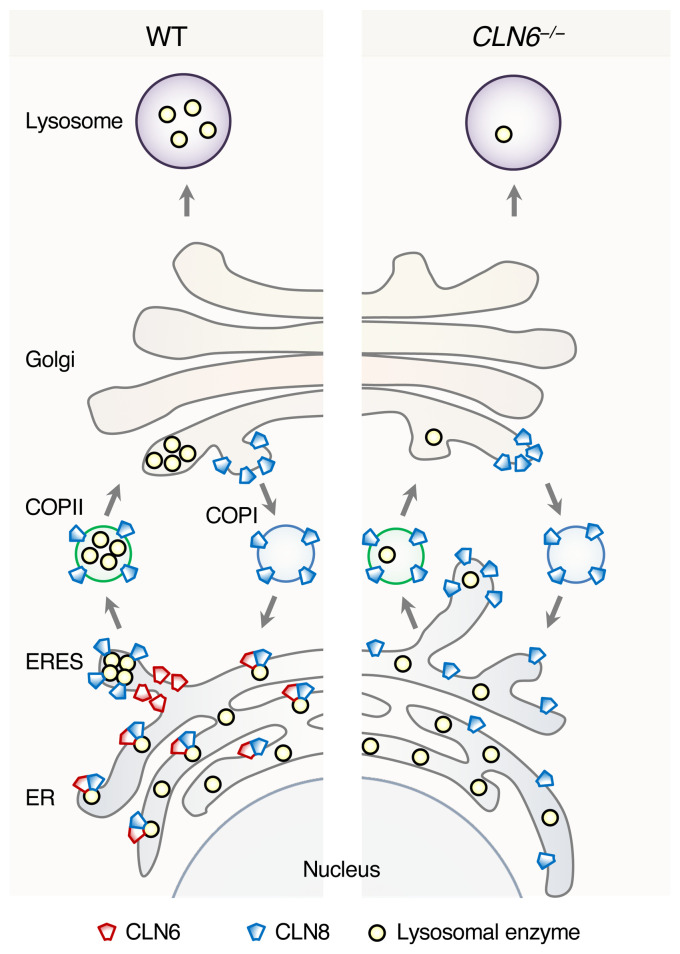
Lysosomal enzymes are synthesized in the endoplasmic reticulum (ER) and transferred to the Golgi complex by interaction with the Batten disease protein CLN8 (ceroid lipofuscinosis, neuronal, 8). Here we investigated the relationship of this pathway with CLN6, an ER-associated protein of unknown function that is defective in a different Batten disease subtype. Experiments focused on protein interaction and trafficking identified CLN6 as an obligate component of a CLN6-CLN8 complex (herein referred to as EGRESS: ER-to-Golgi relaying of enzymes of the lysosomal system), which recruits lysosomal enzymes at the ER to promote their Golgi transfer. Mutagenesis experiments showed that the second luminal loop of CLN6 is required for the interaction of CLN6 with the enzymes but dispensable for interaction with CLN8. In vitro and in vivo studies showed that CLN6 deficiency results in inefficient ER export of lysosomal enzymes and diminished levels of the enzymes at the lysosome. Mice lacking both CLN6 and CLN8 did not display aggravated pathology compared with the single deficiencies, indicating that the EGRESS complex works as a functional unit. These results identify CLN6 and the EGRESS complex as key players in lysosome biogenesis and shed light on the molecular etiology of Batten disease caused by defects in CLN6.

Keywords: Cell Biology; Genetic diseases; Lysosomes; Molecular pathology.


Conflict of interest statement

Conflict of interest: The authors have declared that no conflict of interest exists.

Figures

Figure 1
Figure 1. CLN6 deficiency results in the depletion of various lysosomal enzymes from the lysosomal compartment.
(A) Immunoblot analysis of lysosome-enriched fractions confirming depletion of lysosomal enzymes in Cln6–/– mice compared with WT mice. CTSDSC, single-chain processed form; CTSDMH, mature heavy form; CTSDML, mature light form. Blots were run in parallel. (B) Band intensities were quantified and normalized to LAMP1. Data are mean ± SEM (n = 3). (C) Enzymatic assay of TPP1, GBA, GLB1, GAA, and NAGLU in lysosome-enriched fractions from WT and Cln6–/– mice. Activity is expressed as relative fluorescence units compared with WT samples. Data are mean ± SEM (n = 3). (D) Expression analysis of lysosomal genes in the liver of 6-week-old WT and Cln6–/– mice. Shown are expression levels of genes in Cln6–/– mice expressed as fold change of levels in WT mice, normalized to the housekeeping gene Sp16. Data are mean ± SEM (n = 5). Statistical differences between groups were calculated using Student’s t test (B and C). NS, not statistically significant; *P < 0.05; **P < 0.01; ***P < 0.001.
Figure 2
Figure 2. CLN6 interacts with CLN8 in the ER and does not traffic to the Golgi complex.
(A) Shown is a live BiFC assay of CLN6 with CLN8 in the indicated YFP configurations. Green signals (reconstituted YFP) represent CLN6-CLN8 interaction. LMF1 is used as a negative control for interaction with CLN6. Scale bar: 200 μm. (B) Confocal microscopy analysis showing colocalization of reconstituted CLN6-Y2/Y1-CLN8 BiFC signal with the ER marker KDEL. Scale bar: 20 μm. (C) Co-IP analysis of transiently expressed, Y2-tagged CLN6 and endogenous, myc-tagged CLN8. The lysates were immunoprecipitated with both myc and GFP antibodies in separate experiments and analyzed by immunoblotting with the indicated antibodies. IgG antibodies were used as a control. Input represents 10% of the total cell extract used for IP. (D) In vitro COPII vesicle budding assay on digitonin-treated HeLa cell membranes incubated with the indicated combinations of ATP regenerating system, rat liver cytosol, collected donor membranes, and dominant-negative SAR1A H79G; 5% input of donor membranes is included. (E) Confocal microscopy analysis showing that CLN6 resides in the ER upon mutagenesis of a potential retrieval/retention signal (RRR to AAA). Trace outline is used for line-scan analysis of relative fluorescence intensity (RFI) of CLN6, GM130, and KDEL signals. Scale bar: 10 μm. (F) Pearson correlation analysis of the colocalization extent of full-length CLN6 or CLN6-AAA with KDEL or GM130. Data are mean ± SEM; n = 15 (ER/CLN6), n = 10 (ER/CLN6-AAA), n = 12 (Golgi/CLN6), n = 15 (Golgi/CLN6-AAA). Statistical differences between groups were calculated using Student’s t test.
Figure 3
Figure 3. The subcellular localizations of CLN6 and CLN8 are uncoupled from CLN6-CLN8 interaction.
(A) Confocal microscopy analysis showing ER localization of CLN6 and Golgi localization of CLN8 upon cotransfection of full-length CLN6 and retrieval-deficient CLN8. Trace outline is used for RFI line-scan analysis of CLN8, CLN6, Golgi-cherry and ER-cherry signals. Scale bars: 10 μm. (B) Pearson correlation analysis of the colocalization extent of CLN6 and CLN8 constructs with KDEL and GM130. Data are mean ± SEM; n = 11 (ER/CLN8), n = 10 (ER/CLN8dK), n = 10 (ER/CLN6 with CLN8 or CLN8dK), n = 10 (CLN6/CLN8), n = 10 (CLN6/CLN8dK), n = 12 (Golgi/CLN8), n = 15 (Golgi/CLN8dK), n = 11 (Golgi/CLN6 with CLN8), n = 18 (Golgi/CLN6 with CLN8dK), n = 10 (CLN6/CLN8), n = 14 (CLN6/CLN8dK). (C) Confocal microscopy showing that retrieval-deficient CLN8 (CLN8-RRXX, green signal) has partial colocalization with the Golgi marker GM130 (red) both in WT and CLN6–/– cells. Scale bar: 20 μm. Inset magnifications (×5) are reported. (D) Pearson correlation analysis showing partial colocalization of retrieval deficient CLN8dK (green signal) with the Golgi marker GM130 in WT and CLN6–/– cells. Data are mean ± SEM; n = 12 (WT), n = 11 (CLN6–/–). Statistical differences between groups were calculated using Student’s t test (B and D). NS, not statistically significant; ***P < 0.001.
Figure 4
Figure 4. CLN6 interacts with lysosomal enzymes.
(A) Co-IP analysis of CLN6 and lysosomal enzymes. Proteins were transiently expressed in HEK293T cells, and immunoprecipitates were analyzed by immunoblotting with the indicated antibodies. Molecular marker analysis indicates that CLN6 interacts with the enzymes’ precursors. Input represents 10% of the total cell extract used for IP. (B) Schematic representation of CLN6 protein. (C) Co-IP analysis of Y2-tagged CLN6 and myc-tagged CLN6. The proteins were transiently expressed in HEK293T cells, and immunoprecipitates were analyzed by immunoblotting with the indicated antibodies. Input represents 10% of the total cell extract used for IP. (D) Shown is a live BiFC assay of CLN6-Y1 with CLN6-Y2 in HeLa cells; expression of CLN6-Y1 is used as a negative control. Scale bar: 200 μm. (E) Confocal microscopy showing colocalization between reconstituted BiFC signal from CLN6-Y1/CLN6-Y2 dimerization (green) and the ER marker KDEL (red). Scale bar: 20 μm.
Figure 5
Figure 5. The second luminal loop of CLN6 is necessary for the interaction of CLN6 with the lysosomal enzymes.
(A) Shown are live BiFC assays of CLN6ΔL2-Y1 with CLN6-Y2, CLN6-Y1 with CLN6ΔL2-Y2, and CLN6ΔL2-Y1 with CLN6ΔL2-Y2 in HeLa cells. Scale bar: 200 μm. (B) Co-IP analysis of CLN6ΔL2 and lysosomal enzymes. Proteins were transiently expressed in HEK293T cells, and immunoprecipitates were analyzed by immunoblotting with the indicated antibodies. Input represents 10% of the total cell extract used for IP.
Figure 6
Figure 6. CLN6 and CLN8 are mutually necessary for their interaction with lysosomal enzymes.
(A) Co-IP analysis of myc-tagged CLN8 and Y2-tagged lysosomal enzymes (TPP1, CTSD, PPT1, and GALNS). Vectors were transiently transfected in WT and CLN6–/– HEK293T cells, and immunoprecipitates were analyzed by immunoblotting with the indicated antibodies. Input represents 10% of the total cell extract used for IP. (B) Co-IP analysis of myc-tagged CLN6 and Y2 tagged lysosomal enzymes (TPP1, CTSD, PPT1, and GALNS). Vectors were transiently transfected in WT and CLN8–/– HEK293T cells, and immunoprecipitates were analyzed by immunoblotting with the indicated antibodies. Input represents 10% of the total cell extract used for IP. (C) Flow cytometry quantification of Y1-CLN8/Y2-CLN8 BiFC signal in WT and CLN6–/– cells. Data are mean ± SEM (n = 3). (D) Flow cytometry quantification of CLN6-Y1/CLN6-Y2 BiFC signal in WT and CLN8–/– cells. Data are mean ± SEM (n = 3). Statistical differences between groups were calculated using Student’s t test (C and D).
Figure 7
Figure 7. CLN6 deficiency impairs trafficking of lysosomal enzymes.
Confocal microscopy analysis of WT and CLN6–/– HEK293T cells transfected with plasmids expressing enzymes fused with SBP-EGFP (SBP-EGFP-CTSD, SBP-EGFP-GALNS, and SBP-EGFP-PPT1) and streptavidin-KDEL ‘‘anchor’’ that retains SBP-containing proteins in the ER. Shown are representative images of cells without addition of biotin (0 minutes) and at 5, 10, and 20 minutes from the addition of biotin. Manders’ overlap coefficients (MOC) measuring the degree of colocalization between the test protein (green signal) and the Golgi marker GM130 (red signal) are reported. Data are mean ± SEM; WT cells, n = 21 (CTSD, 0 minutes), n = 27 (CTSD, 5 minutes), n = 30 (CTSD, 10 minutes), n = 20 (CTSD, 20 minutes), n = 20 (GALNS, 0 minutes), n = 30 (GALNS, 5 minutes), n = 22 (GALNS, 10 minutes), n = 20 (GALNS, 20 minutes), n = 21 (PPT1, 0 minutes), n = 21 (PPT1, 5 minutes), n = 20 (PPT1, 10 minutes), n = 21 (PPT1, 20 minutes); CLN6–/– cells, n = 20 (CTSD, 0 minutes), n = 23 (CTSD, 5 minutes), n = 23 (CTSD, 10 minutes), n = 21 (CTSD, 20 minutes), n = 22 (GALNS, 0 minutes), n = 21 (GALNS, 5 minutes), n = 22 (GALNS, 10 minutes), n = 22 (GALNS, 20 minutes), n = 20 (PPT1, 0 minutes), n = 23 (PPT1, 5 minutes), n = 25 (PPT1, 10 minutes), n = 24 (PPT1, 20 minutes). Statistical differences between groups were calculated using Student’s t test. NS, not statistically significant; **P < 0.01; ***P < 0.001. Scale bars: 100 μm.
Figure 8
Figure 8. Combined deficiency of CLN6 and CLN8 in mice does not accelerate disease progression compared with single deficiencies.
(A) Life span analysis of Cln6–/– (n = 29), Cln8–/– (n = 12), and Cln6–/– Cln8–/– (n = 13) mice. (B) Graph of a-wave amplitudes of scotopic ERG waveforms from WT (n = 3), Cln6–/– (n = 8), Cln8–/– (n = 3), and Cln6–/– Cln8–/– (n = 5) mice in response to a series of light stimuli. (C) Graph of b-wave amplitudes of scotopic ERG waveforms from WT (n = 3), Cln6–/– (n = 8), Cln8–/– (n = 3), and Cln6–/– Cln8–/– (n = 5) mice. (D) Graph of b-wave amplitudes of photopic ERG waveforms from WT (n = 3), Cln6–/– (n = 6), Cln8–/– (n = 3), and Cln6–/– Cln8–/– (n = 4) mice.
Figure 9
Figure 9. Schematic model of ER-to-Golgi lysosome enzyme trafficking.
Shown is a comparison between WT conditions and deficiency of CLN6.

References

    1. Hu YB, Dammer EB, Ren RJ, Wang G. The endosomal-lysosomal system: from acidification and cargo sorting to neurodegeneration. Transl Neurodegener. 2015;4:18. - PMC - PubMed
    1. Bajaj L, Lotfi P, Pal R, Ronza AD, Sharma J, Sardiello M. Lysosome biogenesis in health and disease. J Neurochem. 2019;148(5):573–589. doi: 10.1111/jnc.14564. - DOI - PMC - PubMed
    1. Rohrer J, Kornfeld R. Lysosomal hydrolase mannose 6-phosphate uncovering enzyme resides in the trans-Golgi network. Mol Biol Cell. 2001;12(6):1623–1631. - PMC - PubMed
    1. di Ronza A, et al. CLN8 is an endoplasmic reticulum cargo receptor that regulates lysosome biogenesis. Nat Cell Biol. 2018;20(12):1370–1377. doi: 10.1038/s41556-018-0228-7. - DOI - PMC - PubMed
    1. Lonka L, Kyttälä A, Ranta S, Jalanko A, Lehesjoki AE. The neuronal ceroid lipofuscinosis CLN8 membrane protein is a resident of the endoplasmic reticulum. Hum Mol Genet. 2000;9(11):1691–1697. doi: 10.1093/hmg/9.11.1691. - DOI - PubMed

Publication types

MeSH terms