. 2020 Aug 3;219(8):e202002175.
doi: 10.1083/jcb.202002175.

Interferon-stimulated gene 15 accelerates replication fork progression inducing chromosomal breakage

Affiliations

Interferon-stimulated gene 15 accelerates replication fork progression inducing chromosomal breakage

Maria Chiara Raso et al. J Cell Biol. .

Abstract

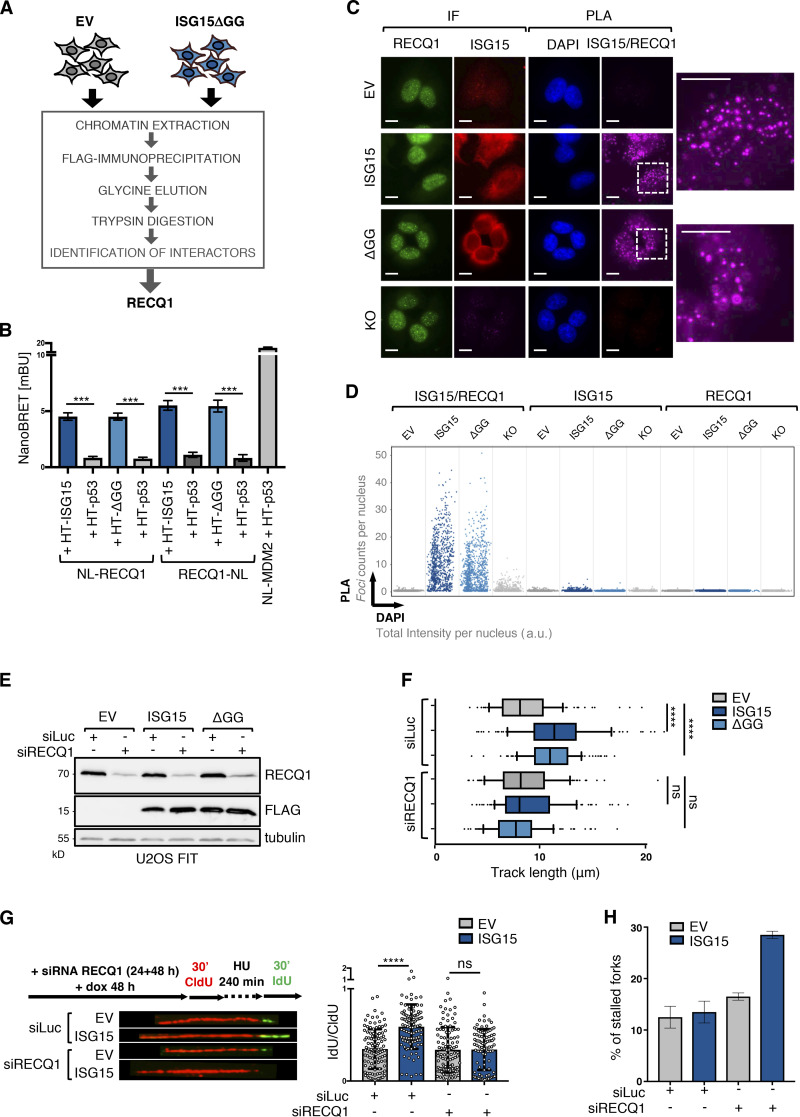
DNA replication is highly regulated by the ubiquitin system, which plays key roles upon stress. The ubiquitin-like modifier ISG15 (interferon-stimulated gene 15) is induced by interferons, bacterial and viral infection, and DNA damage, but it is also constitutively expressed in many types of cancer, although its role in tumorigenesis is still largely elusive. Here, we show that ISG15 localizes at the replication forks, in complex with PCNA and the nascent DNA, where it regulates DNA synthesis. Indeed, high levels of ISG15, intrinsic or induced by interferon-β, accelerate DNA replication fork progression, resulting in extensive DNA damage and chromosomal aberrations. This effect is largely independent of ISG15 conjugation and relies on ISG15 functional interaction with the DNA helicase RECQ1, which promotes restart of stalled replication forks. Additionally, elevated ISG15 levels sensitize cells to cancer chemotherapeutic treatments. We propose that ISG15 up-regulation exposes cells to replication stress, impacting genome stability and response to genotoxic drugs.


Figures

Figure 1.
Figure 1.
ISG15 localizes at the DNA replication forks and accelerates replication fork progression. (A) ISG15 immunoblot on protein extracts of U2OS FIT cells bearing EV or FLAG-ISG15, induced with doxycycline (dox; 1 µg/ml) for 48 h, and in parental U2OS treated with IFN-β (30 U/ml for 2 h) and chased in medium without IFN-β for 46 h before lysis. GAPDH immunoblotting is used to normalize protein loading. (B) Analysis of proteins associated with nascent DNA, isolated by iPOND. HEK293T cells transfected with EV or myc-ISG15 for 24 h were pulse-labeled with EdU for 10 min and then chased with thymidine for 60 min. Immunoblotting with the indicated antibodies reveals the presence of ISG15 on chromatin (H3-positive fraction) and at the replication forks (H3- and PCNA-positive fraction). (C) Representative images of ISG15 colocalization with PCNA (ISG15/PCNA), as revealed by PLA. Immunofluorescence (IF) shows protein expression and cellular distribution of ISG15 and PCNA in U2OS FIT cells (treated with 1 µg/ml doxycycline for 48 h). Scale bars, 10 µm. (D) QIBC shows the distribution of PLA foci counts of samples described in C. For each condition, images containing ≥1,000 cells per experiment were acquired (n = 3). (E) Representative images of ISG15 colocalization with newly synthesized DNA (ISG15/EdU), labeled by the nucleotide analogue EdU (1 µM, 8 min), as revealed by PLA. Immunofluorescence (IF) shows cellular distribution of ISG15 and EdU in U2OS FIT cells (treated with 1 µg/ml doxycycline for 48 h). Scale bars, 10 µm. (F) QIBC shows the distribution of PLA foci counts of samples described in E. For each condition, images containing ≥1,000 cells per experiment were acquired (n = 3). (G) Top: DNA fibers labeling strategy and representative image. Bottom: Analysis of IdU track length measurements in U2OS FIT cells expressing EV or FLAG-ISG15 (treated with 1 µg/ml doxycycline for 48 h). At least 100 tracks were scored per sample (n = 5). Vertical lines represent the median value, and boxes and whiskers show 10–90th percentiles. Statistical analysis according to Mann–Whitney test; ns, not significant; ****, P < 0.0001. (H) FLAG-ISG15 expression in U2OS FIT cells after induction with 1 µg/ml doxycycline for the indicated time points. (I) Analysis of IdU track length measurements in U2OS FIT cells upon ISG15 induction as in H. At least 100 tracks were scored per sample (n = 3).
Figure S1.
Figure S1.
ISG15 localizes at the DNA replication forks and accelerates replication fork progression. (A) Schematic representation of the pipeline followed for the generation of CRISPR/Cas9-mediated ISG15 KO cell lines. (B) Analysis of ISG15 protein levels in 7 of the 42 single clones tested, obtained from the CRISPR/Cas9 KO in U2OS FIT cells. Clone D3 was selected and used for the following experiments (in the main text referred to as U2OS ISG15/KO). 50 µg cell extracts was analyzed by Western blotting as indicated. (C) Subcellular localization of ISG15 in U2OS FIT cells expressing EV or FLAG-ISG15 after 48 h induction with 1 µg/ml doxycycline. Indicated are the different fractions analyzed. (D) Quantification of PLA foci counts by automated microscopy (QIBC) of FLAG-ISG15 colocalization with PCNA (FLAG/PCNA) determined by PLA in U2OS FIT cells after induction with 1 µg/ml doxycycline for 48 h. For each condition, images containing ≥1,000 cells per experiment were acquired (n = 3). (E) U2OS FIT cells after doxycycline induction (1 µg/ml, 48 h) and grown in media supplemented with 10 µM EdU for 30 min before collecting and processing for FACS analysis. Left: DNA content (DAPI) and DNA synthesis, indicated by EdU incorporation (FITC) measured by FACS. Right: Quantification of EdU incorporation of cells in S phase. Similar results were obtained in at least one independent experiment. (F) Percentage of origin firing events in U2OS FIT expressing either the EV or FLAG-ISG15 after doxycycline induction (1 µg/ml, 48 h). Origin firing events were evaluated by fibers assay (IdU-CldU-IdU) scoring ≥200 DNA fibers per experiment; each point indicates a single experiment. The line connects values for EV and FLAG-ISG15 of the same experiment. (G) Graphical scheme of sister forks imaging by DNA fiber assay with representative image. (H) Sister forks symmetry plot in U2OS FIT cells after doxycycline induction (1 µg/ml, 48 h). U2OS FIT cells expressing EV were treated with CPT (50 nM, 1 h; EV + CPT) as a positive control for asymmetry. Each fork is described by the length of left and right IdU tracks. Red lines define a range of 30% difference between left and right tracks; left > right + 30% and right > left + 30% are considered asymmetric. Similar results were obtained in at least one independent experiment.
Figure 2.
Figure 2.
ISG15 expression levels impact on replication fork progression in different systems. (A) Time course of ISG15 expression in U2OS treated with IFN-β (30 U/ml, 2 h) and chased for the indicated time points before lysis. (B) Analysis of IdU track length measurements in U2OS cells treated with IFN-β as in A. At least 100 tracks were scored per sample (n = 3). (C) ISG15 protein levels in U2OS FIT cells carrying ISG15 WT or ISG15 KO treated with IFN-β (30 U/ml, 2 h) and chased for 46 h before lysis. Phosphorylated STAT1 (pSTAT1) reveals activation of IFN-β pathway. Immunoblot with STAT1 and GAPDH are used to normalize protein loading. (D) Top: DNA fiber–labeling strategy. Bottom: Analysis of IdU track length measurements in U2OS as in C. At least 100 tracks were scored per sample (n = 3). Vertical lines represent the median value, and boxes and whiskers show 10–90th percentiles. Statistical analysis according to Mann–Whitney test; ns, not significant; ****, P < 0.0001. (E) ISG15 immunoblot of parental U2OS FIT cells expressing EV or FLAG-ISG15 and U2OS FIT cells lacking the endogenous ISG15 (U2OS ISG15/KO) and reexpressing stably integrated EV or exogenous FLAG-ISG15 after 48 h induction with 1 µg/ml doxycycline. Western blot analysis reveals the expression of endogenous (black triangle) and exogenous (white triangle) ISG15. (F) Analysis of IdU track length measurements in U2OS as in (E). At least 100 tracks were scored per sample (n = 3). Vertical lines represent the median value, and boxes and whiskers show 10–90th percentiles. Statistical analysis according to Mann–Whitney test; ****, P < 0.0001. (G) Top: ISG15 expression in MCF7 cells carrying ISG15 WT or ISG15 KO treated with IFN-β (30 U/ml, 2 h) and chased for 46 h before lysis. Bottom: Analysis of IdU track length measurements. At least 100 tracks were scored per sample (n = 3). Vertical lines represent the median value, and boxes and whiskers show 10–90th percentiles. Statistical analysis according to Mann–Whitney test; ****, P < 0.0001; *, P < 0.05. (H) Top: ISG15 protein levels in MCF7 cells bearing the WT gene of ISG15 (MCF7) and cells lacking the endogenous ISG15 (MCF7 ISG15/KO) stably integrated with EV or FLAG-ISG15. Bottom: Analysis of IdU track length measurements. At least 100 tracks were scored per sample (n = 3). Vertical lines represent the median value, and boxes and whiskers show 10–90th percentiles. Statistical analysis according to Mann–Whitney test; ****, P < 0.0001; *, P < 0.05. (I) ISG15 knockdown (siISG15) 48 h after siRNA transfection in HeLa, T98G, and M059K cells. siLuc is used as control. (J) Analysis of IdU track length measurements as in I. At least 100 tracks were scored per sample (n = 3). Vertical lines represent the median value, and boxes and whiskers show 10–90th percentiles. Statistical analysis according to Mann–Whitney test; ****, P < 0.0001.
Figure S2.
Figure S2.
ISG15 expression levels impact replication fork progression in different systems. (A) Analysis of ISG15 protein levels in 12 of the 41 single clones tested, obtained from the CRISPR/Cas9 KO in MCF7 cells. Clone 1E was selected and used for the following experiments (in the main text referred to as MCF7 ISG15/KO). (B) ISG15 immunoblot on different cellular system/conditions used in our experiments and several cancer cell lines. HeLa were derived from cervical carcinoma; LS174T, SW620, and HT-29 were derived from colon cancer; M059K and T98G were derived from glioblastoma; DU145 and LNCaP were derived from prostate cancer. (C) Test of ISG15 knockdown efficiency in different cancer cell lines. Cells were transfected with siISG15 or siLuc as a control and collected after 24 h, and ISG15 levels were evaluated by Western blot analysis.
Figure 3.
Figure 3.
Accelerated replication fork progression in cells expressing high levels of ISG15 is largely conjugation independent. (A) ISG15 immunoblot of U2OS FIT cells bearing EV, FLAG-ISG15, or FLAG-ISG15ΔGG after 48-h induction with 1 µg/ml doxycycline (dox). (B) The effect of ISG15 on DNA replication was assessed by using DNA fiber assay in parental U2OS FIT cells (as in A) and U2OS FIT cells (ISG15 KO [U2OS ISG15/KO]; see Fig. S3 A) expressing EV, FLAG-ISG15, or FLAG-ISG15ΔGG after doxycycline induction (1 µg/ml, 48 h). At least 100 tracks were scored per sample (n = 3). Vertical lines represent the median value, and boxes and whiskers show 10–90th percentiles. Statistical analysis according to Mann–Whitney test; ns, not significant; ****, P < 0.0001; ***, P < 0.001. (C) Colocalization of FLAG-ISG15 and FLAG-ISG15ΔGG with PCNA (FLAG/PCNA) in U2OS FIT cells induced for 48 h with 1 µg/ml doxycycline determined by PLA. QIBC shows the distribution of PLA foci counts. For each condition, images containing ≥1,000 cells per experiment were acquired (n = 3). (D) Representation of 3D structure of N-terminal ubiquitin-like domain (N-lobe) of ISG15 and ubiquitin (Protein Data Bank accession nos. 1Z2M and 1UBQ, respectively). The residues corresponding to the hydrophobic patches are indicated. (E) U2OS FIT cells were transfected with EV, FLAG-ISG15 wild type and ISG15 mutants carrying the indicated single amino acid substitutions (L10A, L72A, and V74A) or the combination of them (LLVAAA). (F) Analysis of IdU track length measurements as in E. At least 100 tracks were scored per sample (n = 3). Vertical lines represent the median value, and boxes and whiskers show 10–90th percentiles. Statistical analysis according to Mann–Whitney test; ns, not significant; ****, P < 0.0001.
Figure S3.
Figure S3.
Accelerated replication fork progression in cells expressing high levels of ISG15 is largely conjugation independent. (A) ISG15 immunoblot on U2OS FIT cells expressing EV or FLAG-ISG15 and in U2OS FIT cells lacking the endogenous ISG15 (U2OS ISG15/KO) and reexpressing EV, FLAG-ISG15, or FLAG-ISG15ΔGG after doxycycline induction (1 µg/ml, 48 h). (B) Quantification of EdU incorporation in S phase of U2OS FIT cells expressing EV or FLAG-ISG15ΔGG after doxycycline induction (1 µg/ml, 48 h) and grown in the presence of EdU (10 µM for 30 min) before collecting and processing for FACS analysis. Similar results were obtained in at least one independent experiment. (C) Fork asymmetry analysis in U2OS FIT expressing EV or FLAG-ISG15ΔGG after doxycycline induction (1 µg/ml, 48 h). Each fork is described by the length of left and right IdU tracks. Red lines define a range of 30% difference between left and right tracks; left > right + 30% and right > left + 30% are considered asymmetric. Similar results were obtained in at least one independent experiment. (D) Left: Cell cycle profile of U2OS FIT cells expressing EV, FLAG-ISG15, or FLAG-ISG15ΔGG after 48-h induction with doxycycline. Right: Percentage of cell distribution in different cell cycle phases. (E) Sequence alignment of human ISG15 and ubiquitin (UB). The N- and C-lobes are indicated by bars. The conserved residues are in red. The residues that are part of the hydrophobic patch are indicated by asterisks (*). (F) Localization of ISG15 in U2OS FIT cells after doxycycline induction (1 µg/ml, 48 h). ISG15 immunostaining was performed after preextraction and MeOH fixation. Scale bars, 10 µm. (G) The indicated forms of ISG15 were expressed in HEK293T cells with or without the ISGylation machinery components UBE1L (E1), UBCH8 (E2), and HERC5 (E3). After 48 h, cell extracts were collected for Western blot analysis with the indicated antibodies.
Figure S4.
Figure S4.
Increased replication fork progression by ISG15 depends on RECQ1 and leads to unrestrained DNA replication and DNA breakages. (A) FLAG-immunoblot on protein extracts derived from cytosolic or nuclear fractions of U2OS FIT cells expressing EV or FLAG-ISG15ΔGG. Lamin A and GAPDH are used as controls of fractionation and loading. (B) FLAG-ISG15 was immunoprecipitated (IP FLAG) from nuclear extracts as in A and analyzed by FLAG immunoblot. Sn, supernatant after immunoprecipitation. (C) FLAG immunoprecipitation as in B, detected by Coomassie blue staining. The band corresponding to FLAG-ISG15ΔGG is indicated. HL and LC represent heavy and light chain of the FLAG antibody, respectively. (D) Anti-HA immunoprecipitation from HEK293T cells expressing HA-RecQ1 and myc-ISG15 followed by immunoblot with the indicated antibodies. TCL, total cell extracts. (E) HEK293T cells were transfected with 2 µg expression constructs of indicated proteins. Immunoblot was used to detect HaloTag, NanoLuc, and GAPDH. (F) RECQ1 protein levels in U2OS FIT expressing FLAG-ISG15 after induction with 1 µg/ml doxycycline (dox) for different time points indicated. Vinculin immunoblot is used as loading control. (G) Effect of 1 µM cisplatin (CDDP) or 0.5 mM HU treatment on U2OS FIT cells expressing EV, FLAG-ISG15, or FLAG-ISG15ΔGG after induction with 1 µg/ml doxycycline for 48 h. UN, untreated. Drug effect (IdU + drug) is normalized on CldU track length in untreated conditions. At least 100 tracks were scored per sample (n = 3). (H) Neutral comet assay to measure DNA double-strand breaks in U2OS FIT cells expressing EV, FLAG-ISG15, or FLAG-ISG15ΔGG after induction with 1 µg/ml doxycycline for 7 d and treated with 50 nM CPT (n = 3). Statistical analysis according to Mann–Whitney test; ****, P < 0.0001.
Figure 4.
Figure 4.
Increase of replication fork progression by ISG15 depends on the functional interaction with RECQ1. (A) Chromatin extracts were obtained from U2OS FIT cells expressing EV or FLAG-ISG15ΔGG and processed as indicated for mass spectrometry analysis. (B) ISG15 interaction with RECQ1 was measured as luminescence signal by NanoBRET in HEK293T cells that were cotransfected with HaloTag-Fusion constructs of ISG15 (HT-ISG15) and RECQ1 fused to NanoLuc at N-terminus (NL-RECQ1) or C-terminus (RECQ1-NL; n = 3). HT-p53 and NL-MDM2 are used as controls. (C) Representative images of colocalization of FLAG-ISG15 and FLAG-ISG15ΔGG with endogenous RECQ1 (ISG15/RECQ1) in U2OS FIT cells after doxycycline induction (1 µg/ml, 48 h), assessed by PLA. Scale bars, 10 µm. (D) QIBC shows the distribution of PLA foci counts of samples described in C. For each condition, images containing ≥1,000 cells per experiment were acquired (n = 3). (E) FLAG-ISG15 and RECQ1 protein levels in U2OS FIT cells expressing EV, FLAG-ISG15, or FLAG-ISG15ΔGG after doxycycline induction (1 µg/ml, 48 h) and upon knockdown of RECQ1 by siRNA transfection. siLuc is used as control. (F) Analysis of IdU track length measurements as in E. At least 100 tracks were scored per sample (n = 3). Vertical lines represent the median value, and boxes and whiskers show 10–90th percentiles. Statistical analysis according to Mann–Whitney test; ns, not significant; ****, P < 0.0001. (G) Left: DNA fiber–labeling strategy to determine fork restart and representative images. Right: Fork restart speed (IdU) normalized on fork speed (CldU) in U2OS FIT cells upon RECQ1 knockdown after doxycycline induction (1 µg/ml, 48 h) as described in the scheme. At least 100 tracks were scored per sample (n = 3). Statistical analysis according to Mann–Whitney test; ns, not significant; ****, P < 0.0001. (H) Percentage of stalled forks after HU washout in U2OS FIT cells described in G.
Figure 5.
Figure 5.
High levels of ISG15 unleash DNA replication, induce DNA breakages and sensitize cells to genotoxic stress. (A) Top: Schematic representation of DNA fiber assay strategy. Bottom: Effect of CPT treatment (50 nM), optionally added concomitantly with the second label (IdU), in U2OS FIT cells expressing EV, FLAG-ISG15 or FLAG-ISG15ΔGG after doxycycline induction (1 µg/ml, 48 h). Drug effect (IdU + CPT) is normalized on CldU track length in untreated conditions. At least 100 tracks were scored per sample (n = 3). Horizontal lines represent the median value, and boxes and whiskers show 10–90th percentiles. Statistical analysis according to Mann–Whitney test; ns, not significant; ****, P < 0.0001. (B) Analysis of IdU track length measurements in cells treated as in (A). At least 100 tracks were scored per sample (n = 3). Vertical lines represent the median value, and boxes and whiskers show 10–90th percentiles. Statistical analysis according to Mann–Whitney test; ns, not significant; ****, P < 0.0001. (C) Effect of CPT treatment (50 nM) in U2OS FIT cells expressing EV or FLAG-ISG15 after dox-induction (1 µg/ml, 48 h) and upon RECQ1 knockdown (siRECQ1). Drug effect (IdU + CPT) is normalized on CldU track length in untreated conditions. At least 100 tracks were scored per sample (n = 3). Horizontal lines represent the median value, and boxes and whiskers show 10–90th percentiles. Statistical analysis according to Mann–Whitney test; ns, not significant; ****, P < 0.0001. (D) Neutral comet assay to measure accumulation of DNA double strand breaks in U2OS FIT cells expressing EV, FLAG-ISG15 or FLAG-ISG15ΔGG induced with doxycycline (1 µg/ml) for 48 h and treated with CPT (50 nM; n = 3). (E) Quantification of chromosomal abnormalities by analysis of metaphase spreads of U2OS FIT cells expressing EV, FLAG-ISG15, or FLAG-ISG15ΔGG after doxycycline induction (1 µg/ml, 48 h) and treated with CPT (50 nM). At least 50 metaphases/sample were scored for every replicate. Each spot represents average of one replicate (n = 3). (F) Representative image of chromosomal abnormalities quantified in E. Scale bar of 10 µm is indicated. (G and H) Survival curve determined by clonogenic assay of U2OS FIT cells expressing EV or FLAG-ISG15 and treated with increasing doses of CPT (G) and the PARP inhibitor Olaparib (H). Values are normalized on untreated and EV (n = 3).

Comment in

  • ISG15 fast-tracks DNA replication.
    Meroni A, Vindigni A. Meroni A, et al. J Cell Biol. 2020 Aug 3;219(8):e202007028. doi: 10.1083/jcb.202007028. J Cell Biol. 2020. PMID: 32687143 Free PMC article.

References

    1. Andersen J.B., Aaboe M., Borden E.C., Goloubeva O.G., Hassel B.A., and Orntoft T.F.. 2006. Stage-associated overexpression of the ubiquitin-like protein, ISG15, in bladder cancer. Br. J. Cancer. 94:1465–1471. 10.1038/sj.bjc.6603099 - DOI - PMC - PubMed
    1. Bektas N., Noetzel E., Veeck J., Press M.F., Kristiansen G., Naami A., Hartmann A., Dimmler A., Beckmann M.W., Knüchel R., et al. . 2008. The ubiquitin-like molecule interferon-stimulated gene 15 (ISG15) is a potential prognostic marker in human breast cancer. Breast Cancer Res. 10:R58 10.1186/bcr2117 - DOI - PMC - PubMed
    1. Berti M., and Vindigni A.. 2016. Replication stress: getting back on track. Nat. Struct. Mol. Biol. 23:103–109. 10.1038/nsmb.3163 - DOI - PMC - PubMed
    1. Berti M., Ray Chaudhuri A., Thangavel S., Gomathinayagam S., Kenig S., Vujanovic M., Odreman F., Glatter T., Graziano S., Mendoza-Maldonado R., et al. . 2013. Human RECQ1 promotes restart of replication forks reversed by DNA topoisomerase I inhibition. Nat. Struct. Mol. Biol. 20:347–354. 10.1038/nsmb.2501 - DOI - PMC - PubMed
    1. Brown J.S., and Jackson S.P.. 2015. Ubiquitylation, neddylation and the DNA damage response. Open Biol. 5 150018 10.1098/rsob.150018 - DOI - PMC - PubMed

Publication types

MeSH terms