

Spatial distribution and determinants of abortion among reproductive age women in Ethiopia, evidence from Ethiopian Demographic and Health Survey 2016 data: Spatial and mixed-effect analysis
- PMID: 32598398
- PMCID: PMC7323954
- DOI: 10.1371/journal.pone.0235382
Spatial distribution and determinants of abortion among reproductive age women in Ethiopia, evidence from Ethiopian Demographic and Health Survey 2016 data: Spatial and mixed-effect analysis
Abstract
Background: Unsafe abortion remains a global public health concern and it is the leading cause of maternal mortality and morbidity. Despite the efforts made to improve maternal health care service utilization, unsafe abortion yet constitutes the highest maternal mortality in Sub-Saharan Africa (SSA) including Ethiopia. Although abortion among reproductive-age women is a common problem in Ethiopia, there is limited evidence about the spatial distribution and determinants of abortion. Therefore, this study aimed to investigate the spatial distribution and determinants of abortion among reproductive-age women in Ethiopia.
Methods: A secondary data analysis was conducted using the 2016 Ethiopian Demographic and Health Survey (EDHS) data. A total of 12378 reproductive-age women were included in this study. The Bernoulli model was fitted using SaTScan version 9.6 statistical software to identify significant hotspot areas of abortion and ArcGIS version 10.6 statistical software was used to explore the spatial distributions of abortion. For the determinant factors, a mixed effect logistic regression model was fitted to take into account the hierarchical nature of the EDHS data. Deviance (-2LL), AIC, BIC, and ICC were used for model comparison. The AOR with a 95% CI was estimated for the potential determinants of abortion.
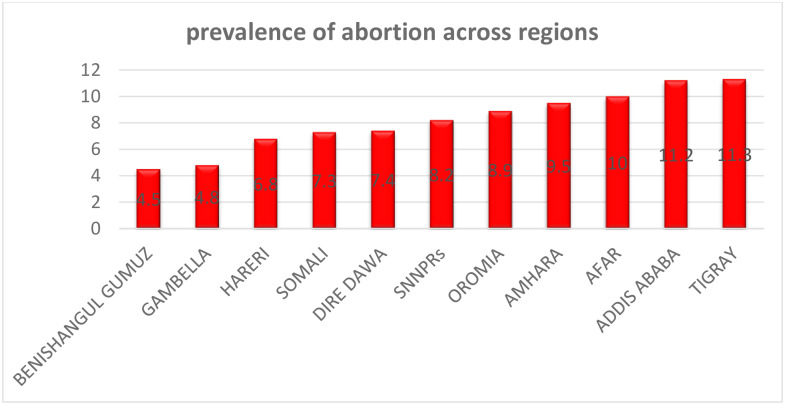
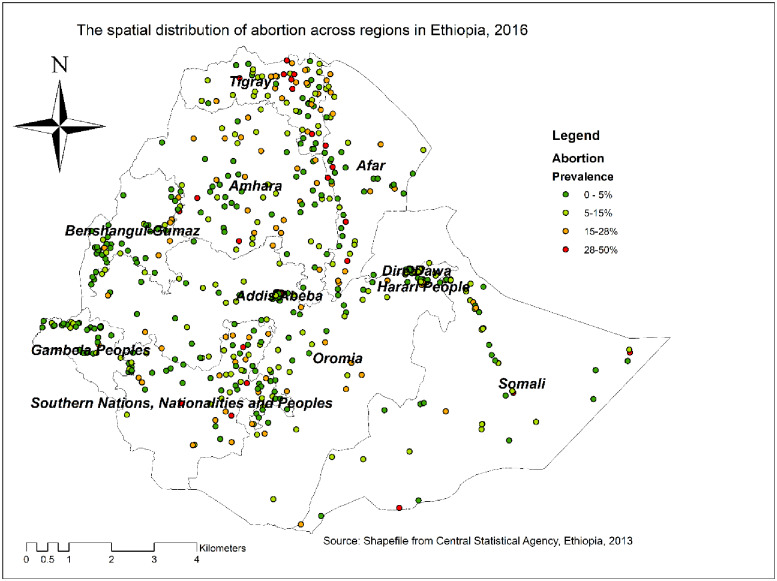
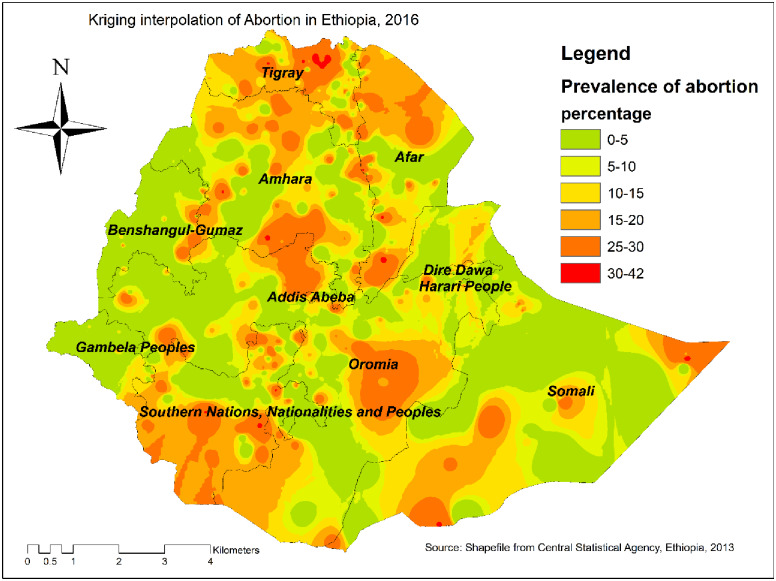
Results: The overall prevalence of abortion in Ethiopia was 8.9% ranging from 4.5% in Benishangul to 11.3% in Tigray regions. The spatial analysis revealed that abortion was significantly varied across the country. The SaTScan analysis identified a total of 60 significant clusters, of these 19 clusters were primary clusters. The primary clusters were located in the northern part of the Tigray region (LLR = 26.6, p<0.01; RR = 2.63). In the multivariable mixed-effect logistic regression analysis; primary education [AOR = 1.36; 95% CI: 1.13, 1.64], rural residence [AOR = 4.96; 95% CI: 3.42, 7.18], protestant religion follower [AOR = 0.56; 95% CI: 0.42, 0.75], richest wealth status [AOR = 1.72; 95% CI: 1.24, 2.40], maternal age 45-49 years [AOR = 3.12; 95% CI: 1.52, 6.44], listening radio [AOR = 1.27; 1.01, 1.60], and watching television [AOR = 1.45; 1.04, 2.01] were significant determinants of abortion.
Conclusions: The prevalence of abortion remains unacceptably high in Ethiopia. The spatial distribution of abortion has been significantly varied across regions in Ethiopia. Having primary education, being rural, having media exposure, and being from the richest household were significantly associated with higher odds of abortion whereas being protestant religious followers were associated with lower odds of abortion. Therefore, the government should design public health programs targeting the identified hotspot areas of abortion and should scale up maternal health programs in rural areas, to reduce maternal morbidity and mortality.
Conflict of interest statement
The authors have declared that no competing interests exist.
Figures

Similar articles
-
Individual and community-level determinants, and spatial distribution of institutional delivery in Ethiopia, 2016: Spatial and multilevel analysis.PLoS One. 2020 Nov 12;15(11):e0242242. doi: 10.1371/journal.pone.0242242. eCollection 2020. PLoS One. 2020. PMID: 33180845 Free PMC article.
-
Effect of mass media on comprehensive knowledge of HIV/AIDS and its spatial distribution among reproductive-age women in Ethiopia: a spatial and multilevel analysis.BMC Public Health. 2020 Sep 17;20(1):1420. doi: 10.1186/s12889-020-09536-1. BMC Public Health. 2020. PMID: 32943042 Free PMC article.
-
Spatial clusters distribution and modelling of health care autonomy among reproductive-age women in Ethiopia: spatial and mixed-effect logistic regression analysis.BMC Health Serv Res. 2021 Jan 20;21(1):74. doi: 10.1186/s12913-020-06052-1. BMC Health Serv Res. 2021. PMID: 33472619 Free PMC article.
-
Applied nutritional investigation spatial variation and determinants of stunting among children aged less than 5 y in Ethiopia: A spatial and multilevel analysis of Ethiopian Demographic and Health Survey 2019.Nutrition. 2022 Nov-Dec;103-104:111786. doi: 10.1016/j.nut.2022.111786. Epub 2022 Jul 1. Nutrition. 2022. PMID: 35970098 Review.
-
Utilization and its factors of post abortion modern contraceptive in Ethiopia: a systematic review and meta-analysis.Reprod Health. 2021 Jul 3;18(1):143. doi: 10.1186/s12978-021-01195-8. Reprod Health. 2021. PMID: 34217317 Free PMC article.
Cited by
-
Association of alcohol consumption with abortion among ever-married reproductive age women in Ethiopia: A multilevel analysis.Front Glob Womens Health. 2022 Dec 14;3:1028166. doi: 10.3389/fgwh.2022.1028166. eCollection 2022. Front Glob Womens Health. 2022. PMID: 36589150 Free PMC article.
-
Spatial distribution of pregnancy and early motherhood among late adolescent girls in Ethiopia using data from the Ethiopia Demographics and Health Survey 2019: Spatial and multilevel analyses.PLoS One. 2024 Aug 1;19(8):e0306170. doi: 10.1371/journal.pone.0306170. eCollection 2024. PLoS One. 2024. PMID: 39088572 Free PMC article.
-
Pregnancy termination and determinant factors among women of reproductive age in Kenya, evidence from Kenyan Demographic and Health Survey 2022: Multilevel analysis.Womens Health (Lond). 2024 Jan-Dec;20:17455057241285194. doi: 10.1177/17455057241285194. Womens Health (Lond). 2024. PMID: 39340296 Free PMC article.
-
Regional and residential disparities in knowledge of abortion legality and availability of facility-based abortion services in Ethiopia.Contracept X. 2021 Jun 22;3:100066. doi: 10.1016/j.conx.2021.100066. eCollection 2021. Contracept X. 2021. PMID: 34278291 Free PMC article.
-
Pooled prevalence of induced abortion and associated factors among reproductive age women in sub-Saharan Africa: a Bayesian multilevel approach.Arch Public Health. 2025 Jun 18;83(1):159. doi: 10.1186/s13690-025-01656-7. Arch Public Health. 2025. PMID: 40533838 Free PMC article.
References
-
- Singh S, Remez L, Sedgh G, Kwok L, Onda T. Abortion worldwide 2017: uneven Progress and unequal AccessAbortion worldwide 2017: uneven Progress and unequal Access. 2018.
-
- Ronsmans C, Graham WJ, group LMSSs. Maternal mortality: who, when, where, and why. The lancet. 2006;368(9542):1189–200. - PubMed
-
- Khan KS, Wojdyla D, Say L, Gülmezoglu AM, Van Look PF. WHO analysis of causes of maternal death: a systematic review. The lancet. 2006;367(9516):1066–74. - PubMed
MeSH terms
LinkOut - more resources
Full Text Sources
Medical
Research Materials
