

Comparative Study
doi: 10.1016/j.ijid.2020.06.075.
Epub 2020 Jun 26.
Comparing COVID-19 and the 1918-19 influenza pandemics in the United Kingdom
Affiliations
- PMID: 32599281
- PMCID: PMC7318986
- DOI: 10.1016/j.ijid.2020.06.075
Item in Clipboard
Comparative Study
Comparing COVID-19 and the 1918-19 influenza pandemics in the United Kingdom
Int J Infect Dis.
2020 Sep.
Abstract
We compared the COVID-19 and 1918-19 influenza pandemics in the United Kingdom. We found that the ongoing COVID-19 wave of infection matched the major wave of the 1918-19 influenza pandemic surprisingly well, with both reaching similar magnitudes (in terms of estimated weekly new infections) and spending the same duration with over five cases per 1000 inhabitants over the previous two months. We also discussed the similarities in epidemiological characteristics between these two pandemics.
Keywords: 1918–19 influenza; COVID-19; Multiple waves; United Kingdom; Years of life lost.
Copyright © 2020 The Authors. Published by Elsevier Ltd.. All rights reserved.
Figures
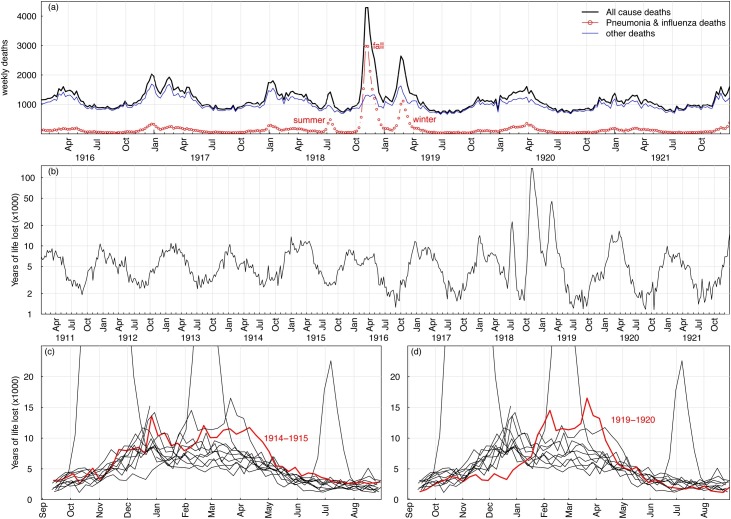
The impact of A/H1N1 1918 influenza in the UK from 1918 to 1919, the pre-pandemic era, and the post-pandemic era. Panel (a) showed the weekly deaths from all causes (black) and pneumonia-influenza-associated deaths (red) in London, UK between January 1916 and December 1921. Panel (b) showed the years of life lost (YLL) between 1911 and 1921, related to pneumonia and influenza (P&I) deaths. (c) The YLL distribution was abnormal in 1914–15 when the First World War (WWI) started. (d) The YLL distribution was also abnormal in 1919–20, which could have been a lasting effect of the 1918–19 pandemic. In all panels, the three waves (summer, fall, and winter) stand out.
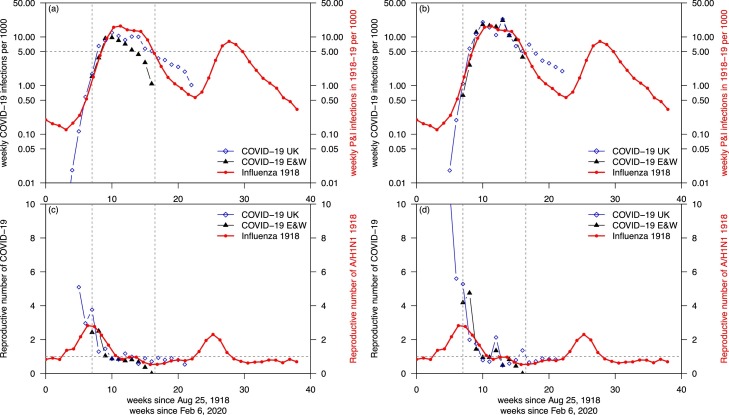
Comparisons of COVID-19 and A/H1N1 1918. (a) Comparing COVID-19 estimated infections based on reported cases (assuming 5% reporting ratio, black) with 1918-19 influenza estimated infections (assuming 2% CFR, red) in E&W. (b) Comparing COVID-19 estimated infections based on reported deaths (assuming 0.5% CFR, black) with 1918–19 influenza estimated infections (red) in E&W. The two matched surprisingly well between weeks 7 and 16, and above five cases per 1000 inhabitants in (b). The time-varying crude reproductive numbers are shown in (c,d), based on data in (a,b), respectively.
References
-
- Adam D., Wu P., Wong J., Lau E., Tsang T., Cauchemez S. Clustering and superspreading potential of severe acute respiratory syndrome coronavirus 2 (SARS-CoV-2) infections in Hong Kong. Research Square. 2020 https://www.researchsquare.com/article/rs-29548/v1 - PubMed
-
- Faust J.S., del Rio C. Assessment of deaths from COVID-19 and from seasonal influenza. JAMA Int Med. 2020 - PubMed
Publication types
MeSH terms
LinkOut - more resources
Full Text Sources
Medical
