. 2020 Jul 24;23(7):101257.
doi: 10.1016/j.isci.2020.101257. Epub 2020 Jun 10.

BK Polyomavirus Evades Innate Immune Sensing by Disrupting the Mitochondrial Network and Promotes Mitophagy

Affiliations

BK Polyomavirus Evades Innate Immune Sensing by Disrupting the Mitochondrial Network and Promotes Mitophagy

Julia Manzetti et al. iScience. .

Abstract

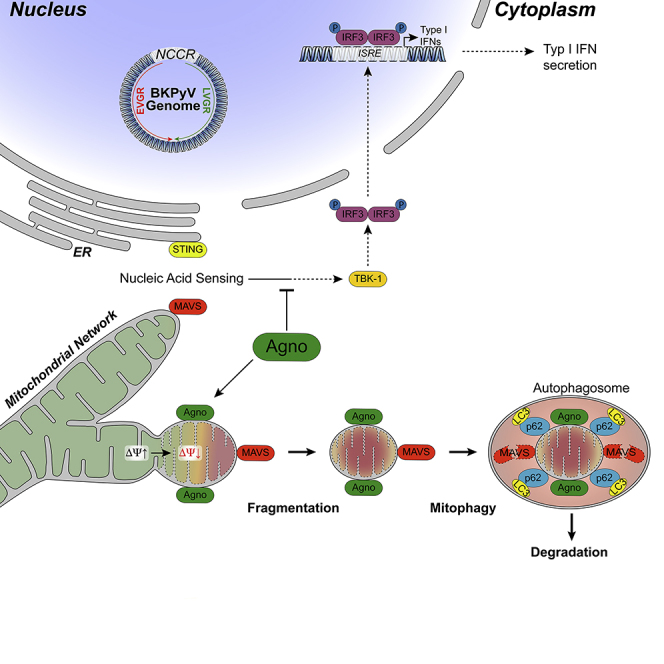
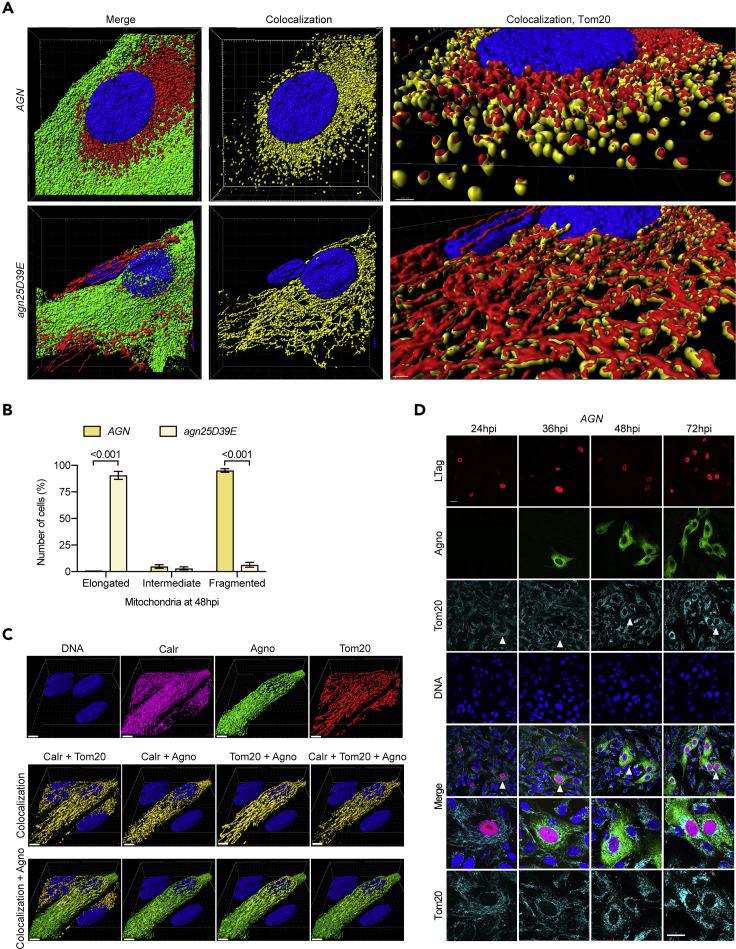
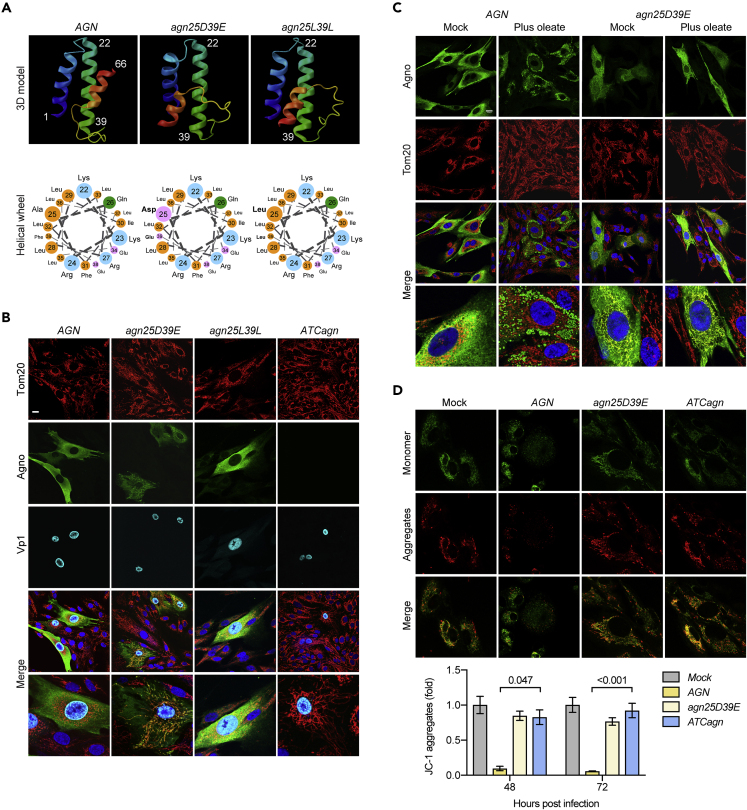
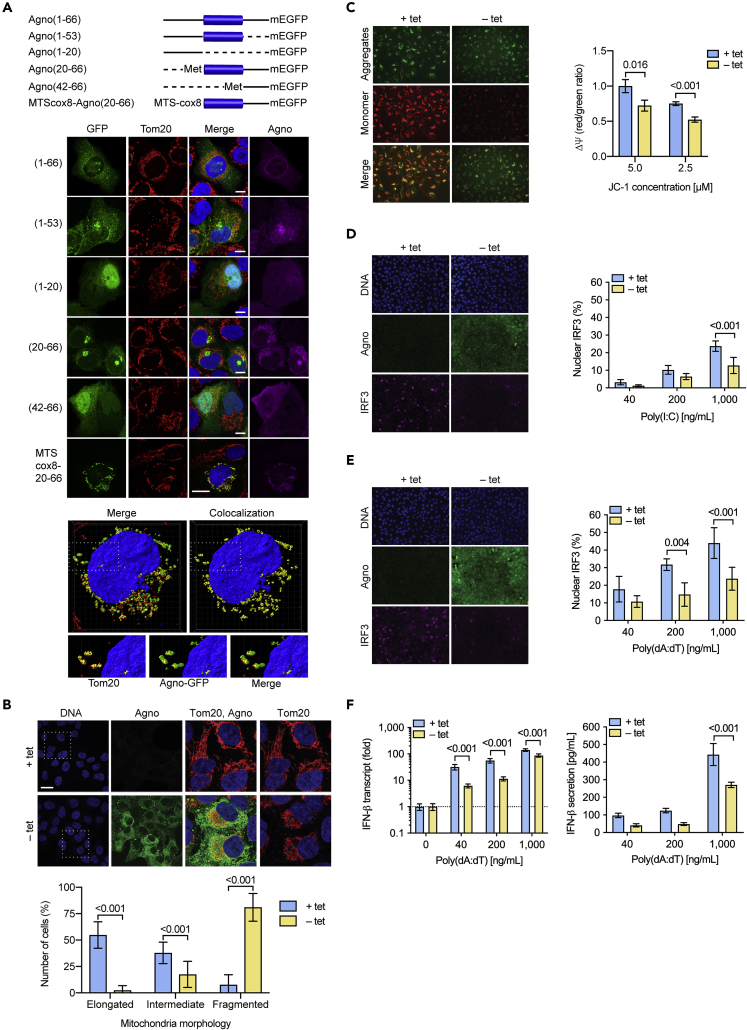
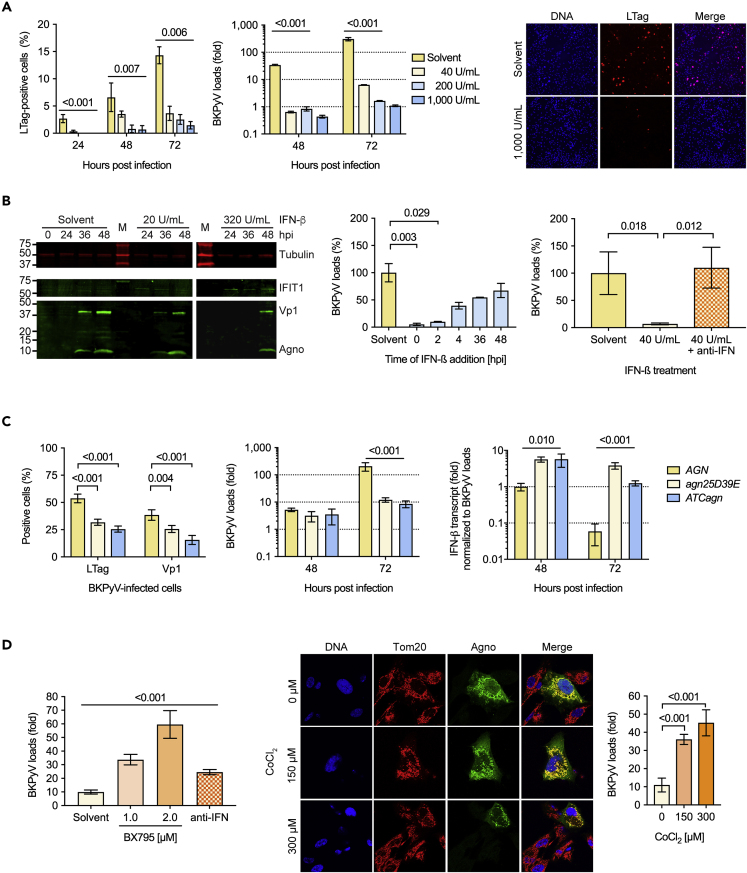
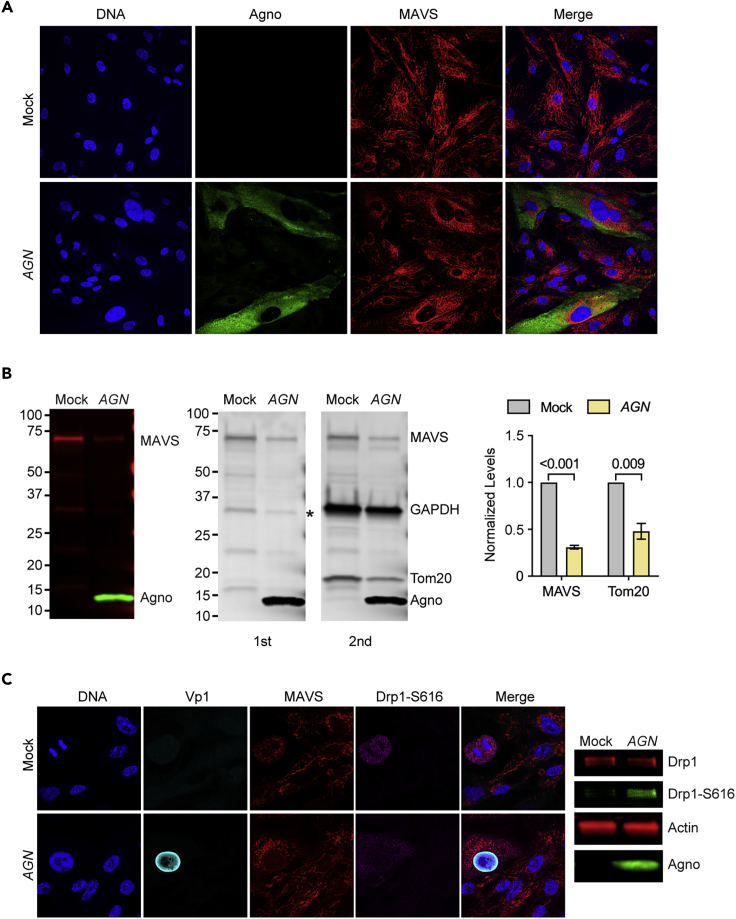
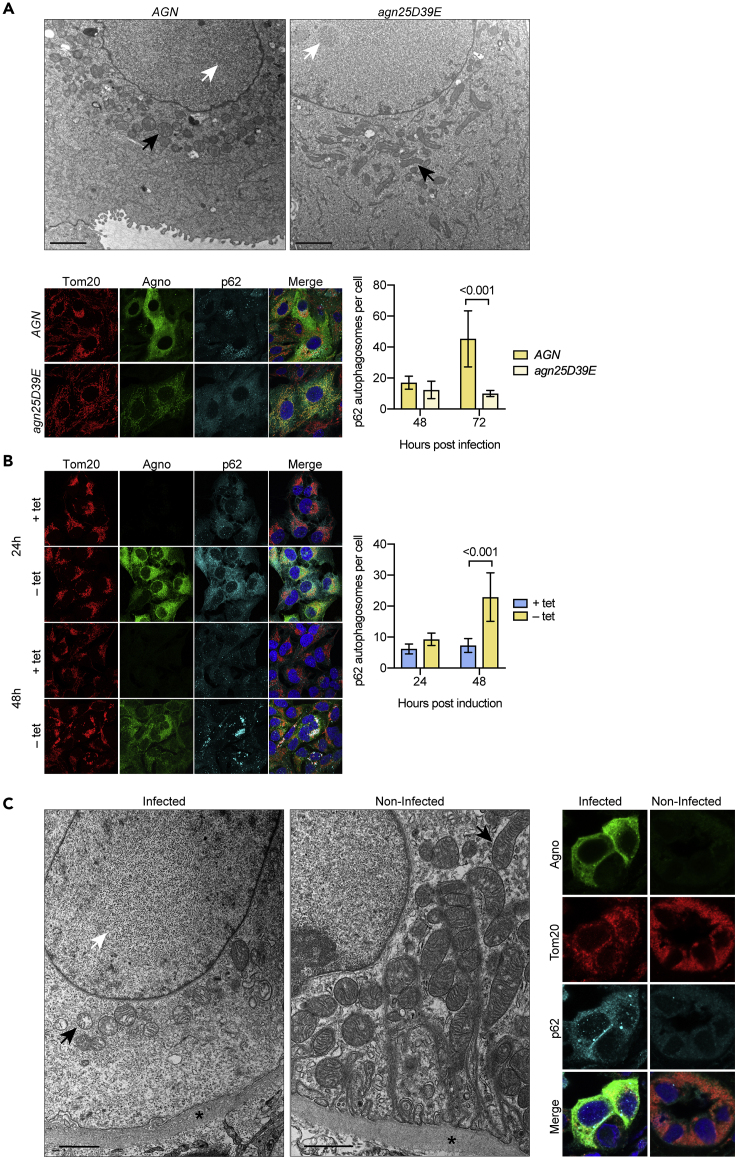
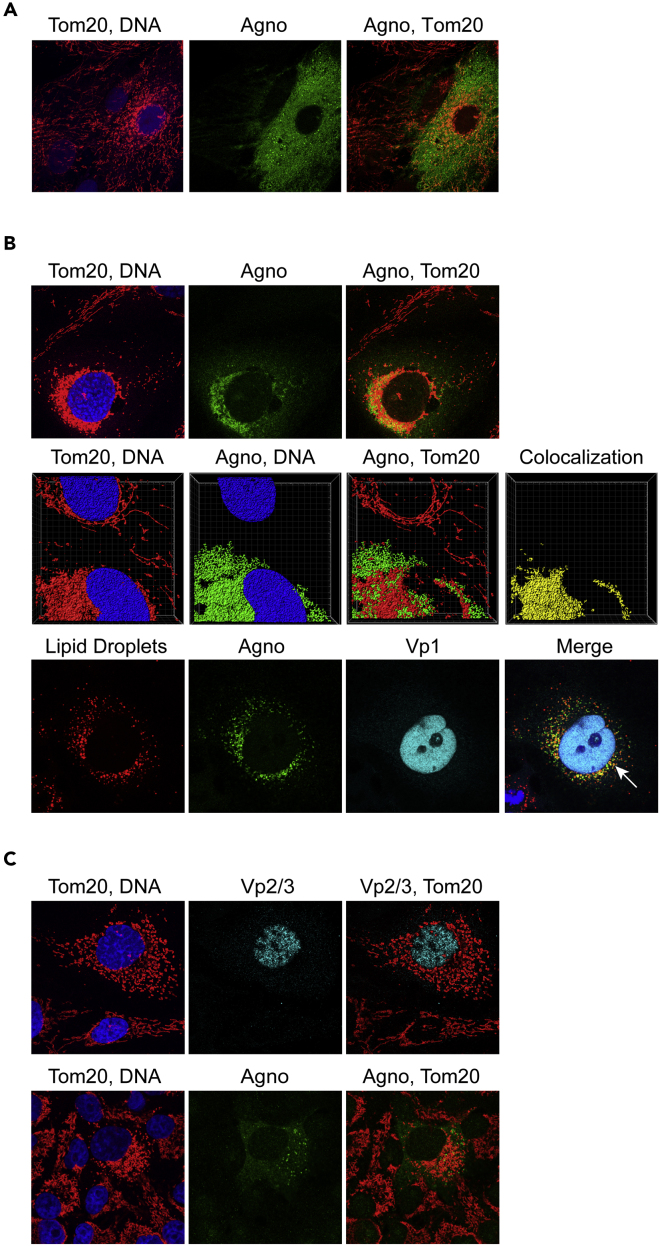
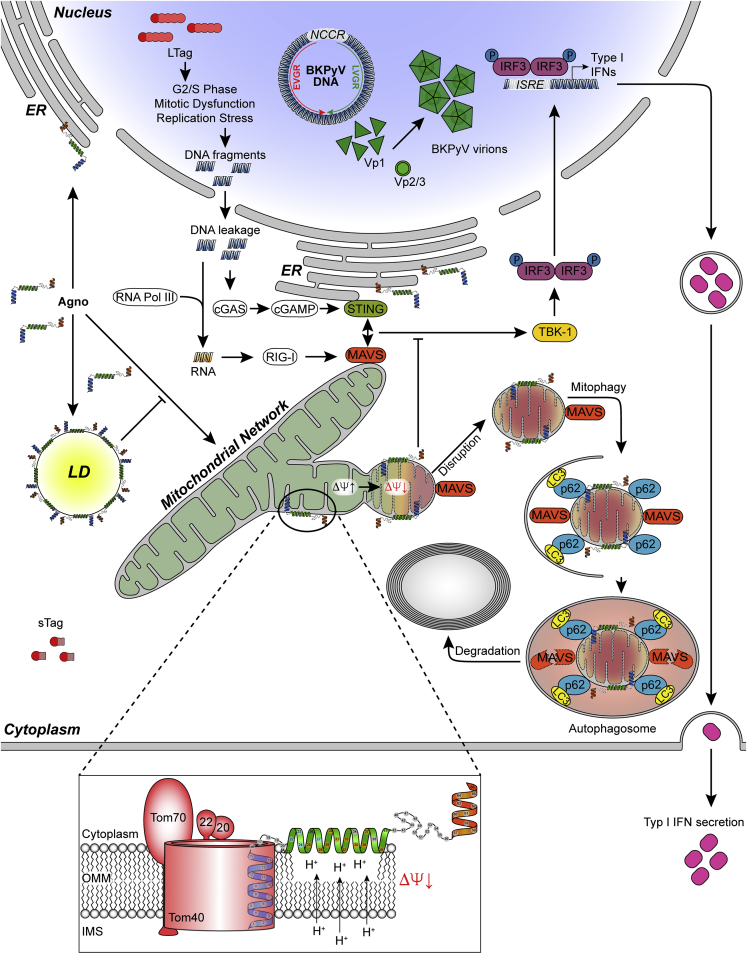
Immune escape contributes to viral persistence, yet little is known about human polyomaviruses. BK-polyomavirus (BKPyV) asymptomatically infects 90% of humans but causes premature allograft failure in kidney transplant patients. Despite virus-specific T cells and neutralizing antibodies, BKPyV persists in kidneys and evades immune control as evidenced by urinary shedding in immunocompetent individuals. Here, we report that BKPyV disrupts the mitochondrial network and membrane potential when expressing the 66aa-long agnoprotein during late replication. Agnoprotein is necessary and sufficient, using its amino-terminal and central domain for mitochondrial targeting and network disruption, respectively. Agnoprotein impairs nuclear IRF3-translocation, interferon-beta expression, and promotes p62/SQSTM1-mitophagy. Agnoprotein-mutant viruses unable to disrupt mitochondria show reduced replication and increased interferon-beta expression but can be rescued by type-I interferon blockade, TBK1-inhibition, or CoCl2-treatment. Mitochondrial fragmentation and p62/SQSTM1-autophagy occur in allograft biopsies of kidney transplant patients with BKPyV nephropathy. JCPyV and SV40 infection similarly disrupt mitochondrial networks, indicating a conserved mechanism facilitating polyomavirus persistence and post-transplant disease.

Keywords: Biological Sciences; Cell Biology; Immunology; Virology.


Conflict of interest statement

Declaration of Interests The authors declare no competing interests.

Figures

None
Graphical abstract
Figure 1
Figure 1
Agnoprotein Colocalizes with Mitochondria and Induces Mitochondrial Fragmentation in the Late Replication Phase of BKPyV Infection (A) Z-stacks of RPTECs infected with BKPyV Dun-AGN (top row) or with Dun-agn25D39E (bottom row, large replicating cell next to small non-replicating cell) at 48 hpi, stained for Tom20 (red), agnoprotein (green), and DNA (blue). Colocalizing voxels are shown in yellow. (B) Quantification of mitochondrial morphology in six fields of two independent experiments using Fiji software (mean ± SD, two-way ANOVA). (C) Z-stacks of BKPyV Dun-agn25D39E-infected cells at 48 hpi, stained for mitochondrial marker Tom20 (red), calreticulin as marker for the ER(magenta), agnoprotein (green), and DNA (blue). Colocalizing voxels are shown in yellow (scale bar, 5 μm). (D) Confocal images of RPTECs infected with BKPyV Dun-AGN at indicated times post-infection. Cells were stained for LTag (red), agnoprotein (green), mitochondrial marker Tom20 (cyan), and DNA (blue). White arrows indicate cells magnified (scale bar, 20 μm).
Figure 2
Figure 2
The Amphipathic Character of the Central Agnoprotein Helix Is Required for Mitochondrial Fragmentation (A) Three-dimensional ribbon model of each agnoprotein derivate as predicted with the Quark online algorithm (https://zhanglab.ccmb.med.umich.edu/I-TASSER/) and predicted amphipathic helical wheel of the agnoprotein amino acids 22–39 (http://cti.itc.virginia.edu/∼cmg/Demo/wheel/wheelApp.html). (B) Confocal images of RPTEC-infected with BKPyV Dun-AGN and isogenic derivatives Dun-agn25D39E, Dun-agn25L39L, and Dun-ATCagn, respectively. Cells were fixed at 48 hpi and stained for mitochondrial marker Tom20 (red), agnoprotein (green), Vp1 (cyan), and DNA (blue) (scale bar, 20 μm). (C) Confocal images of RPTECs infected with BKPyV Dun-AGN and BKPyV-Dun-agn25D39E, respectively, at 48 hpi. Cells were mock-treated or treated with 300 μM oleate at 24 hpi (plus oleate). Cells were stained for Tom20 (red), agnoprotein (green), and DNA (blue) (scale bar, 20 μm). (D) Live cell imaging using JC-1 dye (5 μM) of mock-infected or infected with BKPyV Dun-AGN and isogenic derivatives Dun-agn25D39E, Dun-agn25L39L, and Dun-ATCagn, respectively at 48 hpi. Quantification of mitochondrial membrane potential (Ψm) by measuring red fluorescent signal (JC-1 aggregates) with the Safire II plate reader of three independent experiments (mean ± SD, Kruskal-Wallis test).
Figure 3
Figure 3
Agnoprotein Is Sufficient to Mediate Structural and Functional Alterations of Mitochondrial Network (A) Schematic presentation of agnoprotein-mEGFP fusion constructs transfected into UTA6 cells. Retained aa indicated in parenthesis and presented as solid line, deleted parts presented as dotted line. The central amphipathic helix (aa 22–39) is shown as blue bar. Confocal images of transfected UTA6 cells, transiently expressing the indicated agnoprotein-mEGFP fusion constructs were taken at 24 hpt. Immunofluorescent staining for Tom20 (red), agnoprotein (magenta), GFP (green), and DNA (blue) (scale bar, 20 μm). For MTScox8-agno(20-66), Z-stacks were obtained and colocalizing voxels are shown in yellow. (B) UTA6-2C9 cells stably transfected with tetracycline (tet)-off inducible BKPyV agnoprotein were cultured for 24 h in the presence (+tet) or absence (−tet) of tetracycline to suppress or induce BKPyV agnoprotein expression, respectively. Confocal images of cells stained for DNA (blue), agnoprotein (green), and Tom20 (red). White rectangle indicating enlarged section. Graph representing corresponding mitochondrial morphology, quantification of six fields using Fiji software of two independent experiments (mean ± SD; two-way ANOVA). (C) Ψm was assessed by JC-1 dye and imaging of live cells using the signal ratio of aggregate (red)/monomeric (green) normalized to UTA6-2C9 cells not expressing agnoprotein (+tet) versus cells expressing agnoprotein (−tet) using Mithras2 (mean ± SD, unpaired parametric t test). (D) Nuclear IRF3 translocation following poly(I:C) transfection was compared in UTA6-2C9 cells cultured for 24 h in the presence or absence of tetracycline to suppress or induce BKPyV agnoprotein expression, respectively. Increasing amounts of rhodamine-labeled poly(I:C) was delivered to the cells via lipofection, cells were fixed at 4 hpt, stained for IRF3 (magenta), agnoprotein (green), and DNA (blue) (left images, 1,000 ng/mL poly(I:C), right panel quantification of nuclear IRF3 of six fields using Fiji software (mean ± SD, Mann-Whitney)). (E) Nuclear IRF3 translocation following poly(dA:dT) transfection was compared in UTA6-2C9 cells as described in D (left images, 1,000 ng/mL poly(dA:dT), right panel quantification of nuclear IRF3 (mean ± SD, Mann-Whitney)). (F) Quantification of IFN-β mRNA and IFN-β secretion into cell culture supernatants following poly(dA:dT) stimulation of UTA6-2C9 cells, three experiments (mean ± SD, Mann-Whitney t test).
Figure 4
Figure 4
BKPyV Replication in Primary Human RPTECs Is Sensitive to Type-1 Interferon (A) RPTECs were treated overnight with the indicated concentrations of IFN-β or solvent. LTag positive cells (left panel; triplicates, mean ± SD, two-way ANOVA) and supernatant BKPyV loads (middle panel; triplicates, mean ± SD, two-way ANOVA) were quantified at the indicated times, and a representative LTag staining of RPTECs at 72 hpi is shown (right panel). (B) RPTECs were pre-treated with the indicated concentrations of IFN-β and expression of IFIT1 (ISG56), and BKPyV late viral proteins Vp1 and agnoprotein were analyzed at the indicated times post-infection by immunoblot analysis (left panel). RPTECs were treated before or at the indicated times post-infection with 200 U/mL IFN-β, and supernatant BKPyV loads were measured at 72 hpi (middle panel; triplicates, mean ± SD, Kruskal-Wallis test). BKPyV-infected RPTECs were treated with IFN-β in the presence or absence of anti-IFN consisting of antibodies blocking IFN-α, IFN-β, and interferon α/β receptor (right panel), and supernatant BKPyV loads were measured at 72 hpi (right panel; duplicates, mean ± SD, unpaired parametric t test). (C) RPTECs were infected with the indicated BKPyV variants (MOI = 1 by nuclear LTag staining of RPTCs) and the number of infected cells were quantified by immunofluorescence at 72 hpi (left panel; triplicates, mean ± SD, unpaired parametric t test), and supernatant BKPyV loads were measure at the indicated time post-infection (middle panel; triplicates, mean ± SD, two-way ANOVA). Quantification of IFN-β mRNA in RPTECs infected with the indicated strains was performed at 48 hpi and 72 hpi and normalized to the BKPyV loads (right panel; triplicates, mean ± SD, two-way ANOVA). (D) RPTECs were infected with BKPyV Dun-agn25D39E, the TBK-1 inhibitor BX795, antibodies blocking IFN-α, IFN-β, and interferon α/β receptor or solvent were added at 36 hpi, and supernatant BKPyV loads were measured at 72 hpi (left panel; triplicates of two independent experiments, mean ± SD, unpaired parametric t test). RPTECs were infected with BKPyV Dun-agn25D39E and treated with the indicated concentrations of CoCl2 or solvent at 24 hpi, and at 72 hpi, confocal microscopy was performed for Tom20 (red), agnoprotein (green) and DNA (blue), and supernatant BKPyV loads quantified (right panel; triplicates, mean ± SD, unpaired parametric t test).
Figure 5
Figure 5
MAVS Colocalizes to Fragmented Mitochondria and Is Decreased in BKPyV-Infected RPTECs (A) RPTECs were infected with BKPyV Dun-AGN or mock-treated and were either fixed after 72 h for confocal microscopy staining for DNA (blue), agnoprotein (green), and MAVS (red) (top left panel) or were harvested lysing 2.0 × 104 cells per 10 μL Laemmli Sample Buffer and analyzed by SDS/PAGE and immunoblotting for MAVS and agnoprotein (top panels). (B) The immunoblot (lower panel) stained for MAVS and agnoprotein (first) was subsequently stained for GAPDH and Tom20 (second). MAVS and Tom20 levels were normalized to GAPDH levels as indicated (right panel). GAPDH signal was overlapping with MAVS-specific band (indicated by asterisk) and was subtracted prior normalization. (C) RPTECs were mock-treated (top panels, left) or infected with BKPyV Dun-AGN bottom panels) and were fixed after 72 h for confocal microscopy for DNA (blue), Vp1 (cyan), MAVS (red), and phosphorylated Drp1-S616 (magenta) (bottom panels, left). Cell lysates were analyzed by SDS/PAGE and immunoblotting using antibodies to total Drp1, phosphorylated Drp1-S616, agnoprotein, and actin (panels, right).
Figure 6
Figure 6
Agnoprotein-Mediated Mitochondrial Fragmentation and p62/SQSTM1-Autophagosomes in Cell Culture and Kidney Transplant Biopsy Tissue (A) RPTECs were infected with BKPyV Dun-AGN or BKPyV Dun-agn25D39E. At 72 hpi, cells were fixed and processed for TEM (top panels; scale bar, 2 μm) or for confocal microscopy (bottom left panels) staining for Tom20 (red), agnoprotein (green), p62/SQSTM1 (cyan), and DNA (blue). p62/SQSTM1-positive autophagosomes of six fields were quantified using Fiji at 48 hpi and 72 hpi (bottom right panels; mean ± SD, two-way ANOVA). (B) UTA6-2C9 cells were cultured for 24 h or 48 h in the presence or absence of tetracycline to suppress or induce BKPyV agnoprotein expression, respectively. At the indicated times, confocal microscopy (left panels) was performed after fixing and staining for Tom20 (red), agnoprotein (green), p62/SQSTM1 (cyan), and DNA (blue). p62/SQSTM1-positive autophagosomes were quantified as described in A at 24 h and 48 h (right panels; mean ± SD, two-way ANOVA). (C) Tissue biopsies from kidney transplant patients with (infected) or without (non-infected) BKPyV-associated nephropathy were studied by transmission electron microscopy (left panels; scale bar, 1 μm) or confocal microscopy (right panels) staining for Tom20 (red), agnoprotein (green), p62/SQSTM1 (cyan), and DNA (blue).
Figure 7
Figure 7
Agnoprotein Mediates p62/SQSTM1-Dependent Autophagic Flux and Mitophagy (A) UTA6-2C9 cells were cultured for 48 h in the presence or absence of tetracycline to suppress or induce BKPyV agnoprotein expression, respectively. At 24 h post-induction, pepstatin-A1/E64d (10 μg/mL) and CCCP (10 μM) were added as indicated and cell extracts were prepared and analyzed by immunoblotting as described in Transparent Methods, using RIPA buffer, for LC3-I and II, agnoprotein expression and actin. LC3-II/I ratio were normalized using untreated cells without agnoprotein (+tet) expression as reference. (B) RPTECs transfected with siRNA-p62 (p62 knockdown) or control were infected with BKPyV Dun-AGN (indicated as AGN). Pepstatin-A1/E64d (10 μg/mL) was added at 48 hpi; when indicated, 2.0 × 104 cells were harvested and lysed per 10 μL Laemmli sample buffer and analyzed by immunoblotting as described in Transparent Methods for p62/SQSTM1, BKPyV Vp1, and LC3-I and -II expression (on 0.22 μm PVDF membrane, left panel) or MAVS, actin, BKPyV LTag, and agnoprotein (on 0.45 μm PVDF-FL membrane, right panel). (C) RPTECs transfected with mCherry-GFP-OMP25TM tandem tag mitophagy reporter were infected with BKPyV Dun-AGN or BKPyV Dun-agn25D39E. At 72 hpi, cells were fixed and stained for Vp1 and DNA. Colocalization of mCherry and GFP (yellow), Vp1 (cyan), and DNA (blue). Z-stacks were acquired and analyzed with IMARIS, and the mCherry signal was transformed into countable spots (according voxel intensity). The GFP and mCherry mean intensity within the spots were quantified (bars represent mean ±95% CI, Wilson/Brown method).
Figure 8
Figure 8
Agnoprotein of Archetype BKPyV, JC Polyomavirus, and the Simian SV40 Colocalize to Mitochondria and Disrupt the Mitochondrial Network (A) RPTECs were infected with BKPyV-WW(1.4) carrying an archetype non-coding control region, and confocal microscopy was performed at 6 dpi after staining for Tom20 (red), agnoprotein (green), and DNA (blue). (B) SVG-A cells were infected with JCPyV-Mad4, and confocal microscopy was performed at 72 hpi after staining for Tom20 (red), anti-JCPyV agnoprotein (green), and DNA (blue) (top panels). Z-stacks of JCPyV-replicating SVG-A cells were acquired, deconvolved, and processed with IMARIS. 3D isosurface renderings of the mitochondrial marker Tom20 (red), agnoprotein (green), and DNA (blue) are shown. Colocalizing voxels are shown in yellow (middle panels). Confocal image of SVG-A cells infected with JCPyV-Mad4, 48 hpi, treated with 300 μM oleate at 24 hpi. Cells were stained for lipid droplets (red), agnoprotein (green), Vp1 (cyan), and DNA (blue). Lipid droplets indicated by white arrow (bottom panels). (C) CV-1 cells were infected with SV40, and confocal microscopy was performed at 48 hpi after staining for Tom20 (red), Vp2/3 (blue) (top panels), or cross-reacting antisera raised against JCPyV agnoprotein (green) (lower panels).
Figure 9
Figure 9
Working Model of BKPyV Agnoprotein Mediating Innate Immune Evasion by Mitochondrial Membrane Breakdown, Network Fragmentation, and Mitophagy.

Similar articles

Cited by

References

    1. Abend J.R., Low J.A., Imperiale M.J. Global effects of BKV infection on gene expression in human primary kidney epithelial cells. Virology. 2010;397:73–79. - PMC - PubMed
    1. An P., Saenz Robles M.T., Duray A.M., Cantalupo P.G., Pipas J.M. Human polyomavirus BKV infection of endothelial cells results in interferon pathway induction and persistence. PLoS Pathog. 2019;15:e1007505. - PMC - PubMed
    1. Assetta B., De Cecco M., O'Hara B., Atwood W.J. JC polyomavirus infection of primary human renal epithelial cells is controlled by a type I IFN-induced response. mBio. 2016;7:e00903–e00916. - PMC - PubMed
    1. Atencio I.A., Shadan F.F., Zhou X.J., Vaziri N.D., Villarreal L.P. Adult mouse kidneys become permissive to acute polyomavirus infection and reactivate persistent infections in response to cellular damage and regeneration. J. Virol. 1993;67:1424–1432. - PMC - PubMed
    1. Bernhoff E., Gutteberg T.J., Sandvik K., Hirsch H.H., Rinaldo C.H. Cidofovir inhibits polyomavirus BK replication in human renal tubular cells downstream of viral early gene expression. Am. J. Transplant. 2008;8:1413–1422. - PubMed

LinkOut - more resources