. 2020 Jun 24;10(6):71.
doi: 10.3390/bios10060071.

A Capillary-Perfused, Nanocalorimeter Platform for Thermometric Enzyme-Linked Immunosorbent Assay with Femtomole Sensitivity

Affiliations

A Capillary-Perfused, Nanocalorimeter Platform for Thermometric Enzyme-Linked Immunosorbent Assay with Femtomole Sensitivity

Evan Kazura et al. Biosensors (Basel). .

Abstract

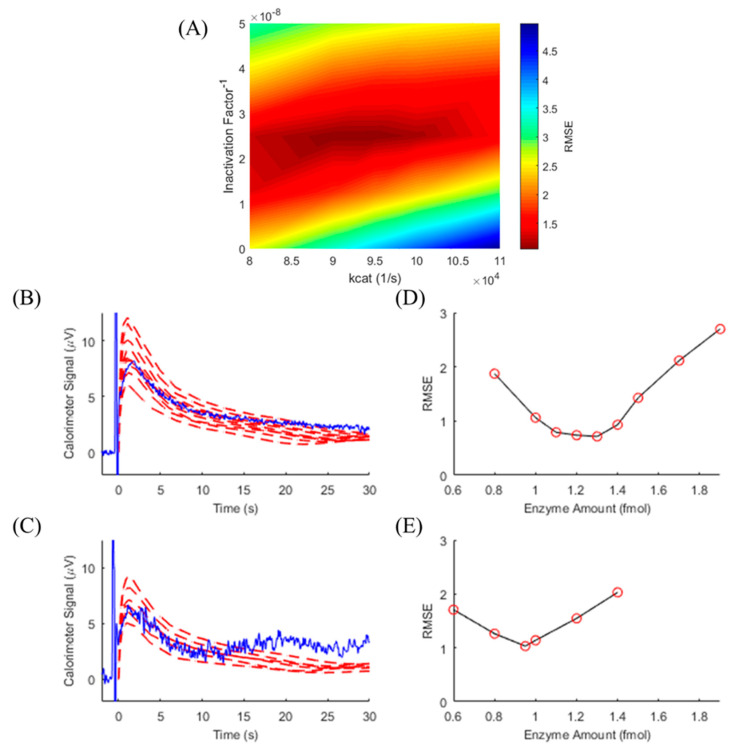
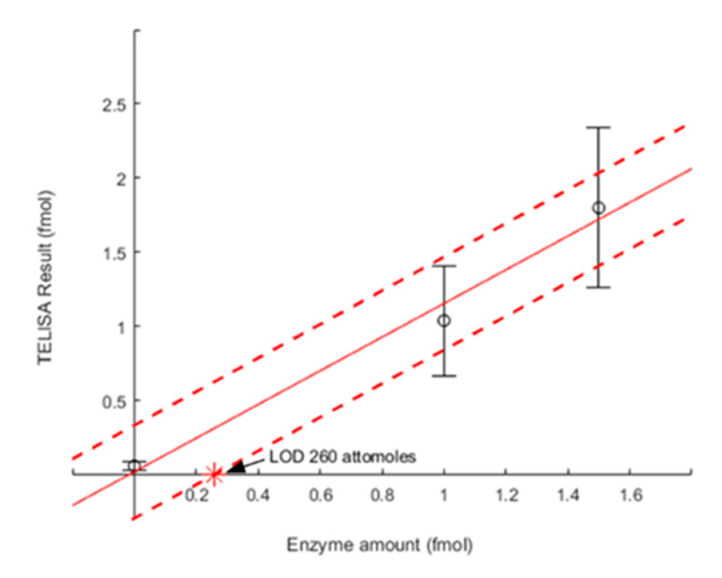
Enzyme-catalyzed chemical reactions produce heat. We developed an enclosed, capillary-perfused nanocalorimeter platform for thermometric enzyme-linked immunosorbent assay (TELISA). We used catalase as enzymes to model the thermal characteristics of the micromachined calorimeter. Model-assisted signal analysis was used to calibrate the nanocalorimeter and to determine reagent diffusion, enzyme kinetics, and enzyme concentration. The model-simulated signal closely followed the experimental signal after selecting for the enzyme turnover rate (kcat) and the inactivation factor (InF), using a known label enzyme amount (Ea). Over four discrete runs (n = 4), the minimized model root mean square error (RMSE) returned 1.80 ± 0.54 fmol for the 1.5 fmol experiments, and 1.04 ± 0.37 fmol for the 1 fmol experiments. Determination of enzyme parameters through calibration is a necessary step to track changing enzyme kinetic characteristics and improves on previous methods to determine label enzyme amounts on the calorimeter platform. The results obtained using model-system signal analysis for calibration led to significantly improved nanocalorimeter platform performance.

Keywords: ELISA; biosensor; microfabricated calorimeter; model-assisted signal analysis; thermometric ELISA.


Conflict of interest statement

The authors declare no conflict of interest.

Figures

Figure 1
Figure 1
(A) Nanocalorimeter platform consisting of an Su-8 polymer thin membrane on a silicon base, Su-8 walls, and a thermopile calorimeter. (B) A second Su-8 membrane on silicon seated on the walls forms a microfluidic channel around the calorimeter. The thin membrane thermally isolates the reaction zone, calorimeter sensing, and reference junctions from the environment. Liquid placed at entrance to the microfluidic channel is drawn in by capillary forces, filling the channel without external pumps. (C) The calorimeter consists of a 27 junction Bi/Ti thermopile in a differential format. Sensing junctions and reference junctions are each arranged in a semicircle on the freestanding thin membrane. The temperature difference between the sensing junctions and reference junctions generates a proportional voltage differential between the thermopile contacts. Additional details on platform design and construction can be found in Lubbers [21]. Figure adapted from Kazura et al. [19].
Figure 2
Figure 2
Three-dimensional (3D) calorimeter platform model, constructed in COMSOL Multiphysics. (A) The microfluidic channel liquid is represented in the model by a block, designated as water for physical and thermal properties and assigned an initial homogeneous substrate concentration. (B) The nanocalorimeter platform, consisting of the base, lid, walls, and membrane containing the calorimeter thermopiles, was added to the microfluidic channel liquid. (C) The sensing and reference junctions are simplified to uniform half circles that average the temperature differences between them. The Bi/Ti thermopile tracks between the junctions are modeled in the volume between the two half-circles. Top-down (D) and cross-section (E) spatial distribution of heat at 0.43 s, at which temperature difference between the reference and sensing junctions was the greatest.
Figure 3
Figure 3
(A) Cross-sections across the width of the microfluidic channel show H2O2 depletion over time. (B) Total substrate consumed over time (left axis) was converted to the energy released within the reaction zone (right axis). A quick spike of heat was released (a–b), then quickly decreased as all initial substrate within the reaction zone was consumed (c–h). The substrate slowly diffused into the reaction zone and was quickly consumed, approaching a steady state (i–k). In steady state, there is a finite amount of substrate diffusing into the reaction zone, which results in the signal not returning to baseline. The relatively large concentration and volume of substrate maintains the steady state above baseline. (C) Temperature difference between sensing and reference junctions (left axis) and predicted voltage generated by the thermopile during the reaction (right axis). (D) Root mean square error (RMSE) minimization found the best fit over the full 30 s of simulation, allowing for the enzyme parameter (kcat) determination. (E) Model and experiment comparison for 1 mM initial H2O2 and 10 femtomoles of catalase. Results from the calorimeter response model (red dashed line) closely match experimental (blue line) data.
Figure 4
Figure 4
Time course of calorimeter output (blue) at substrate concentration of 10 mM H2O2 and simulated signals with (red dashed line) and without (red dotted line) enzyme deactivation.
Figure 5
Figure 5
(A) RMSE surface for enzyme parameter calibration for thermometric, enzyme-linked immunosorbent assay (TELISA). With 2.5 fmol of catalase (CAT) and 10 mM H2O2 held constant, enzyme parameters kcat and InF were varied in the model and compared to 30 s of the experimental signal to determine best fits for the conditions. These parameter values were then used for subsequent modelling to determine unknown enzyme amounts. Calorimeter output (blue) is shown for TELISA with 10 mM H2O2 at 1.5 fmol (B) and 1.0 fmol (C) of CAT. Modeled signals (red dashed line) were generated using kcat and InF values from the calibration step and enzyme amounts shown as a red circle in the corresponding figures (D) and (E). RMSE minimization from the simulated signals allow for the determination of the enzyme amount.
Figure 6
Figure 6
LOD for CAT-based TELISA on a nanocalorimeter platform. Experimental error determined using fixed substrate concentrations of 10 mM H2O2 and multiple experiments. The LOD of 260 attomoles of CAT was found where the average standard deviation (red dashed line) of the model-assisted determination of the enzyme amount intersects with the x-axis.

References

    1. Premjeet S., Deepika G., Sudeep B., Sonam J., Sahil K., Devashish R., Sunil K. Enzyme-Linked Immuno-Sorbent Assay (ELISA), basics and it’s application: A comprehensive review. J. Pharm. Res. 2011;4:4581–4583.
    1. Thiha A., Ibrahim F. A colorimetric enzyme-linked immunosorbent assay (ELISA) detection platform for a point-of-care dengue detection system on a lab-on-compact-disc. Sensors. 2015;15:11431–11441. doi: 10.3390/s150511431. - DOI - PMC - PubMed
    1. Roda A., Mirasoli M., Michelini E., Di Fusco M., Zangheri M., Cevenini L., Roda B., Simoni P. Progress in chemical luminescence-based biosensors: A critical review. Biosens. Bioelect. 2016;76:164–179. doi: 10.1016/j.bios.2015.06.017. - DOI - PubMed
    1. Metkar S.K., Girigoswami K. Diagnostic biosensors in medicine: A review. Biocatal. Agric. Biotech. 2019;17:271–283. doi: 10.1016/j.bcab.2018.11.029. - DOI
    1. Eivazzadeh-Keihan R., Pashazadeh-Panahi P., Mahmoudi T., Chenab K.K., Baradaran B., Hashemzaei M., Radinekiyan F., Mokhtarzadeh A., Maleki A. Dengue virus: A review on advances in detection and trends—from conventional methods to novel biosensors. Microchim. Acta. 2019;186:329. doi: 10.1007/s00604-019-3420-y. - DOI - PubMed

LinkOut - more resources