. 2020 Jun 24;21(12):4497.
doi: 10.3390/ijms21124497.

Mapping of Major Fusarium Head Blight Resistance from Canadian Wheat cv. AAC Tenacious

Affiliations

Mapping of Major Fusarium Head Blight Resistance from Canadian Wheat cv. AAC Tenacious

Raman Dhariwal et al. Int J Mol Sci. .

Abstract

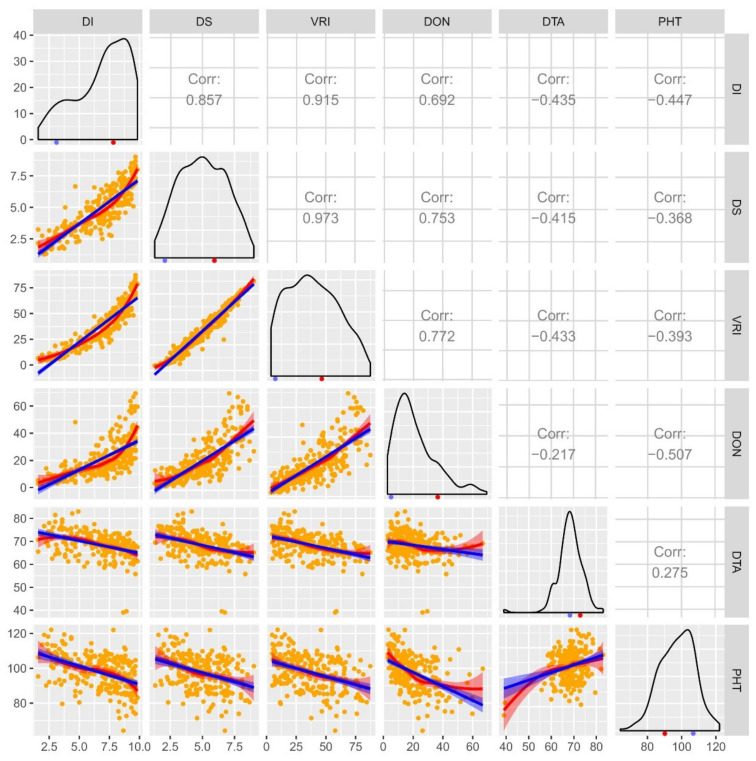
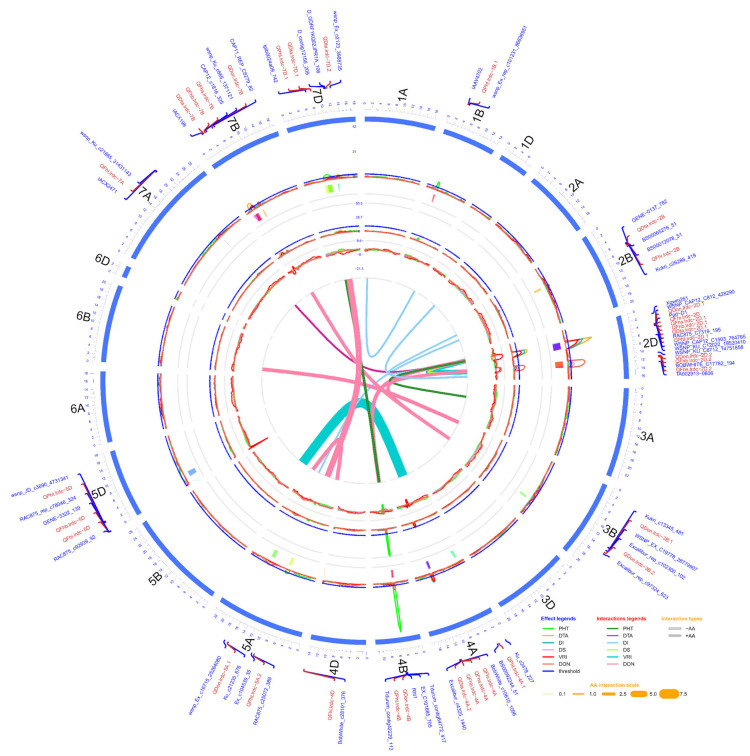
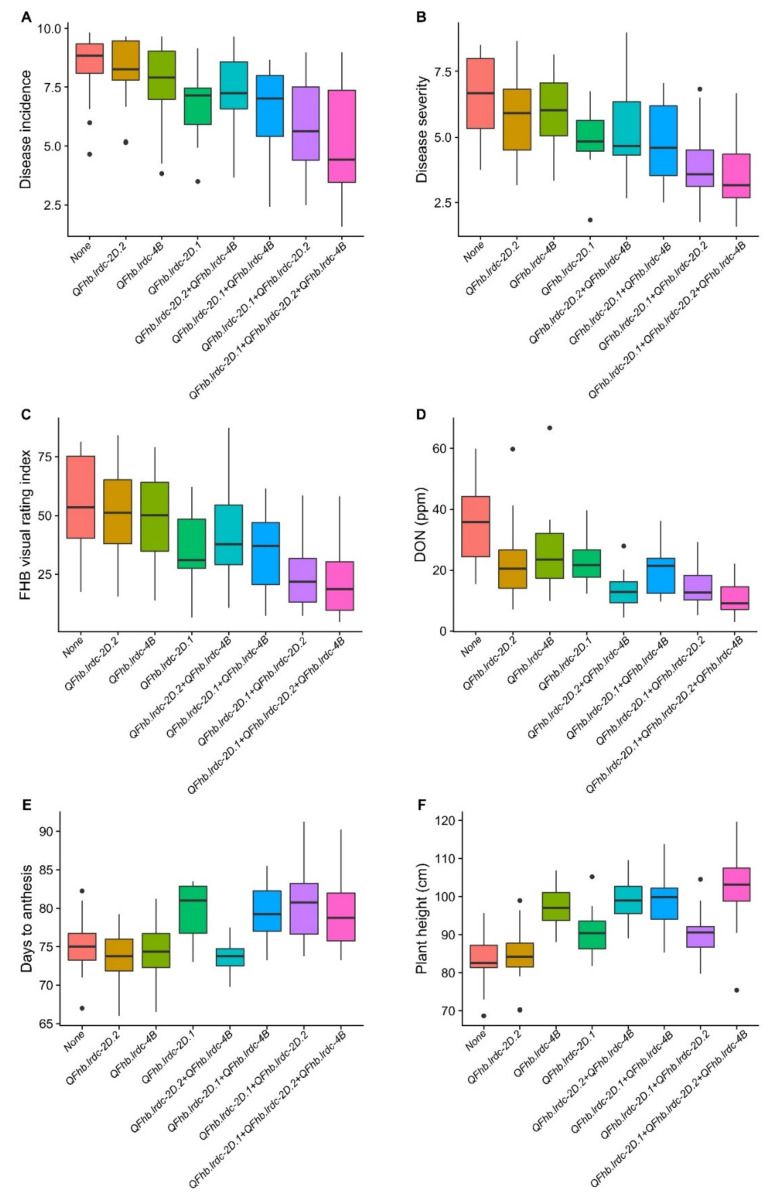
Fusarium head blight (FHB) is one of the most devastating wheat disease due to its direct detrimental effects on grain-yield, quality and marketability. Resistant cultivars offer the most effective approach to manage FHB; however, the lack of different resistance resources is still a major bottleneck for wheat breeding programs. To identify and dissect FHB resistance, a doubled haploid wheat population produced from the Canadian spring wheat cvs AAC Innova and AAC Tenacious was phenotyped for FHB response variables incidence and severity, visual rating index (VRI), deoxynivalenol (DON) content, and agronomic traits days to anthesis (DTA) and plant height (PHT), followed by single nucleotide polymorphism (SNP) and simple sequence repeat (SSR) marker genotyping. A high-density map was constructed consisting of 10,328 markers, mapped on all 21 chromosomes with a map density of 0.35 cM/marker. Together, two major quantitative trait loci for FHB resistance were identified on chromosome 2D from AAC Tenacious; one of these loci on 2DS also colocated with loci for DTA and PHT. Another major locus for PHT, which cosegregates with locus for low DON, was also identified along with many minor and epistatic loci. QTL identified from AAC Tenacious may be useful to pyramid FHB resistance.

Keywords: Fusarium head blight; QTL mapping; days to anthesis; disease resistance; doubled haploid; epistasis; plant height.


Conflict of interest statement

The authors declare no conflict of interest. The funders had no role in the design of the study; in the collection, analyses, or interpretation of data; in the writing of the manuscript, or in the decision to publish the results.

Figures

Figure 1
Figure 1
A combined correlogram of doubled haploid (DH) population of cross AAC Innova x AAC Tenacious drawn using pooled phenotypic data (average of all environments) of four Fusarium head blight (FHB) traits disease incidence (DI; measured on a scale of 0-10), severity (DS; measured on a scale of 0-10), visual rating index (VRI; DI x DS) and deoxynivalenol (DON; measured in ppm) content, and days to anthesis (DTA; days) and plant height (PHT; measured in cm) evaluated at Lethbridge and/or Morden in Canada. Scatterplots with regression lines, linear (blue) and exponential (red), for each pair of traits are drawn on the lower-left part of the plot matrix. Orange dots in scatterplots represent DH lines. Pearson correlations are displayed on the upper-right part of the plot matrix. Frequency distribution plots for each trait are shown on the diagonal. The means of the parental genotypes AAC Innova and AAC Tenacious are indicated by red and blue dots, respectively, beneath frequency distribution plots.
Figure 2
Figure 2
Circos diagram of linkage and QTL map developed using pooled phenotypic data (average of all environments) of doubled haploid population produced from the cross AAC Innova x AAC Tenacious. The outermost circle/track shows the 21 chromosomes (1A -7D) arranged in a clockwise direction with selected QTL-linked/flanking markers in 0.1X scale (cM). Three inner circles and line connections in the middle represent the mean LOD score (second track from outside), % phenotypic variation (R2) explained (third track from outside), additive effect (AE) (fourth track from outside) of individual QTL and epistatic effect (AA) of digenic QTL x QTL interactions (line connections in the middle) for different measured traits. In the second and third tracks from outside, blue lines show a LOD threshold of 2.5 and R2 threshold of 10%, respectively. QTL confidence intervals are shown in different colors beneath the QTL scans in second track from outside. LOD, R2 and AE peaks of different traits are represented in different colors as shown in the effect legends in the lower-right corner of the diagram. Three most significant and stable QTL identified were on chromosomes 2D and 4B. AA interactions between QTL pairs of the same or different linkage groups for each trait are represented in middle of diagram by line connections of different colors, as shown in the interaction legend in the lower-right corner of the diagram. Negative and positive AA interactions are represented by hollow and solid lines, respectively. The width of the line connections represent the strength of AA effect, as shown in the AA interaction scale in the lower-right corner of diagram.
Figure 3
Figure 3
Boxplot distributions of doubled haploid (DH) population produced from the cross AAC Innova x AAC Tenacious. Effects of positive alleles of single QTL (QFhb.lrdc-2D.1, QFhb.lrdc-2D.2 and QFhb.lrdc-4B) and their combinations on average Fusarium head blight incidence (A), severity (B), visual rating index (C), deoxynivalenol (DON) accumulation (D), days to anthesis (E) and plant height (F) are depicted alongside negative alleles at all three loci using pooled phenotypic data (average of all environments). Quartiles and medians are represented by boxes and continuous lines, respectively. Whiskers extend to the farthest points that are not outliers, whilst outliers are shown as black dots.

References

    1. Niwa S., Kazama Y., Abe T., Ban T. Tracking haplotype for QTLs associated with Fusarium head blight resistance in Japanese wheat (Triticum aestivum L.) lineage. Agric. Food Secur. 2018;7:4. doi: 10.1186/s40066-017-0139-z. - DOI
    1. Gilbert J., Tekauz A. Review: Recent developments in research on Fusarium head blight of wheat in Canada. Can. J. Plant. Pathol. 2000;22:1–8. doi: 10.1080/07060660009501155. - DOI
    1. Sieusahai G. Alberta Fusarium Graminearum Management Plan. [(accessed on 8 November 2019)]; Available online: https://www.alberta.ca/alberta-fusarium-graminearum-management-plan.aspx.
    1. Heikkila R. Economic Cost of Fusarium: Farm-level and Regional Economic Impact of Fusarium in Alberta. (External Release) Alberta Agriculture and Forestry; Edmonton, AB, Canada: 2015. p. 6.
    1. Komirenko Z. Economic Cost of Fusarium: Farm-Level and Regional Economic Impact of Fusarium in Alberta. (External Release) Alberta Agriculture and Forestry; Edmonton, AB, Canada: 2018. p. 8.

LinkOut - more resources