. 2020 Aug 20;64(9):e02487-19.
doi: 10.1128/AAC.02487-19. Print 2020 Aug 20.

A Roadblock-and-Kill Mechanism of Action Model for the DNA-Targeting Antibiotic Ciprofloxacin

Affiliations

A Roadblock-and-Kill Mechanism of Action Model for the DNA-Targeting Antibiotic Ciprofloxacin

Nikola Ojkic et al. Antimicrob Agents Chemother. .

Abstract

Fluoroquinolones, antibiotics that cause DNA damage by inhibiting DNA topoisomerases, are clinically important, but their mechanism of action is not yet fully understood. In particular, the dynamical response of bacterial cells to fluoroquinolone exposure has hardly been investigated, although the SOS response, triggered by DNA damage, is often thought to play a key role. Here, we investigated the growth inhibition of the bacterium Escherichia coli by the fluoroquinolone ciprofloxacin at low concentrations. We measured the long-term and short-term dynamical response of the growth rate and DNA production rate to ciprofloxacin at both the population and single-cell levels. We show that, despite the molecular complexity of DNA metabolism, a simple roadblock-and-kill model focusing on replication fork blockage and DNA damage by ciprofloxacin-poisoned DNA topoisomerase II (gyrase) quantitatively reproduces long-term growth rates in the presence of ciprofloxacin. The model also predicts dynamical changes in the DNA production rate in wild-type E. coli and in a recombination-deficient mutant following a step-up of ciprofloxacin. Our work highlights that bacterial cells show a delayed growth rate response following fluoroquinolone exposure. Most importantly, our model explains why the response is delayed: it takes many doubling times to fragment the DNA sufficiently to inhibit gene expression. We also show that the dynamical response is controlled by the timescale of DNA replication and gyrase binding/unbinding to the DNA rather than by the SOS response, challenging the accepted view. Our work highlights the importance of including detailed biophysical processes in biochemical-systems models to quantitatively predict the bacterial response to antibiotics.

Keywords: antibiotics; computer modeling; fluoroquinolones; mechanisms of action.


Figures

FIG 1
FIG 1
Growth inhibition curve for ciprofloxacin and DNA production rates. (A) Growth inhibition curve for ciprofloxacin-treated E. coli (MG1655) for different antibiotic concentrations (plate reader data, green points). The orange line is a quadratic fit to the data. The MIC is ∼20 ng/ml. Error bars represent SEM (4 replicates). (B) Growth inhibition curve for the fimbrial knockout mutant (AD30). Growth rates are normalized (divided) by the growth rate in the absence of CIP. Green points are plate reader measurements; red points are measurements from turbidostat-incubated exponential cultures, taken ∼4 h after the first exposure to ciprofloxacin. Both methods gave similar results. Error bars are SEM (4 replicates). The MIC of AD30 is ∼25 ng/ml. (C) The DNA production rate (measured by DAPI staining in two ways: "Spec" = spectrophotometer, "Plate" = plate reader) correlates well with the biomass growth rate (measured by determination of the OD). Error bars are SEM (3 replicates).
FIG 2
FIG 2
Model of ciprofloxacin mechanism of action. We modeled a collection of replicating chromosomes. New DNA is synthesized at the replication forks (black arrows). (A) Replication starts at the origin (oriC) and terminates at the chromosome terminus (ter). (B) A newly synthesized DNA strand remains connected with the parent chromosome until the forks reach ter. Initiation of new forks at oriC occurs, on average, every τfork time units. The stars represent gyrases poisoned by ciprofloxacin. (C) Poisoned gyrases are obstacles for replication forks, inducing fork stalling, and can also cause irreversible DNA damage with probability rate pkill. Once poisoned gyrase is removed from the chromosome (with turnover time τgyr), stalled forks resume replication.
FIG 3
FIG 3
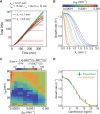
Simulations reproduce the experimental growth inhibition curve. (A) Total amount of synthesized DNA predicted by the model as a function of time for two different DNA-poisoned gyrase binding rates (k+ = 0.1 min−1 and k+ = 0.6 min−1). These rates correspond to two different ciprofloxacin concentrations below the MIC: low (at which the growth rate was almost unchanged) and medium (at which the growth rate was visibly lowered). Where the curves become flat, growth has been completely inhibited. Total DNA is calculated as the total length of all chromosomes divided by L0. (B) Growth rate versus DNA-poisoned gyrase binding rate (k+), obtained by fitting exponential curves to the last 30 min of the data from panel A, for different values of killing rate pkill. (C) Deviation between the experimental and simulated growth inhibition curves (GICexp and GICsim, respectively) as a function of pkill and τgyr (the third parameter, q, has also been fitted but the results are not shown). A cross marks the best-fit parameters of a pkill value of 7 × 10−5 min−1, a τgyr value of 25 min, and a q value of 0.03 ml ng−1 min−1. (D) Experimentally measured growth inhibition curve compared to the simulated best-fit curve. Errors are SEM (four replicates).
FIG 4
FIG 4
Dynamical response to CIP in the turbidostat. See Fig. S1C in the supplemental material for a schematic diagram of the turbidostat. (A) Growth rate as a function of time for the fimbrial knockout strain AD30. Ciprofloxacin was added at 0 h. Tss is the time to the new steady-state growth rate (c < MIC) or no growth (c > MIC) following the addition of CIP (see Materials and Methods). (B) Tss versus ciprofloxacin concentration. Points, experimental data; line, model prediction. The reduced chi-square value for the model data comparison is 39.2. Simulation parameters are the same as those used in the experiment whose results are presented in Fig. 3D. Other parameters close to the best-fit parameters from Fig. 3D lead to an even better agreement between the data and the model (Fig. S4).
FIG 5
FIG 5
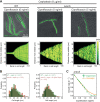
Ciprofloxacin causes the formation of entangled DNA structures. (A) Phase-contrast microscopy images overlaid with fluorescent DAPI-stained DNA images from which the background intensity was subtracted for clarity after 1 h of exposure to different concentrations of ciprofloxacin. Cephalexin was added to prevent cell division (see Fig. S5 in the supplemental material for CIP-only results). (B) Distribution of cell lengths after 1 h of CIP exposure. The results for cells shorter than 7 μm were excluded from the analysis. The best fit for the cell length distribution for a CIP concentration of 50 ng/ml has α equal to 1.62 h−1 and σ(α) equal to 0.07 h−1. Only the distribution for 50-ng/ml CIP differs from the CIP-free distribution (Kolmogorov-Smirnov test, P = 2.5 × 10−15, which is <0.05). (C) Distribution of DNA in cells of different lengths for different ciprofloxacin concentrations. Cells are ordered by length from the shortest to the longest along the x axis. The pseudocolor is the DAPI fluorescence measured at different positions along cell midline (y axis, scale bar on the right). Chromosomes are represented by lighter areas (pointed to by red arrows). The longest cells (∼24 μm) have ∼16 chromosomes. For 50-ng/ml CIP, chromosomes failed to separate (a single fluorescent region at the cell’s midpoint).
FIG 6
FIG 6
Simulations accurately predict the rate of DNA synthesis after ciprofloxacin exposure. (A) Simulated total amount of DNA versus time (average of 1,000 simulation runs). CIP is added at a time of 100 min. Different colors correspond to different gyrase binding rates (k+; different CIP concentrations). We used the best-fit parameters from the experiment whose results are presented Fig. 3. (B) Comparison of the predicted (no additional fitting) and experimentally measured total amount of DNA per cell (DAPI staining) after 1 h of CIP exposure. Error bars are SEM (350 cells on average per point).
FIG 7
FIG 7
DNA repair-deficient cells (ΔrecA cells) fail to separate chromosomes and are highly susceptible to ciprofloxacin. (A) Phase-contrast microscopy images overlaid with fluorescent DAPI-stained DNA images. All cells were treated with 8 μg/ml of cephalexin to prevent cell division. Many ΔrecA cells failed to form separate chromosomes. The results for the WT from Fig. 5A are repeated here for comparison. (B) The cell length distributions for ΔrecA and WT cells without CIP and after 1 h of exposure to CIP at a concentration that inhibits the growth of ΔrecA cells at the population level. (C) Data (points) and model prediction (orange line) for the growth rate versus ciprofloxacin concentration. Parameter values were pkill0 equal to 0.0033 ± 0.0002 min−1, pkill equal to 0.0042 ± 0.0001 min−1, and q equal to 0.03 ml ng−1 min−1. Error bars are SEM.
FIG 8
FIG 8
Dynamical response of DNA repair-deficient cells (ΔrecA ΔfimA double mutant) to a step-up of the CIP concentration in the turbidostat. (A) Growth rate versus time for the ΔrecA ΔfimA double mutant. Ciprofloxacin was added at 0 h. Tss is the time to the new steady-state growth rate (c < MIC) or no growth (c > MIC) following the addition of CIP. (B) Data (points) and model prediction (line) for Tss versus ciprofloxacin concentration.

References

    1. Kohanski MA, Dwyer DJ, Hayete B, Lawrence CA, Collins JJ. 2007. A common mechanism of cellular death induced by bactericidal antibiotics. Cell 130:797–810. doi:10.1016/j.cell.2007.06.049. - DOI - PubMed
    1. Keren I, Wu Y, Inocencio J, Mulcahy LR, Lewis K. 2013. Killing by bactericidal antibiotics does not depend on reactive oxygen species. Science 339:1213–1216. doi:10.1126/science.1232688. - DOI - PubMed
    1. Chung P, McNamara PJ, Campion JJ, Evans ME. 2006. Mechanism-based pharmacodynamic models of fluoroquinolone resistance in Staphylococcus aureus. Antimicrob Agents Chemother 50:2957–2965. doi:10.1128/AAC.00736-05. - DOI - PMC - PubMed
    1. Ena J, del Mar López-Perezagua M, Martínez-Peinado C, de los Angeles Cia-Barrio M, Ruíz-López I, 1998. Emergence of ciprofloxacin resistance in Escherichia coli isolates after widespread use of fluoroquinolones. Diagn Microbiol Infect Dis 30:103–107. doi:10.1016/S0732-8893(97)00216-2. - DOI - PubMed
    1. Greulich P, Scott M, Evans MR, Allen RJ. 2015. Growth-dependent bacterial susceptibility to ribosome-targeting antibiotics. Mol Syst Biol 11:796. doi:10.15252/msb.20145949. - DOI - PMC - PubMed

Publication types