. 2020 Aug 20;64(9):e01002-20.
doi: 10.1128/AAC.01002-20. Print 2020 Aug 20.

The FDA-Approved Drug Nelfinavir Inhibits Lytic Cell-Free but Not Cell-Associated Nonlytic Transmission of Human Adenovirus

Affiliations

The FDA-Approved Drug Nelfinavir Inhibits Lytic Cell-Free but Not Cell-Associated Nonlytic Transmission of Human Adenovirus

Fanny Georgi et al. Antimicrob Agents Chemother. .

Abstract

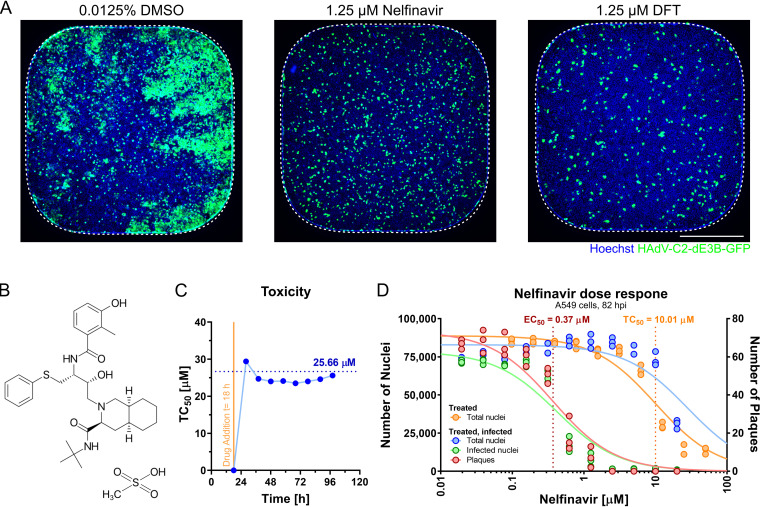
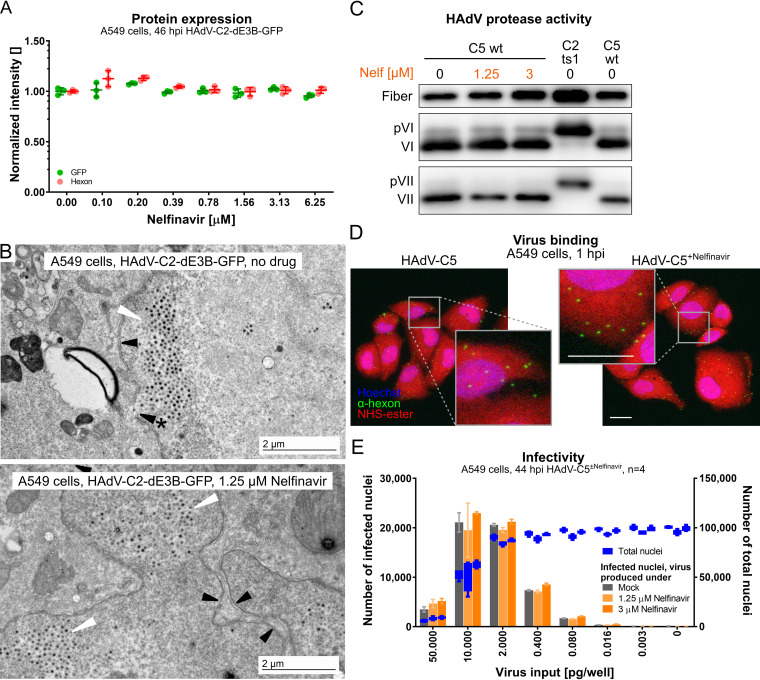
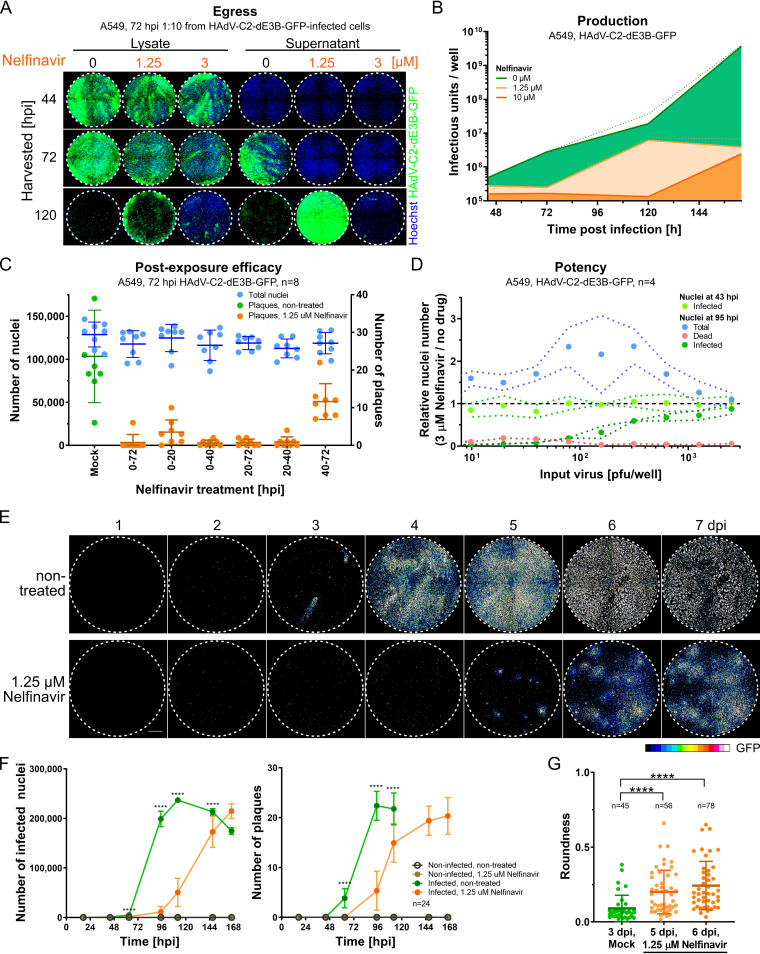
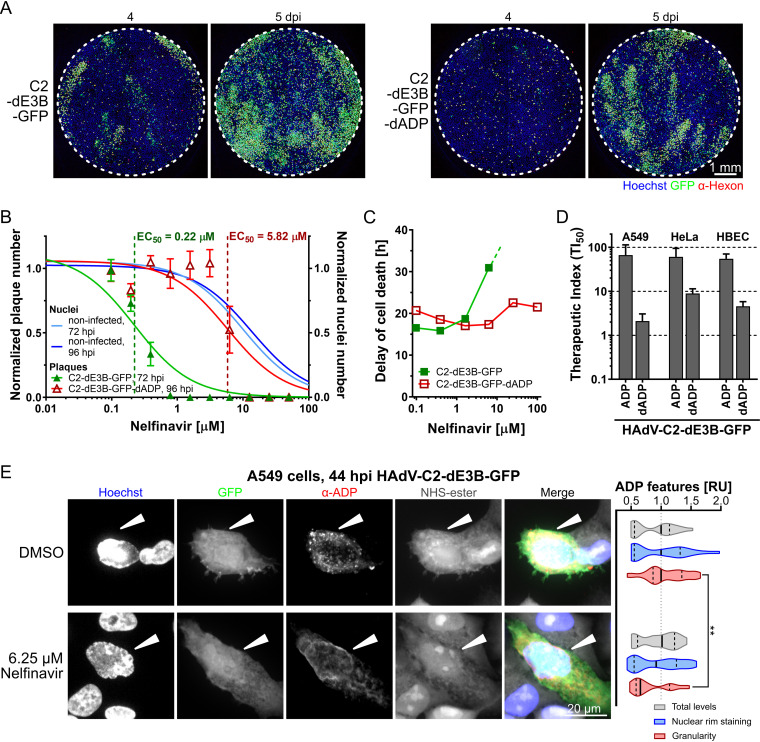
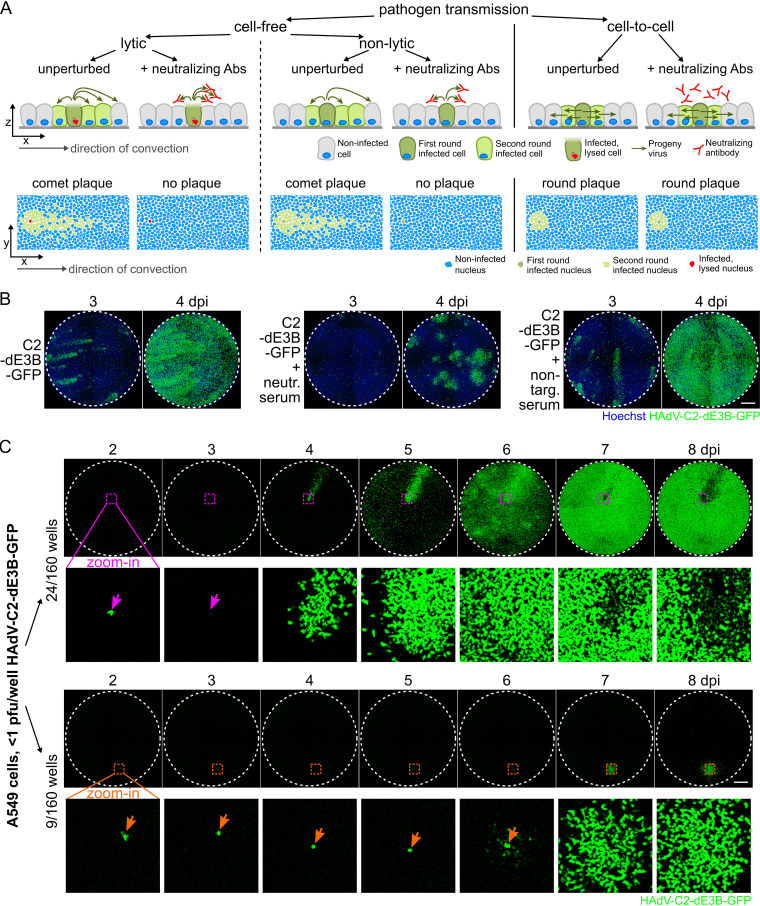
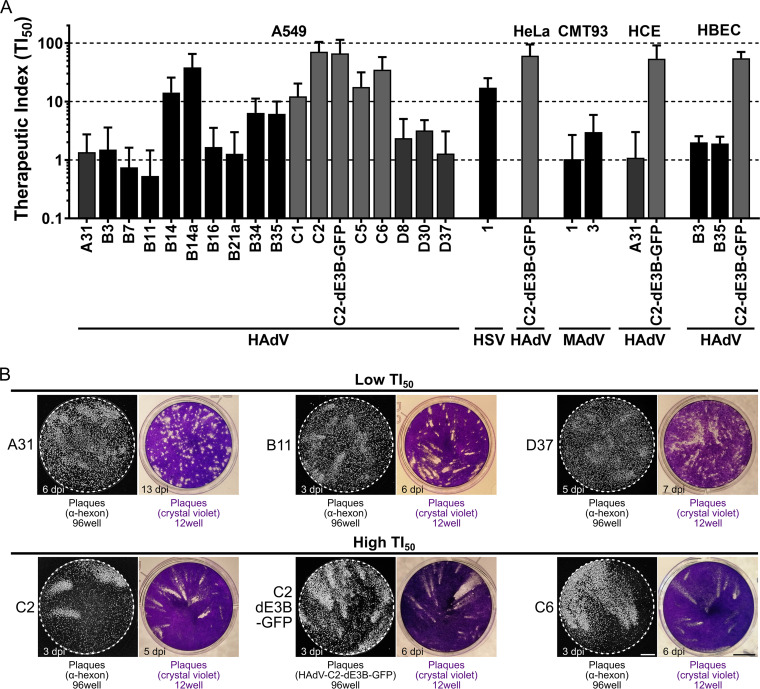
Adenoviruses (AdVs) are prevalent and give rise to chronic and recurrent disease. Human AdV (HAdV) species B and C, such as HAdV-C2, -C5, and -B14, cause respiratory disease and constitute a health threat for immunocompromised individuals. HAdV-Cs are well known for lysing cells owing to the E3 CR1-β-encoded adenovirus death protein (ADP). We previously reported a high-throughput image-based screening framework and identified an inhibitor of HAdV-C2 multiround infection, nelfinavir mesylate. Nelfinavir is the active ingredient of Viracept, an FDA-approved inhibitor of human immunodeficiency virus (HIV) aspartyl protease that is used to treat AIDS. It is not effective against single-round HAdV infections. Here, we show that nelfinavir inhibits lytic cell-free transmission of HAdV, indicated by the suppression of comet-shaped infection foci in cell culture. Comet-shaped foci occur upon convection-based transmission of cell-free viral particles from an infected cell to neighboring uninfected cells. HAdV lacking ADP was insensitive to nelfinavir but gave rise to comet-shaped foci, indicating that ADP enhances but is not required for cell lysis. This was supported by the notion that HAdV-B14 and -B14p1 lacking ADP were highly sensitive to nelfinavir, although HAdV-A31, -B3, -B7, -B11, -B16, -B21, -D8, -D30, and -D37 were less sensitive. Conspicuously, nelfinavir uncovered slow-growing round HAdV-C2 foci, independent of neutralizing antibodies in the medium, indicative of nonlytic cell-to-cell transmission. Our study demonstrates the repurposing potential of nelfinavir with postexposure efficacy against different HAdVs and describes an alternative nonlytic cell-to-cell transmission mode of HAdV.

Keywords: adenovirus death protein; antiviral agents; cell lysis; compound screening; drug repurposing; fluorescence imaging; membrane rupture; oncolytic virus; plaque assay; virus transmission.


Figures

FIG 1
FIG 1
The small molecule nelfinavir is a potent inhibitor of HAdV-C infection. (A) Representative 384-well epifluorescence microscopy images of cells treated with DMSO (left), nelfinavir (center), and DFT (right) and infected with HAdV-C2-dE3B-GFP for 72 h. Dotted lines indicate the well outline. Bar = 5 mm. (B) Structural formula of nelfinavir mesylate. (C) The half-maximal toxicity (TC50) in uninfected A549 cells was determined by nelfinavir dose-response impedance measurements at different times of drug treatment. The x axis indicates the times after cell seeding as well as drug addition. Impedance was recorded at intervals of 15 min using xCELLigence reporting on the cell number and cell adhesion to the electrode-coated wells. The raw CI data are available in Fig. S1 in the supplemental material. (D) Separation of effect (EC50) (plaque numbers) and toxicity (TC50) (nucleus numbers) of nelfinavir in A549 cells at 82 hpi based on data from four technical replicates.
FIG 2
FIG 2
Nelfinavir does not affect early or late steps of HAdV-C infection. (A) No effect of nelfinavir on the expression of CMV-GFP or the late viral protein hexon in HAdV-C2-dE3B-GFP-infected A549 cells. For each of the four biological replicates, data points represent the mean median nuclear intensities per well normalized to the mean median nuclear intensities of the DMSO-treated wells. Epifluorescence microscopy images were segmented and analyzed using CellProfiler. (B) Representative transmission EM images of late-stage HAdV-C2-dE3B-GFP-infected A549 cells at 41 hpi reveal viral particles inside the nucleus in both DMSO-treated and nelfinavir-treated cells (white arrowheads). Black arrowheads indicate the nuclear envelope, and the arrowhead with * points to a rupture. (C) Nelfinavir does not affect the maturation of HAdV-C5, as indicated by fully processed VI and VII proteins in purified particles grown in the presence of nelfinavir. Note that HAdV-C2-ts1 lacking the L3/p23 protease contains the precursor capsid proteins of VI and VII (pVI and pVII). (D) HAdV-C5 grown in the presence of nelfinavir (HAdV-C5+Nelfinavir) binds to naive A549 cells similarly to HAdV-C5 from control cells. Cells were incubated with the virus at 4°C for 1 h and fixed with PFA. Images are maximal projections of confocal z stacks and also show zoomed-in views (gray squares). Bars = 20 μm. (E) Particles produced in the presence of nelfinavir are fully infectious. A549 cells were inoculated with purified HAdV-C5 and incubated in the absence or presence of nelfinavir for 44 hpi. Shown are data for infection analyses by antihexon immunofluorescence staining and cell numbers derived from Hoechst staining. Bars represent means from four technical replicates. Error bars indicate standard deviations.
FIG 3
FIG 3
Nelfinavir is a postexposure inhibitor of HAdV-C egress. (A) A549 cells were imaged at 3 days postinoculation with 1:10-diluted cell lysates (left) or supernatants (right) from nelfinavir-treated or control A549 cells, which had been infected with HAdV-C2-dE3B-GFP for the indicated times (harvested [hpi]). The results show delayed viral progeny release into the supernatant of nelfinavir-treated cells. Nuclei are shown in blue, and infection markers are shown in green (GFP). (B) Released and cell-associated progeny from HAdV-C2-dE3B-GFP-infected A549 cells treated with nelfinavir or DMSO (green), as determined by titration on A549 cells in a 12-well assay format. Lines indicate mean slopes, and dotted lines indicate standard errors. Linear regression of data from three biological triplicates is shown. (C) Time-resolved emergence of plaques in HAdV-C2-dE3B-GFP-infected A549 cells treated with 1.25 μM nelfinavir. Data points represent results from one of eight technical replicates. Colored vertical lines indicate the means, and error bars indicate the standard deviations. (D) The inhibitory effect of nelfinavir on HAdV-C2-dE3B-GFP spread is dependent on the amount of input virus during initial infection. The number of infected GFP-positive cells is shown at 3 μM nelfinavir relative to the mean number of solvent-treated cells infected with the corresponding dosage. Note that the number of infected cells at 43 hpi is not affected by nelfinavir treatment. Data points represent means from four technical replicates. Dotted lines indicate standard deviations. (E) Treatment of HAdV-C2-dE3B-GFP-infected A549 cells with 1.25 μM nelfinavir suppresses comet-shaped plaques and reveals slow-growing quasiround plaques. Viral GFP expression levels are shown as 16-color look-up table (LUT). Bar = 1 mm. (F) Treatment with 1.25 μM nelfinavir inhibits HAdV-C2-dE3B-GFP infection of A549 cells by slowing plaque formation. Data points represent means from 24 technical replicates, including the well shown in the micrographs of panel D. Error bars indicate standard deviations. Statistical significance of drug-treated versus nontreated cells was derived by the Kolmogorov-Smirnov test, with a P value of <0.0001 (****). (G) The delayed HAdV-C2-dE3B-GFP plaques in the presence of 1.25 μM nelfinavir are significantly rounder than control plaques, as indicated by a Kolmogorov-Smirnov test. Data points indicate plaque regions in the well center harboring a single peak region. Shown is a summary of data from 24 technical replicates, including the well shown in the micrographs of panel D. Regions consisting of at least 5 infected cells (≥1,500 μm2) were considered a plaque. Plaque morphologies in control wells could not be quantified later than 3 dpi due to rapid virus dissemination. For plaques from DMSO-treated cells at 3 dpi compared to nelfinavir-treated ones at 5 dpi, the approximate P value was <0.0001 (****). For DMSO-treated plaques at 3 dpi versus nelfinavir-treated plaques at 6 dpi, the approximate P value was <0.0001 (****). Statistical significance was determined by a Kolmogorov-Smirnov test.
FIG 4
FIG 4
ADP contributes to the inhibitory effect of nelfinavir against HAdV-C. (A) The deletion of ADP from HAdV-C2-dE3B-GFP delays plaque formation in A549 cells by 1 day but does not change plaque shape. Cells were infected with 1.1 × 10⁵ VP/well. (B) The deletion of ADP from HAdV-C2-dE3B-GFP reduces the antiviral effects of nelfinavir in A549 cells, with an EC50 of 5.82 compared to 0.22 μM for the parental virus. HAdV-C2-dE3B-GFP infection was quantified at 72 hpi, and ADP deletion mutant infection was quantified at 96 hpi. Plaque numbers per well were normalized to the mean DMSO control value. Numbers of nuclei in noninfected, treated wells were normalized to the mean for the DMSO control. Data points represent means from four technical replicates. Error bars indicate standard deviations. EC50 values were derived from nonlinear curve fitting. For detailed information and statistics, see Table S2 in the supplemental material. (C) The delay of dell death was calculated from the highest mean cell index (CI) and its half-maximum for each treatment (means from two technical replicates). For HAdV-C2-dE3B-GFP-infected A549 cells treated with 25 μM nelfinavir, the measurement was aborted due to overgrowth causing cytotoxicity before the maximal cell index was reached. Treatment with 100 μM nelfinavir was toxic. (D) TI50 derived from the ratio of the nelfinavir concentration causing 50% toxicity (TC50) and the concentration leading to a 50% reduction in plaque numbers per well (EC50). Results from different cancer and primary cells are shown for HAdV-C2-dE3B-GFP and HAdV-C2-dE3B-dADP lacking ADP. For detailed information and statistics, see Table S2. (E, left) Representative high-magnification confocal images of HAdV-C2-dE3B-GFP-infected A549 cells at 44 hpi showing the effect of nelfinavir on ADP localization. ADP was stained by immunofluorescence with a rabbit anti-HAdV-C2-ADP87–101 antibody. Cells were stained using NHS-ester. White arrowheads highlight infected cells. Nuclei are in blue. Images are maximal projections of 30 z planes with 0.5-μm z steps. (Right) Relative units (RU) of total ADP expression, localization to the nuclear rim, and granularity normalized to the mean values from DMSO-treated control cells. The data set is comprised of 20 nelfinavir-treated infected cells and 23 control cells. Solid lines indicate medians, and dotted lines indicate the 5 to 95% quantiles. The Kolmogorov-Smirnov test indicated an ADP granularity P value of 0.0019 (**).
FIG 5
FIG 5
Round-plaque phenotypes in the presence of neutralizing anti-HAdV-C2 antibodies and in unperturbed HAdV-C2 infections. (A) Schematic overview of pathogen transmission routes in cell cultures. Cell lysis kills the donor cell and releases progeny, while nonlytic egress preserves the infected donor cell. Convection in the medium leads to long-distance, comet-shaped plaques, and cell-free virus transmission is susceptible to neutralizing antibodies (Abs). In contrast, direct cell-to-cell spread of the virus gives rise to symmetric slow-growing plaques resistant to neutralizing antibodies. Axes indicate side or top-down views. (B) Inhibition of cell-free HAdV-C2-dE3B-GFP transmission by anti-HAdV-C2/5 neutralizing serum. Nuclei are shown in blue. (C) Infection of A549 cells with limiting amounts of HAdV-C2-dE3B-GFP (<1 PFU/well; 9 to 75 VP/well) in 160 wells gives rise to 33 single plaques/well. Twenty-four wells contained GFP-positive comet-shaped plaques (top), and nine developed delayed round plaques (bottom). Dashed colored squares indicate magnified regions of the first-round infected cell below. An infected cell leading to a comet-shaped plaque (top, pink arrows) lyses at 3 dpi, as indicated by the loss of the GFP signal. An infected cell giving rise to a round plaque (bottom, orange arrows) remains GFP positive. Bar = 1 mm.
FIG 6
FIG 6
Susceptibility of HAdV to nelfinavir correlates with plaque shape. (A) TI50 calculated from the ratio of the nelfinavir concentration causing 50% toxicity (TC50) and the concentration leading to 50% plaque reduction (EC50). Different HAdVs, mouse adenoviruses (MAdV), and herpes simplex virus 1 (HSV-1) were tested in different cancer and primary cell lines. For detailed information and statistics, see Table S2 in the supplemental material. (B) Representative microscopic and macroscopic plaque morphologies of nelfinavir-sensitive and -insensitive HAdV types. Grayscale images show plaques based on epifluorescence microscopy of hexon immunostaining or GFP expression in A549 cells (96-well format) (bar = 1 mm). Colored images show plaques visualized by crystal violet staining in A549 cells (12-well format) (bar = 5 mm).

Similar articles

Cited by

References

    1. Rowe WP, Huebner RJ, Gilmore LK, Parrott RH, Ward TG. 1953. Isolation of a cytopathogenic agent from human adenoids undergoing spontaneous degeneration in tissue culture. Proc Soc Exp Biol Med 84:570–573. doi:10.3181/00379727-84-20714. - DOI - PubMed
    1. Ismail AM, Zhou X, Dyer DW, Seto D, Rajaiya J, Chodosh J. 2019. Genomic foundations of evolution and ocular pathogenesis in human adenovirus species D. FEBS Lett 593:3583–3608. doi:10.1002/1873-3468.13693. - DOI - PMC - PubMed
    1. Harrach B, Tarján ZL, Benkő M. 2019. Adenoviruses across the animal kingdom: a walk in the zoo. FEBS Lett 593:3660–3673. doi:10.1002/1873-3468.13687. - DOI - PubMed
    1. Mei Y-F, Lindman K, Wadell G. 2002. Human adenoviruses of subgenera B, C, and E with various tropisms differ in both binding to and replication in the epithelial A549 and 293 cells. Virology 295:30–43. doi:10.1006/viro.2002.1359. - DOI - PubMed
    1. Lynch JP, Kajon AE. 2016. Adenovirus: epidemiology, global spread of novel serotypes, and advances in treatment and prevention. Semin Respir Crit Care Med 37:586–602. doi:10.1055/s-0036-1584923. - DOI - PMC - PubMed

Publication types