. 2020 Jul 14;117(28):16250-16257.
doi: 10.1073/pnas.2002148117. Epub 2020 Jun 29.

Ethnolinguistic diversity and urban agglomeration

Affiliations

Ethnolinguistic diversity and urban agglomeration

Ulrich J Eberle et al. Proc Natl Acad Sci U S A. .

Abstract

This article shows that higher ethnolinguistic diversity is associated with a greater risk of social tensions and conflict, which, in turn, is a dispersion force lowering urbanization and the incentives to move to big cities. We construct a worldwide dataset at a fine-grained level on urban settlement patterns and ethnolinguistic population composition. For 3,540 provinces of 170 countries, we find that increased ethnolinguistic fractionalization and polarization are associated with lower urbanization and an increased role for secondary cities relative to the primate city of a province. These striking associations are quantitatively important and robust to various changes in variables and specifications. We find that democratic institutions affect the impact of ethnolinguistic diversity on urbanization patterns.

Keywords: conflict; democracy; ethnolinguistic diversity; fractionalization; urbanization.


Conflict of interest statement

The authors declare no competing interest.

Figures

Fig. 1.
Fig. 1.
Global map of ethnolinguistic fractionalization at the province level. Fractionalization is calculated at language tree level 15. See Data and Methods for data sources and construction.
Fig. 2.
Fig. 2.
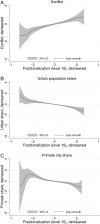
Distributions and regressions: ethnolinguistic fractionalization, conflict, and urban concentration. The unit of observation is a province. The sample includes 3,540 provinces worldwide. The graphs depict kernel-weighted local polynomial regressions of first degree. The plots show the association between different outcome variables on the vertical axis and fractionalization on the horizontal axis. Each variable’s country mean is subtracted. Fractionalization is calculated at language tree level 15 for the year 1975. (A) Conflict is reported for 3,169 provinces in 154 countries. The outcome variable indicates provinces with at least one ethnic group involved in a conflict incident (implying at least 25 deaths) during the period 1975–2015, with data from the Geographical Research on War United Platform. (B and C) Urbanization indices for the year 2015 calculated with data from the GHSL. (B) Urban share is the share of urban population of a province divided by the total population. (C) Primate share is the population of the largest city in a province divided by the total population of all other cities in the province.
Fig. 3.
Fig. 3.
The use of ethnologue language trees: illustration for the Indian province Himachal Pradesh. The graph depicts the language tree of Himachal Pradesh. The languages of Himachal Pradesh are divided in up to eight levels, with level 1 being the most aggregated and level 8 being the least aggregated level. The endpoint (underlined) of each branch depicts the commonly used name of a language. The language tree is based on data by Ethnologue. Four very minor languages at the extension of Western Pahari are omitted, for presentation purposes.
Fig. 4.
Fig. 4.
Ethnolinguistic fractionalization, conflict, and urban concentration: results for different aggregation levels. Regression results of the two measures of urban concentration and conflict incident on ethnolinguistic fractionalization, at all 15 linguistic aggregation levels. (A and B) The regressions performed control for country fixed effects, ruggedness, and 1975 population density and 1975 outcome variables, as specified in the longitudinal regressions in columns 2 and 6 of Table 1 for aggregation level 15. (C) The regressions performed are as specified in column 3 of SI Appendix, Table S8. Point estimates are shown as dots, and CIs at the 95% level are shown as bars.

References

    1. Montalvo J. G., Reynal-Querol M., Ethnic polarization, potential conflict, and civil wars. Am. Econ. Rev. 95, 796–816 (2005).
    1. Esteban J., Mayoral L., Ray D., Ethnicity and conflict: An empirical study. Am. Econ. Rev. 102, 1310–1342 (2012).
    1. Esteban J., Morelli M., Rohner D., Strategic mass killings. J. Polit. Econ. 123, 1087–1132 (2015).
    1. Mueller H. F., Rohner D., Schönholzer D., “The peace dividend of distance: Violence as interaction across space” (Discuss. Pap. 11897, Centre for Economic Policy Research, 2017).
    1. Henderson V., The urbanization process and economic growth: The so-what question. J. Econ. Growth 8, 47–71 (2003).

Publication types

LinkOut - more resources