. 2020 Jul 14;117(28):16616-16625.
doi: 10.1073/pnas.1916121117. Epub 2020 Jun 29.

OGT suppresses S6K1-mediated macrophage inflammation and metabolic disturbance

Affiliations

OGT suppresses S6K1-mediated macrophage inflammation and metabolic disturbance

Yunfan Yang et al. Proc Natl Acad Sci U S A. .

Abstract

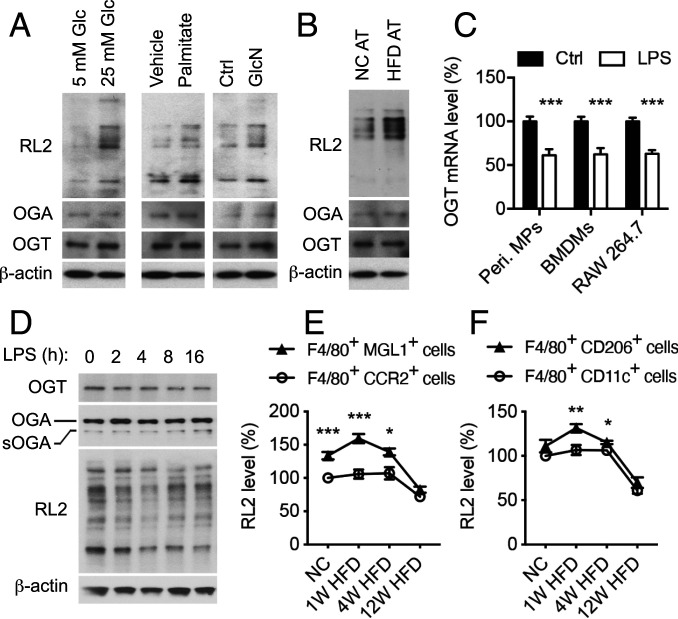
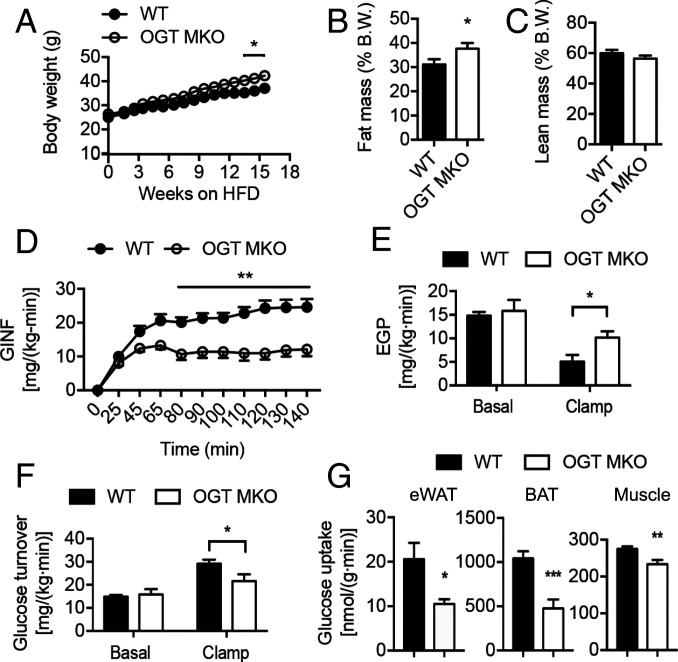
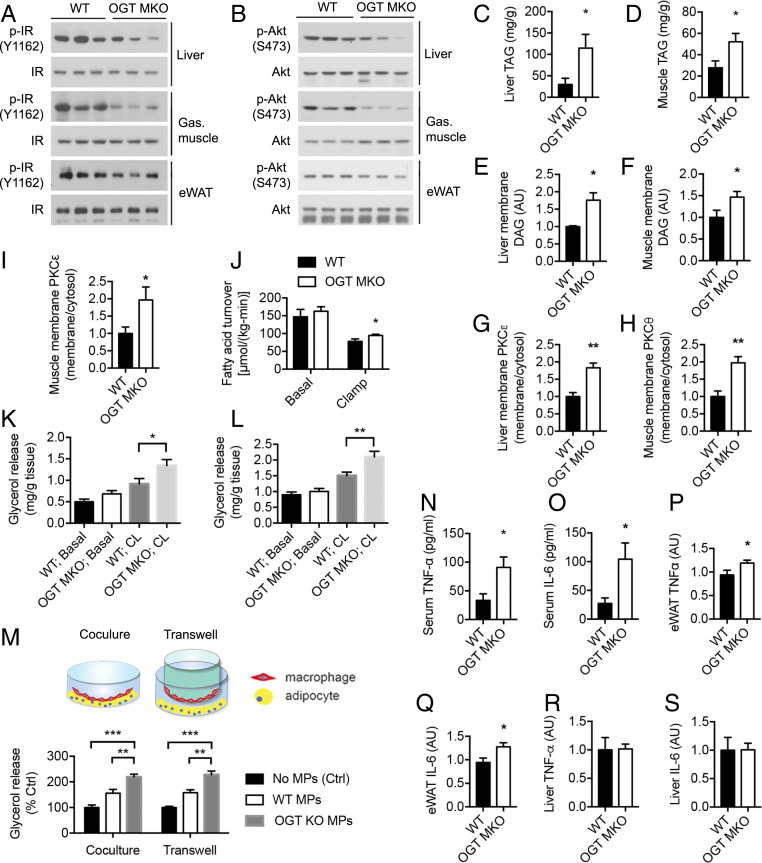
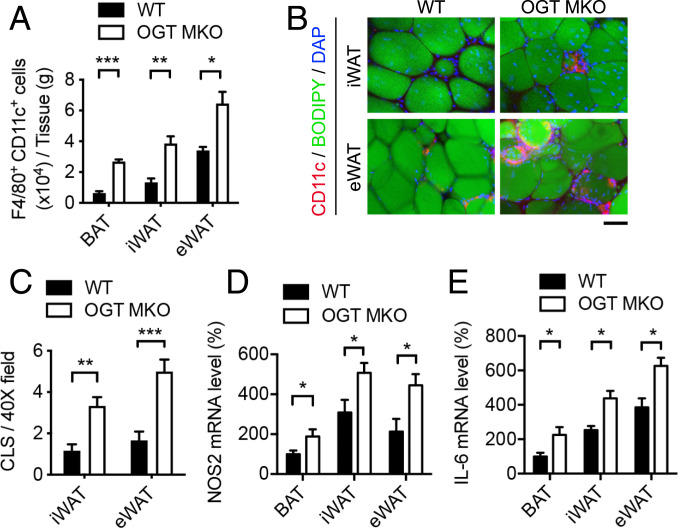
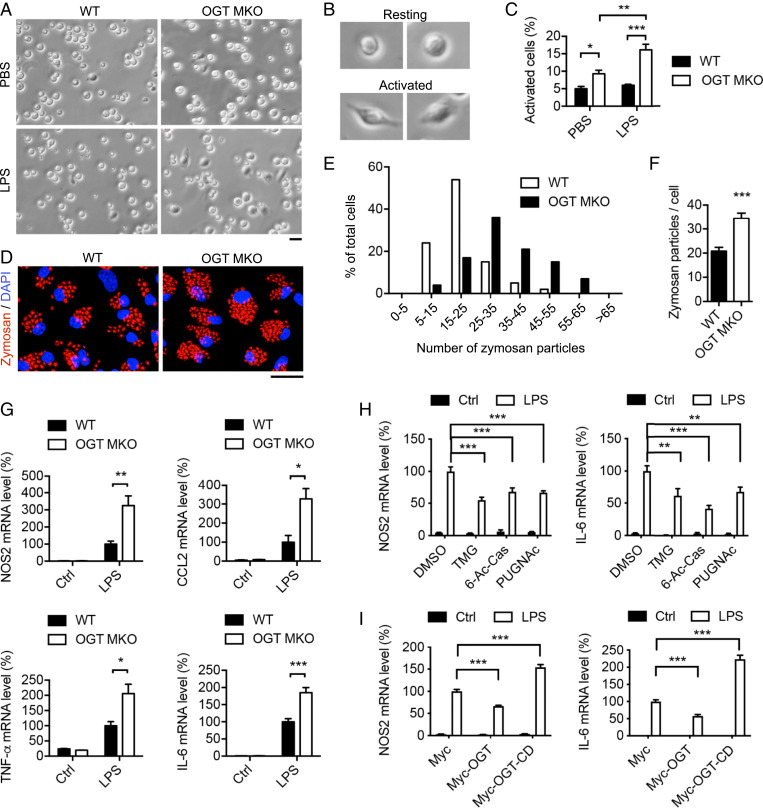
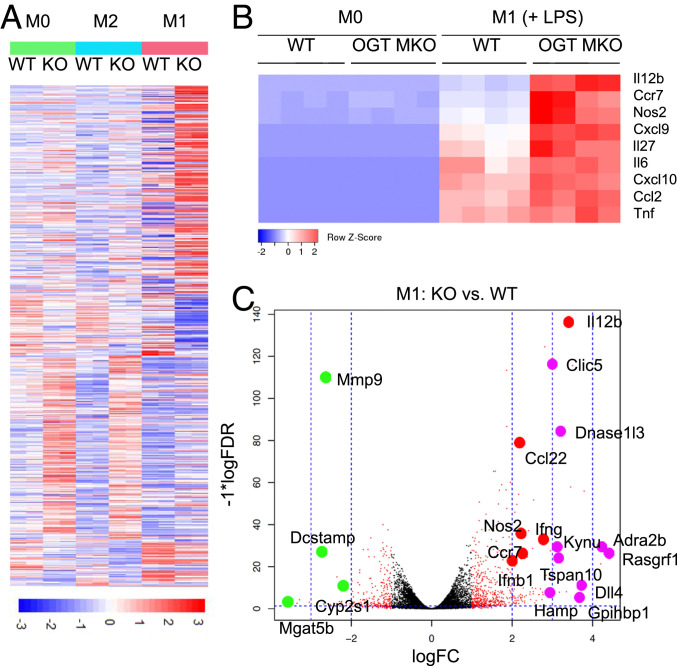
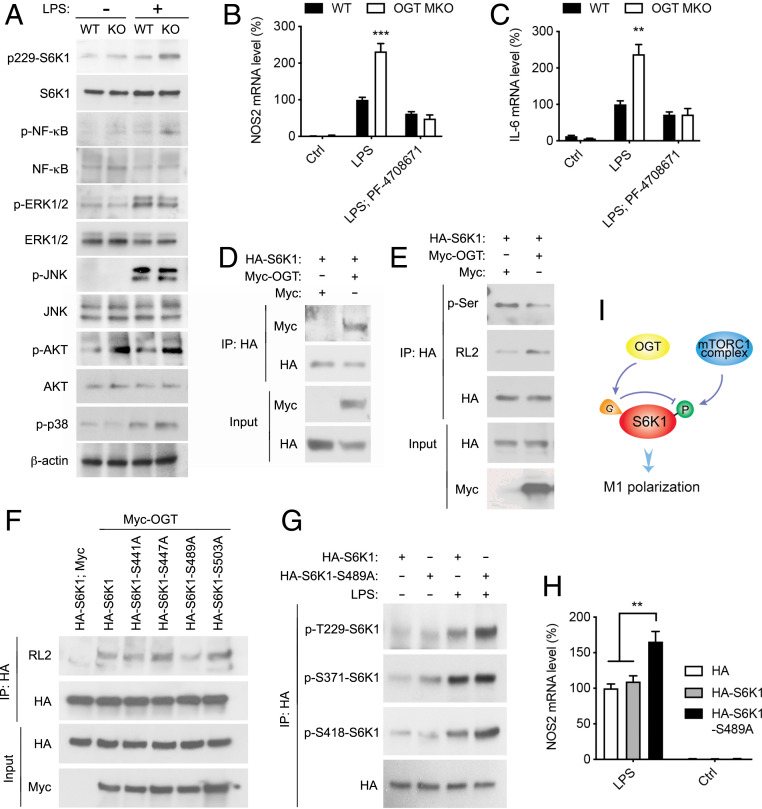
Enhanced inflammation is believed to contribute to overnutrition-induced metabolic disturbance. Nutrient flux has also been shown to be essential for immune cell activation. Here, we report an unexpected role of nutrient-sensing O-linked β-N-acetylglucosamine (O-GlcNAc) signaling in suppressing macrophage proinflammatory activation and preventing diet-induced metabolic dysfunction. Overnutrition stimulates an increase in O-GlcNAc signaling in macrophages. O-GlcNAc signaling is down-regulated during macrophage proinflammatory activation. Suppressing O-GlcNAc signaling by O-GlcNAc transferase (OGT) knockout enhances macrophage proinflammatory polarization, promotes adipose tissue inflammation and lipolysis, increases lipid accumulation in peripheral tissues, and exacerbates tissue-specific and whole-body insulin resistance in high-fat-diet-induced obese mice. OGT inhibits macrophage proinflammatory activation by catalyzing ribosomal protein S6 kinase beta-1 (S6K1) O-GlcNAcylation and suppressing S6K1 phosphorylation and mTORC1 signaling. These findings thus identify macrophage O-GlcNAc signaling as a homeostatic mechanism maintaining whole-body metabolism under overnutrition.

Keywords: RNA sequencing; immunometabolism; knockout mice; metabolic homeostasis.


Conflict of interest statement

The authors declare no competing interest.

Figures

Fig. 1.
Fig. 1.
Nutrient-sensing O-GlcNAc signaling is regulated during overnutrition and macrophage activation. (A) Western blot analysis of OGT, OGA, and overall O-GlcNAcylation levels in mouse peritoneal macrophages after 2 h of treatment. “Vehicle” was 0.2% BSA and “Ctrl” was culture medium. GlcN was used as a positive control. RL2 recognizes O-GlcNAc modification on proteins. (B) Western blot analysis of OGT, OGA, and overall O-GlcNAcylation levels in mouse peritoneal macrophages cocultured with epididymal white AT of NC-fed and HFD-fed mice for 2 h. (C) Ogt mRNA level in mouse peritoneal macrophages (peri. MPs), mouse BMDMs, and RAW 264.7 macrophage cells (n = 4 to 8). LPS was used to stimulate M1 polarization. (D) Representative Western blots of OGT, OGA, and overall O-GlcNAcylation levels in mouse BMDMs. LPS was used to stimulate M1 polarization. (E and F) Flow cytometric analysis of average intensity of O-GlcNAc (RL2) staining of macrophage subpopulations including F4/80+ CCR2+ cells, F4/80+ MGL1+ cells (E), F4/80+ CD11c+ M1-like macrophages, and F4/80+ CD206+ M2-like macrophages (F) in the SVF of eWAT from NC-fed, 1-wk HFD-fed, 4-wk HFD-fed, and 12-wk HFD-fed WT mice (n = 4 to 6). Data are shown as mean ± SEM; *P < 0.05, **P < 0.01, ***P < 0.001 by unpaired Student’s t test.
Fig. 2.
Fig. 2.
OGT MKO mice are prone to diet-induced metabolic dysfunction. (A) Body weight of HFD-fed WT and OGT MKO mice. (B and C) Fat mass (B) and lean mass (C) of 18-wk HFD-fed WT and OGT MKO mice (n = 12 to 19). (D) GINF rate to maintain euglycemia during hyperinsulinemic–euglycemic clamps in 8-wk HFD-fed WT and OGT MKO mice. (E and F) EGP rate (E) and whole-body glucose turnover rate (F) in both basal (without insulin stimulation) and clamps (with insulin stimulation) states in 8-wk HFD-fed WT and OGT MKO mice. (G) Glucose uptake in eWAT, BAT, and gastrocnemius muscle under insulin-stimulated condition in 8-wk HFD-fed WT and OGT MKO mice (n = 5 to 8). Data are shown as mean ± SEM; *P < 0.05, **P < 0.01, ***P < 0.001 by unpaired Student’s t test.
Fig. 3.
Fig. 3.
Loss of macrophage OGT promotes inflammation, AT lipolysis, and ectopic lipid accumulation and insulin resistance in liver and muscle. (A) Western blots of insulin-stimulated IR phosphorylation (Y1162) in liver, gastrocnemius muscle, and eWAT of 8-wk HFD-fed WT and OGT MKO mice after overnight fasting. (B) Western blots of insulin-stimulated Akt phosphorylation (S473) in liver, gastrocnemius muscle, and eWAT of 8-wk HFD-fed WT and OGT MKO mice after overnight fasting. (C and D) Triglyceride (TAG) levels in liver (n = 4) and gastrocnemius muscle (n = 9 to 11) of 12-wk HFD-fed WT and OGT MKO mice. (E and F) Membrane DAG levels in liver and gastrocnemius muscle of 12-wk HFD-fed WT and OGT MKO mice (n = 6 to 14). (G) Hepatic membrane/cytosolic PKCε ratio in 12-wk HFD-fed WT and OGT MKO mice. (H and I) Membrane/cytosolic PKCθ and PKCε ratio in gastrocnemius muscle of 12-wk HFD-fed WT and OGT MKO mice (n = 5). (J) Whole-body fatty acid turnover of 8-wk HFD-fed WT and OGT MKO mice (n = 6). (K and L) Basal and stimulated (10 μM CL-316,243) lipolysis measured by glycerol released from tissue trunks of iWAT (K) and eWAT (L) of 12-wk HFD-fed WT and OGT MKO mice (n = 10 to 12). (M) Scheme and glycerol release rate of in vitro cultured adipocytes when cocultured with WT and OGT KO peritoneal macrophages in contact (Coculture) and noncontact (Transwell) manners. (NS) TNF-α and IL-6 levels in serum (N and O), eWATs (P and Q), and livers (R and S) of 8-wk HFD-fed WT and OGT MKO mice. Data are shown as mean ± SEM (n = 5 to 8). *P < 0.05, **P < 0.01, ***P < 0.001 by two-way ANOVA with Dunnett multiple comparisons for KM. *P < 0.05, **P < 0.01 by unpaired Student’s t test for other panels.
Fig. 4.
Fig. 4.
Loss of macrophage OGT promotes AT inflammation. (A) Quantification of flow cytometric analysis of F4/80+ CD11c+ cells in BAT, iWAT, and eWAT from 12-wk HFD-fed WT and OGT MKO mice (n = 4). (B) Whole-mount staining of iWAT and eWAT of 12-wk HFD-fed WT and OGT MKO mice showing adipocytes (BODIPY FL, stains lipids) and macrophages (CD11c+ cells) in CLSs. (Scale bar, 80 μm.) (C) Quantitative results of CLSs in iWAT and eWAT of 12-wk HFD-fed WT and OGT MKO mice (n = 6). (D and E) Nos2 and Il-6 mRNA levels in BAT, iWAT, and eWAT of 12-wk HFD-fed WT and OGT MKO mice (n = 4 to 8). Data are shown as mean ± SEM; *P < 0.05, **P < 0.01, ***P < 0.001 by unpaired Student’s t test.
Fig. 5.
Fig. 5.
O-GlcNAc signaling suppresses macrophage proinflammatory activation. (AC) Bright-field imaging and statistical analysis of unstimulated and LPS-stimulated activation of peritoneal macrophages isolated from WT and OGT MKO mice (n = 4 to 8). (Scale bar, 20 μm.) (DF) Fluorescence imaging and statistical analysis of phagocytosis of zymosan particles by WT and OGT KO BMDMs. (Scale bar, 20 μm.) (G) Macrophage M1 marker Nos2, Ccl2, TNF-α, and Il-6 mRNA levels in unstimulated and LPS-stimulated WT and OGT KO BMDMs (n = 3 to 6). (H) Nos2 and Il-6 mRNA levels in DMSO-, TMG-, 6-Ac-Cas-, and PUGNAc-treated BMDMs under unstimulated and LPS-stimulated conditions (n = 6). (I) Nos2 and Il-6 mRNA levels in Myc-, Myc-OGT–, and Myc-OGT-CD–overexpressing BMDMs under unstimulated and LPS-stimulated conditions (n = 4). Data are shown as mean ± SEM. *P < 0.05, **P < 0.01, ***P < 0.001 by two-way ANOVA with Dunnett multiple comparisons for C, H, and I. *P < 0.05, **P < 0.01, ***P < 0.001 by unpaired Student’s t test for other panels.
Fig. 6.
Fig. 6.
RNA sequencing analysis reveals a preferential regulation of macrophage M1 polarization by OGT. (A) Heat map showing the DEGs between WT and OGT KO BMDMs, where colors indicate counts per million values scaled by row (n = 4). (B) Heat maps of expression levels of M1 macrophage markers determined by RNA sequencing. (C) Volcano plot showing top DEGs between M1-polarized WT and OGT KO BMDMs. Red dot-labeled genes are up-regulated in OGT KO BMDMs and are closely related to M1 polarization. Purple and green dot-labeled genes have known functions related to M1 polarization and are up- and down-regulated in OGT KO BMDMs, respectively.
Fig. 7.
Fig. 7.
OGT inhibits macrophage proinflammatory polarization by suppressing mTORC1/S6K1 signaling. (A) Western blot analysis showing the activation of S6K1, NF-κB, ERK, JNK, p38 MAPK, and Akt in unstimulated and LPS-stimulated (30 min) WT and OGT KO peritoneal macrophages. (B and C) Nos2 and Il-6 mRNA levels in unstimulated, LPS-stimulated, and PF-04708671-pretreated LPS-stimulated WT and OGT KO BMDMs (n = 4). (D) Immunoprecipitation (IP) and Western blot analysis showing the interaction between exogenously expressed HA-S6K1 and Myc-OGT in HeLa cells. (E) IP and Western blot analysis showing that OGT overexpression enhances S6K1 O-GlcNAcylation and decreases S6K1 serine phosphorylation in HeLa cells. (F) IP and Western blot analysis showing that serine 489 to alanine (S489A) mutation in S6K1 greatly abolished the overall O-GlcNAcylation on S6K1 in HeLa cells. (G) IP and Western blot analysis showing that S489A mutation in S6K1 enhanced LPS-induced S6K1 phosphorylation on threonine 229 (T229) and S418 in RAW 264.7 cells. (H) Nos2 mRNA levels in untreated and LPS-stimulated RAW 264.7 cells overexpressing HA, HA-S6K1, and HA-S6K1-S489A (n = 4 to 6). (I) Molecular model for OGT function in mTORC1/S6K1 signaling. Data are shown as mean ± SEM. **P < 0.01 by two-way ANOVA with Dunnett multiple comparisons for H. **P < 0.01, ***P < 0.001 by unpaired Student’s t test for other panels.

References

    1. Shulman G. I., Ectopic fat in insulin resistance, dyslipidemia, and cardiometabolic disease. N. Engl. J. Med. 371, 2237–2238 (2014). - PubMed
    1. Kahn S. E., Hull R. L., Utzschneider K. M., Mechanisms linking obesity to insulin resistance and type 2 diabetes. Nature 444, 840–846 (2006). - PubMed
    1. Gregor M. F., Hotamisligil G. S., Inflammatory mechanisms in obesity. Annu. Rev. Immunol. 29, 415–445 (2011). - PubMed
    1. Saltiel A. R., Olefsky J. M., Inflammatory mechanisms linking obesity and metabolic disease. J. Clin. Invest. 127, 1–4 (2017). - PMC - PubMed
    1. Reilly S. M., Saltiel A. R., Adapting to obesity with adipose tissue inflammation. Nat. Rev. Endocrinol. 13, 633–643 (2017). - PubMed

Publication types

MeSH terms

Substances