. 2020 Jul 14;117(28):16606-16615.
doi: 10.1073/pnas.1921294117. Epub 2020 Jun 29.

Mechanisms underlying homeostatic plasticity in the Drosophila mushroom body in vivo

Affiliations

Mechanisms underlying homeostatic plasticity in the Drosophila mushroom body in vivo

Anthi A Apostolopoulou et al. Proc Natl Acad Sci U S A. .

Abstract

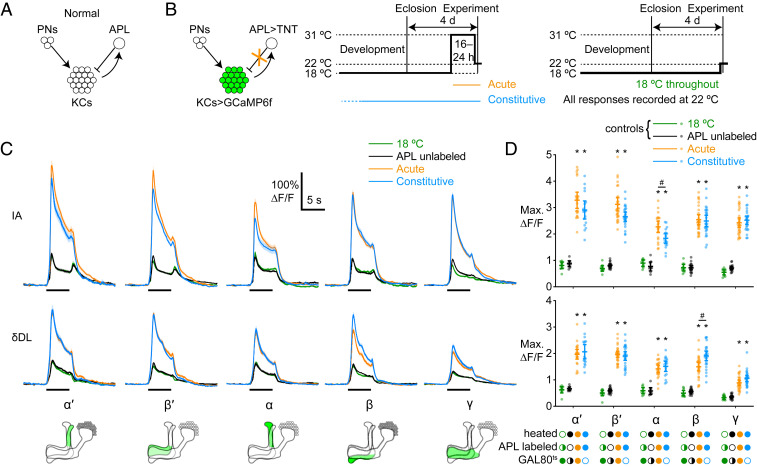
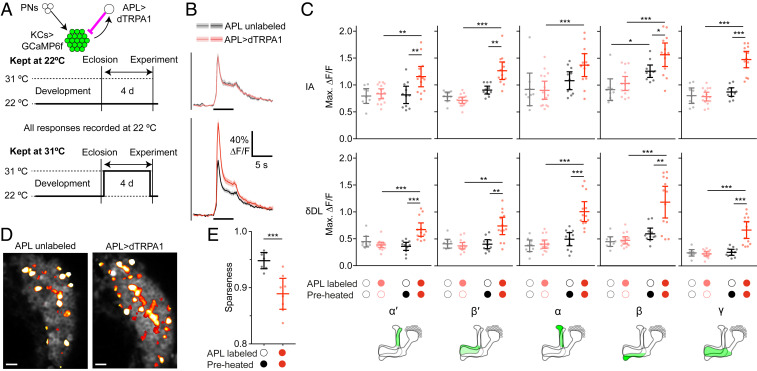
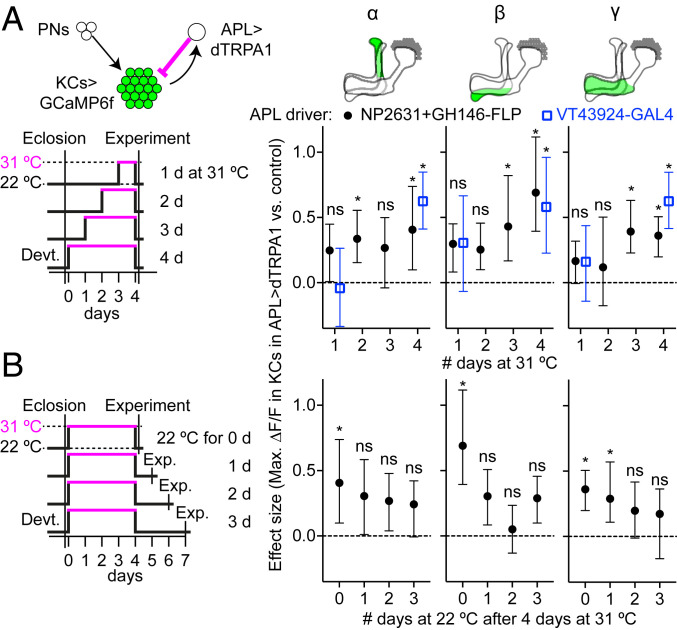
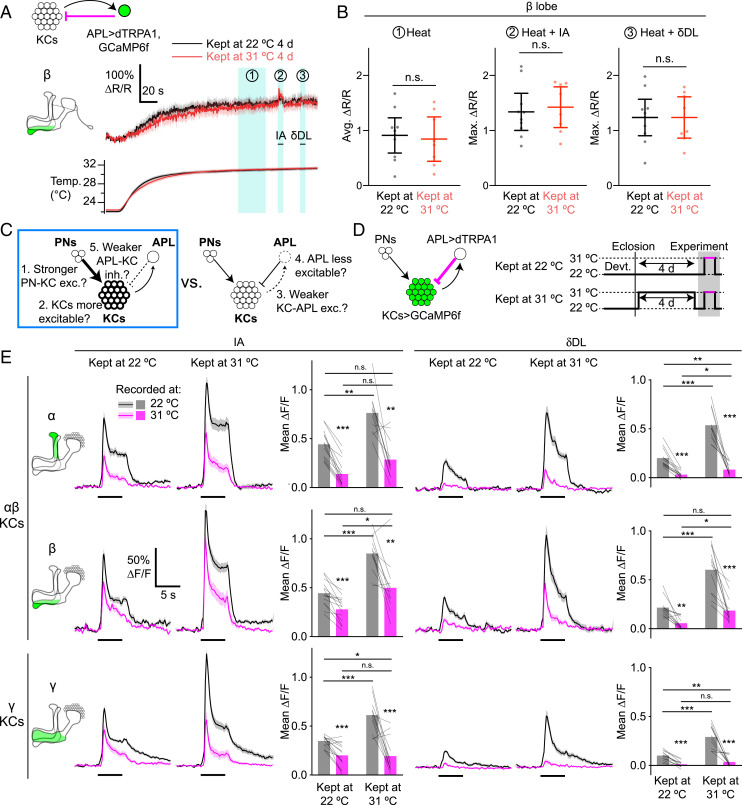
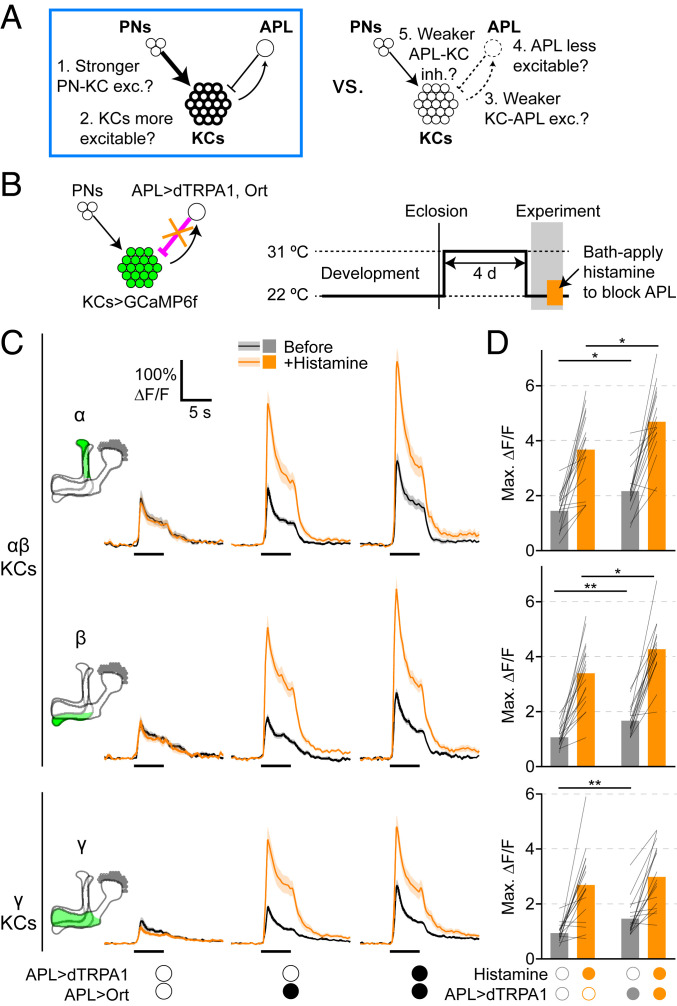
Neural network function requires an appropriate balance of excitation and inhibition to be maintained by homeostatic plasticity. However, little is known about homeostatic mechanisms in the intact central brain in vivo. Here, we study homeostatic plasticity in the Drosophila mushroom body, where Kenyon cells receive feedforward excitation from olfactory projection neurons and feedback inhibition from the anterior paired lateral neuron (APL). We show that prolonged (4-d) artificial activation of the inhibitory APL causes increased Kenyon cell odor responses after the artificial inhibition is removed, suggesting that the mushroom body compensates for excess inhibition. In contrast, there is little compensation for lack of inhibition (blockade of APL). The compensation occurs through a combination of increased excitation of Kenyon cells and decreased activation of APL, with differing relative contributions for different Kenyon cell subtypes. Our findings establish the fly mushroom body as a model for homeostatic plasticity in vivo.

Keywords: Drosophila; homeostatic plasticity; mushroom body; olfaction.


Conflict of interest statement

The authors declare no competing interest.

Figures

Fig. 1.
Fig. 1.
Kenyon cells show little compensation for loss of inhibition from APL. (A) Schematic of mushroom body circuitry. Kenyon cells receive feedforward excitation from projection neurons and feedback inhibition from APL. (B) Diagram of genotype (green shows GCaMP6f expression; the orange “X” shows blockade with TNT) and experimental protocol. Flies were raised at 18 °C, collected 0 to 1 d after eclosion, and then kept at 18 °C for 3 d and heated to 31 °C for 16 to 24 h (Center) or kept at 18 °C for 4 d (Right) before the imaging experiment, which was always done at 22 °C. (C) Responses of different KC lobes to isoamyl acetate (IA; Top) or δ-decalactone (δDL; Middle), imaged with GCaMP6f. Black bars indicate 5-s odor pulse; shading indicates SEM. (C, Bottom) Diagrams show the locations of different lobes in the mushroom body (green; medial is left, and dorsal is up). See also SI Appendix, Figs. S2 and S3. (D) Maximum ∆F/F of data from C. Half-filled circles indicate the category pooled data, that is, APL labeled and unlabeled (green), with GAL80ts and without (black). Mean ± 95% CIs. #P < 0.05 between acute vs. constitutive; *P < 0.001 between TNT expressed (acute or constitutive) vs. TNT not expressed (18 °C or APL unlabeled), ANOVA (see SI Appendix, Table S2 for details). n, given as the number of hemispheres (number of flies), left to right: α′ and α, 9 (5), 9 (7), 22 (15), 17 (10); β′, β, and γ, 10 (5), 19 (14), 28 (19), 26 (15).
Fig. 2.
Fig. 2.
Kenyon cell odor responses are higher following prolonged excess inhibition from APL. (A) Diagram of genotype (green shows GCaMP6f expression; magenta shows activation with dTRPA1) and experimental protocol. Flies were raised at 22 °C, collected 0 to 1 d after eclosion, kept at 22 °C (control) or 31 °C (preheated) for 4 d, and returned to 22 °C for the imaging experiment. (B) Responses of the γ lobe to isoamyl acetate, for flies kept at 22 °C (Upper) or 31 °C (Lower), where APL was unlabeled (gray/black) or expressed dTRPA1 (pink/red). Black bars indicate 5-s odor pulse; shading indicates SEM. Responses of all lobes are shown in SI Appendix, Fig. S4. (C) Maximum ∆F/F of odor responses in all lobes to isoamyl acetate and δ-decalactone. *P < 0.05, **P < 0.01, ***P < 0.001, ANOVA (see SI Appendix, Table S2 for details). n, given as the number of hemispheres (number of flies), left to right within each graph: 9 (8), 15 (11), 11 (7), 13 (8). (D) Activity maps of responses to isoamyl acetate in KC somata. Grayscale shows baseline fluorescence of GCaMP6f; false-color overlay shows odor-responsive pixels. (Scale bars, 10 µm.) (E) Average sparseness to a panel of six odors (δ-decalactone, isoamyl acetate, ethyl butyrate, methylcyclohexanol, 3-octanol, and benzaldehyde; sparseness to each odor is shown separately in SI Appendix, Fig. S5). Mean ± 95% CIs. ***P < 0.001, unpaired t test.
Fig. 3.
Fig. 3.
Adaptation to excess inhibition from APL is most prominent after 4 d and is temporary. (A) Adaptation after 1, 2, 3, or 4 d of APL activation. Flies were raised at 22 °C and collected 0 to 1 d after eclosion, then kept at 22 °C for 0 to 3 d, then kept at 31 °C for 1 to 4 d, and imaged at 22 °C at 4 to 5 d posteclosion. Graphs show effect size of adaptation (maximum ∆F/F of KC response to isoamyl acetate, APL>dTRPA1 minus control), calculated using bootstrap-coupled estimation statistics (84), driving dTRPA1 expression in APL using NP2631+GH146-FLP (black circles; control is APL unlabeled) or VT43924-GAL4 (blue squares; control is UAS-dTRPA1/+). Error bars indicate 95% CIs. In the diagram of the genotype (Upper Left), green shows GCaMP6f expression, and magenta shows activation with dTRPA1. *P < 0.05 for APL>dTRPA1 vs. control, ANOVA (see SI Appendix, Table S2 for details). ns (not significant; P > 0.05) applies to both drivers at 1 d. Full data and sample sizes for all lobes are in SI Appendix, Figs. S9–S11. (B) As in A, except flies were all kept at 31 °C for 4 d, and then kept at 22 °C for 0 to 3 d before imaging. Data for 0 d are repeated from “4 d” in A for comparison. Full data are in SI Appendix, Fig. S12.
Fig. 4.
Fig. 4.
APL odor responses are reduced following adaptation. (A) Diagrams of potential mechanisms that might underlie increased KC odor responses following adaptation. This figure tests mechanisms 1, 2, and 5 vs. mechanisms 3 and 4, and shows evidence for mechanisms 3 and 4 (blue box). (B) Diagram of genotype (APL expresses dTRPA1 and GCaMP6f) and experimental protocol (all flies were raised at 22 °C and kept at 31 °C for 4 d before imaging). (C) Responses of different lobes of APL (as determined by the anatomical marker MB247-dsRed) to isoamyl acetate in APL>GCaMP6f (“No dTRPA1”) or APL>dTRPA1,GCaMP6f (“APL>dTRPA1”) flies kept at 31 °C for 4 d. Diagrams show the locations of different lobes (green) within APL, which innervates the whole mushroom body. Graphs show maximum ∆F/F and mean ± 95% CIs; shading indicates SEM. *P < 0.05, **P < 0.01, unpaired t test or Mann–Whitney U test (see SI Appendix, Table S2 for details). n, given as the number of hemispheres (number of flies), left to right: α′ and α, 12 (9), 12 (8); β′, β, and γ, 12 (9), 13 (8).
Fig. 5.
Fig. 5.
Different KCs show different effects of APL activation after adaptation. (A) APL is equally activated by dTRPA1 regardless of preheating. (A, Upper) Traces show GCaMP6f signal of the β lobe of APL (as determined by the anatomical marker MB247-dsRed), normalized to dsRed signal (hence ∆R/R, not ∆F/F), during perfusion heating of saline, in APL>TRPA,GCaMP6f flies kept at 22 °C (black) or 31 °C (red) for 4 d. Blue shading shows periods used for quantification in B. After the temperature reached a plateau (period 1), isoamyl acetate (period 2) and δ-decalactone (period 3) were presented. (A, Lower) Traces show the saline temperature corresponding to recordings in the Upper traces (same color scheme and timescale). Shading indicates SEM. Other lobes are shown in SI Appendix, Fig. S14. (B) Quantification of periods from A: average ∆R/R during temperature plateau (period 1) and maximum ∆R/R during odors (periods 2 and 3). Maximum ∆R/R is used for odors for consistency with Fig. 4. Graphs show mean ± 95% CIs. n.s., P > 0.05, unpaired t test or Mann–Whitney U test. n, given as the number of hemispheres (number of flies), left to right: 22 °C, 10 (8); 31 °C, 8 (6). (C) This figure tests mechanisms 1, 2, and 5 vs. mechanisms 3 and 4, and shows evidence for mechanisms 1, 2, and 5 (blue box) in αβ KCs. (D) Diagram of genotype (APL expresses dTRPA1; KCs express GCaMP6f) and experimental protocol for E. (E) Traces show responses of the α, β, and γ lobes to isoamyl acetate (Left) and δ-decalactone (Right) in KC>GCaMP6f and APL>dTRPA1 flies kept at 22 or 31 °C for 4 d, recorded at 22 °C (black) or 31 °C (magenta). Only paired recordings are shown (the same fly is recorded at both temperatures). Black bars indicate 5-s odor pulse; shading indicates SEM. Bar graphs quantify traces using mean ∆F/F during the odor pulse (the same color scheme as the traces; bars show the mean; thin lines show paired data recorded at 22 and 31 °C). Data for α′β′ KCs and maximum ∆F/F are given in SI Appendix, Fig. S15. *P < 0.05, **P < 0.01, ***P < 0.001, paired t test or Wilcoxon test (22 vs. 31 °C), unpaired t test or Mann–Whitney U test (across flies), with Holm–Bonferroni correction (see SI Appendix, Table S2 for details). n are as in SI Appendix, Figs. S6 and S7.
Fig. 6.
Fig. 6.
Adaptation effect remains in αβ KCs after removing inhibition from APL. (A) This figure tests mechanisms 1 and 2 vs. mechanisms 3 to 5, and shows evidence for mechanisms 1 and 2 (blue box) in αβ KCs. (B) Diagram of genotype and experimental protocol. Flies were raised at 22 °C, collected 0 to 1 d after eclosion, kept at 31 °C for 4 d, and returned to 22 °C for the imaging experiment. During the experiment, odor responses were recorded before and after bath applying 2 mM histamine. (C) Responses of α, β, and γ lobes to isoamyl acetate before (black) and after (orange) bath applying 2 mM histamine. Genotypes: mixture of hemispheres from APL>Ort and APL>dTRPA1,Ort flies where APL was unlabeled (Left), APL>Ort, APL labeled (Center), and APL>dTRPA1,Ort, APL labeled (Right). Shading indicates SEM. Traces of other lobes and responses to δ-decalactone are shown in SI Appendix, Figs. S16 and S17. (D) Maximum ∆F/F for traces in C. Genotypes: APL>Ort (Left), APL>dTRPA1,Ort (Right). Bars show mean; thin lines show paired data (same hemisphere before and after histamine). The effect of histamine was statistically significant in all cases (P < 0.001, paired t test or Wilcoxon test). *P < 0.05, **P < 0.01, unpaired t test or Mann–Whitney U test, Holm–Bonferroni correction for multiple comparisons (see SI Appendix, Table S2 for details). n, given as the number of hemispheres (number of flies), left to right: no dTRPA1, 17 (11); APL>dTRPA1, 16 (11).

References

    1. Lin A. C., Bygrave A. M., de Calignon A., Lee T., Miesenböck G., Sparse, decorrelated odor coding in the mushroom body enhances learned odor discrimination. Nat. Neurosci. 17, 559–568 (2014). - PMC - PubMed
    1. Olshausen B. A., Field D. J., Sparse coding of sensory inputs. Curr. Opin. Neurobiol. 14, 481–487 (2004). - PubMed
    1. Litwin-Kumar A., Doiron B., Formation and maintenance of neuronal assemblies through synaptic plasticity. Nat. Commun. 5, 5319 (2014). - PubMed
    1. O’Leary T., Williams A. H., Franci A., Marder E., Cell types, network homeostasis, and pathological compensation from a biologically plausible ion channel expression model. Neuron 82, 809–821 (2014). Correction in: Neuron88, 1308 (2015). - PMC - PubMed
    1. Keck T., Hübener M., Bonhoeffer T., Interactions between synaptic homeostatic mechanisms: An attempt to reconcile BCM theory, synaptic scaling, and changing excitation/inhibition balance. Curr. Opin. Neurobiol. 43, 87–93 (2017). - PubMed

Publication types

Substances

LinkOut - more resources