. 2020 Aug 5;40(32):6177-6188.
doi: 10.1523/JNEUROSCI.0258-20.2020. Epub 2020 Jun 29.

Differential Impacts of Repeated Sampling on Odor Representations by Genetically-Defined Mitral and Tufted Cell Subpopulations in the Mouse Olfactory Bulb

Affiliations

Differential Impacts of Repeated Sampling on Odor Representations by Genetically-Defined Mitral and Tufted Cell Subpopulations in the Mouse Olfactory Bulb

Thomas P Eiting et al. J Neurosci. .

Abstract

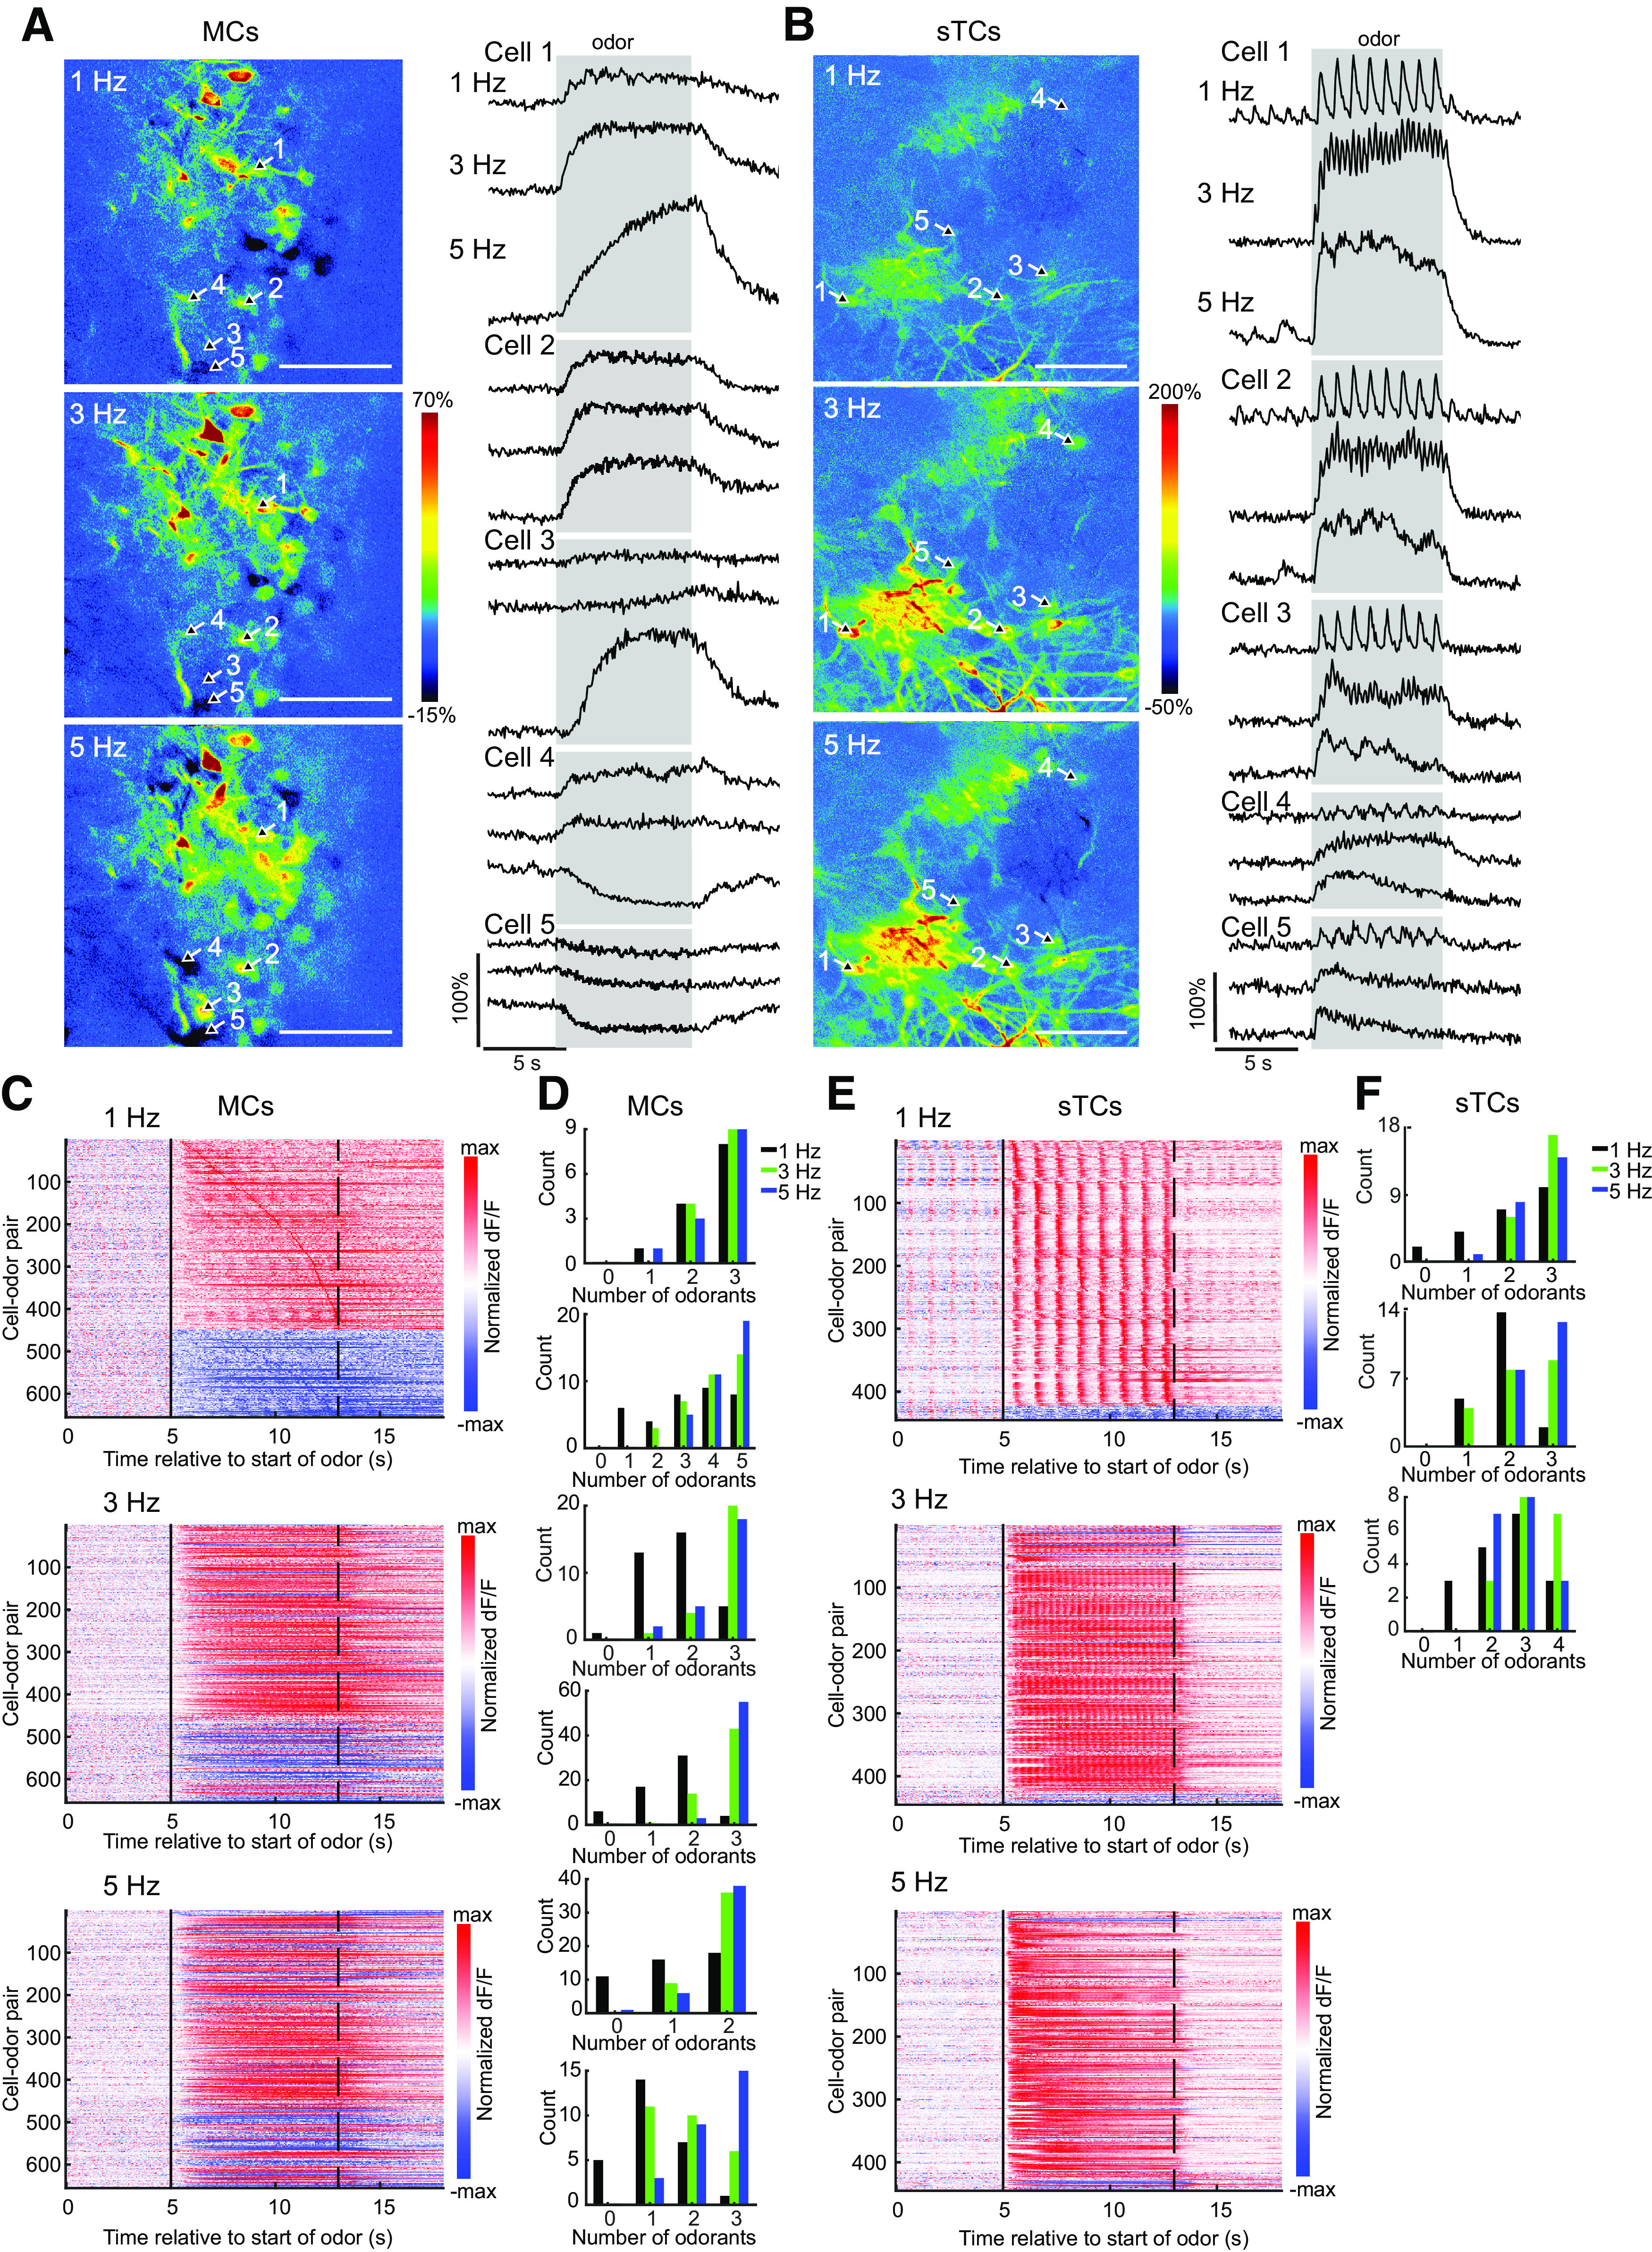
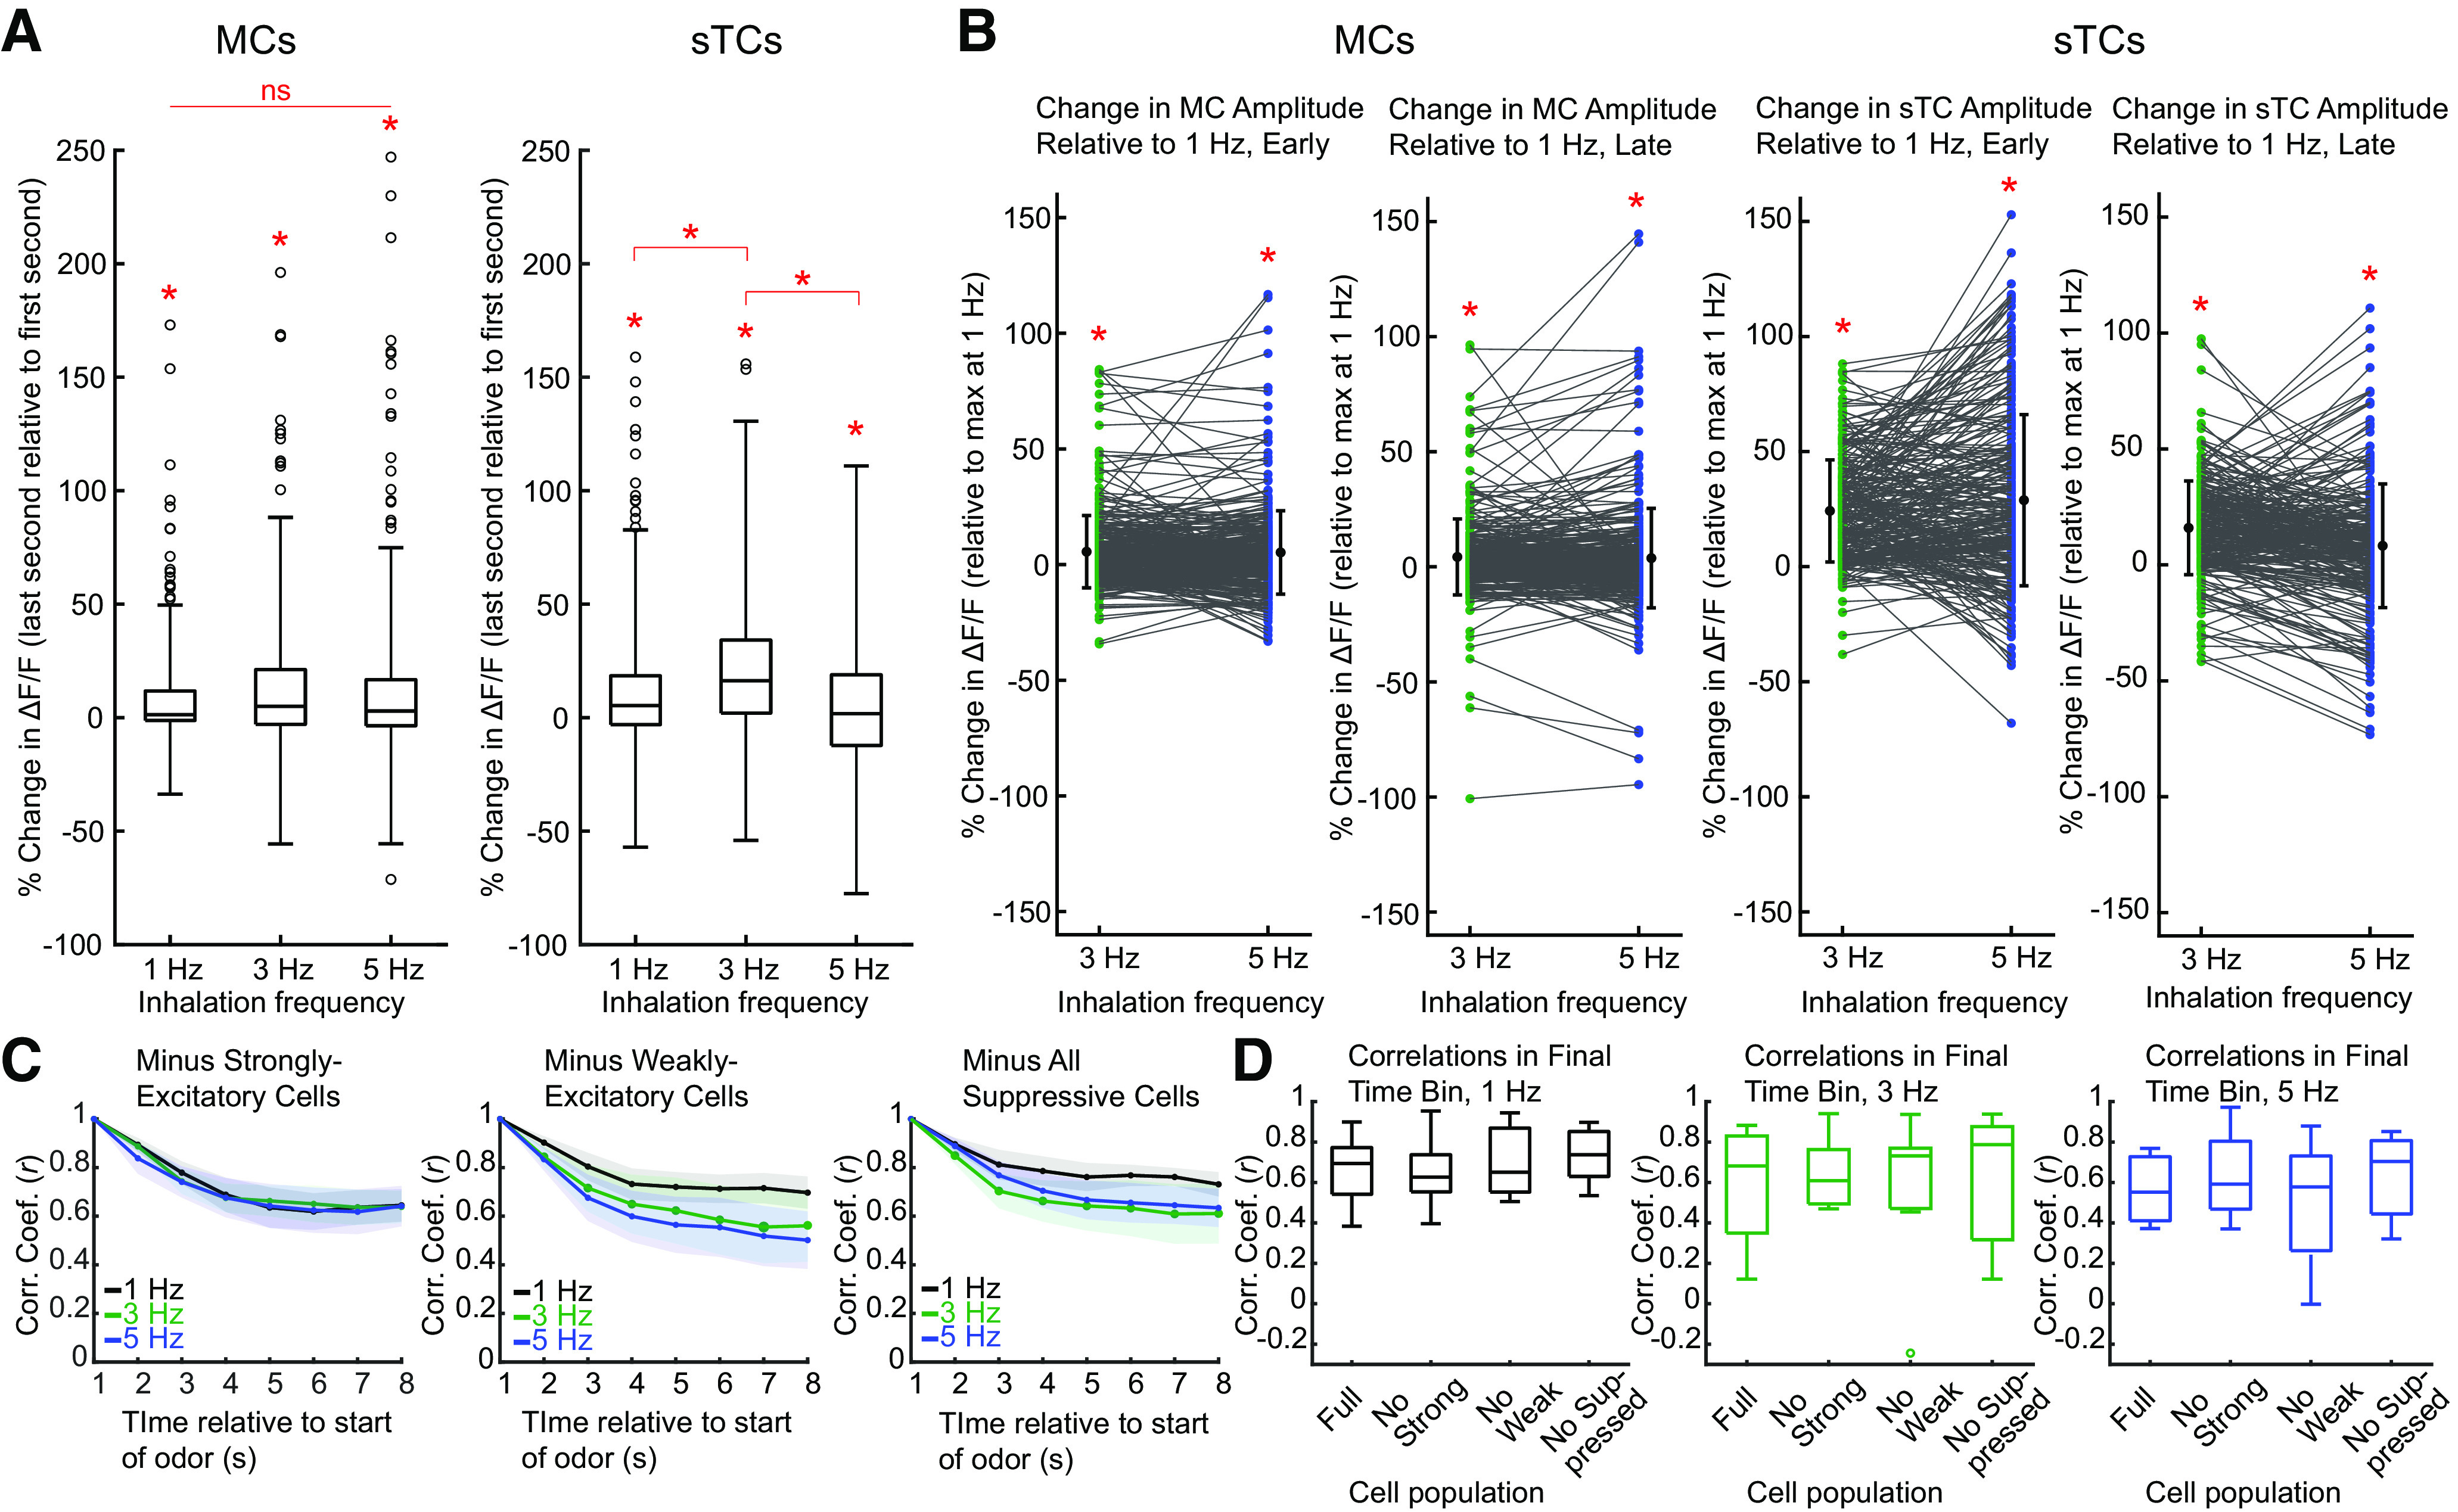
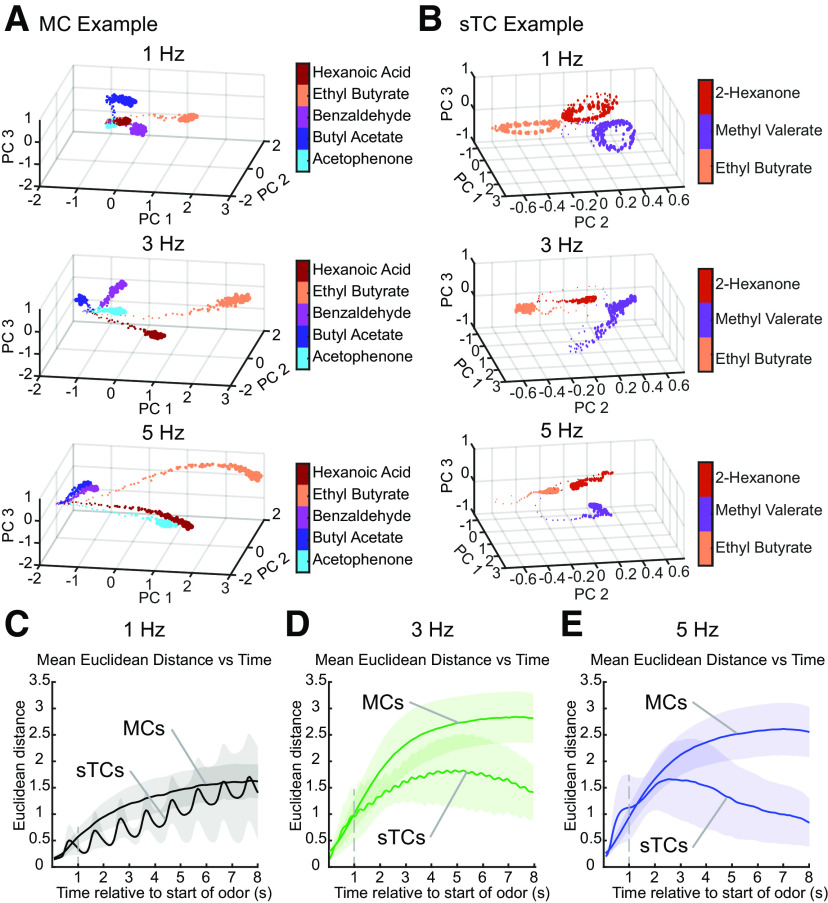
Sniffing, the active control of breathing beyond passive respiration, is used by mammals to modulate olfactory sampling. Sniffing allows animals to make odor-guided decisions within ∼200 ms, but animals routinely engage in bouts of high-frequency sniffing spanning several seconds; the impact of such repeated odorant sampling on odor representations remains unclear. We investigated this question in the mouse olfactory bulb (OB), where mitral and tufted cells (MTCs) form parallel output streams of odor information processing. To test the impact of repeated odorant sampling on MTC responses, we used two-photon imaging in anesthetized male and female mice to record activation of MTCs while precisely varying inhalation frequency. A combination of genetic targeting and viral expression of GCaMP6 reporters allowed us to access mitral cell (MC) and superficial tufted cell (sTC) subpopulations separately. We found that repeated odorant sampling differentially affected responses in MCs and sTCs, with MCs showing more diversity than sTCs over the same time period. Impacts of repeated sampling among MCs included both increases and decreases in excitation, as well as changes in response polarity. Response patterns across simultaneously-imaged MCs reformatted over time, with representations of different odorants becoming more distinct. Individual MCs responded differentially to changes in inhalation frequency, whereas sTC responses were more uniform over time and across frequency. Our results support the idea that MCs and TCs comprise functionally distinct pathways for odor information processing, and suggest that the reformatting of MC odor representations by high-frequency sniffing may serve to enhance the discrimination of similar odors.SIGNIFICANCE STATEMENT Repeated sampling of odorants during high-frequency respiration (sniffing) is a hallmark of active odorant sampling by mammals; however, the adaptive function of this behavior remains unclear. We found distinct effects of repeated sampling on odor representations carried by the two main output channels from the mouse olfactory bulb (OB), mitral and tufted cells (MTCs). Mitral cells (MCs) showed more diverse changes in response patterns over time as compared with tufted cells (TCs), leading to odorant representations that were more distinct after repeated sampling. These results support the idea that MTCs contribute different aspects to encoding odor information, and they indicate that MCs (but not TCs) may play a primary role in the modulation of olfactory processing by sampling behavior.

Keywords: coding; in vivo; mitral cell; odor; sniffing; two-photon imaging.


Figures

Figure 1.
Figure 1.
Imaging MTC population odor responses with artificial inhalation. A, Schematic of experimental paradigm. Odorants are delivered using an artificial inhalation paradigm, with inhalation frequencies of 1, 3, or 5 Hz. A sample inhalation trace (1 Hz) is pictured at the bottom. B, Representative images of resting fluorescence in three types of experiments, showing typical fields of view for sTC cell bodies, MC cell bodies, TC glomeruli, and MC-innervated glomeruli. C, Resting fluorescence image from one FOV, showing over 50 MC cell bodies. D, Odorant-evoked calcium signals, represented as ΔF/F, of the same FOV shown in C. E, left, Example traces (from ROIs indicated in C, D), showing evoked fluorescence for eight consecutive trials in which odorant is presented during 5 Hz inhalation for 8 s per trial. Right, Average responses of the three ROIs. For most analyses, average responses were used in calculations. All scale bars = 100 µm.
Figure 2.
Figure 2.
Odorant-evoked activity varies with inhalation frequency. A, Example trial-averaged responses from five MC cell bodies, showing diverse responses to ethyl butyrate (0.1%) at three different inhalation frequencies. B, Trial-averaged responses from five sTC cell bodies, showing a relative lack of diversity in temporal responses among cells within a given preparation. In all cells, fluorescence signals clearly follow 1 Hz inhalations (top rows for each cell), but this effect disappears at higher frequencies. Scale bars for the maps in A, B = 100 µm. C, Time-by-activity plots for all MC cell-odor pairs, rank-ordered by time-to-peak activity at 1 Hz. MC responses are diverse and prolonged, and activity patterns change substantially among cells at higher inhalation frequency. D, Cell-response histograms for six MC experiments, showing histograms of how many odorants each cell responded to, across all three inhalation frequencies. For most experiments, more cells responded to higher numbers of odorants at elevated inhalation frequencies (3 and 5 Hz). At 1 Hz (black bars), usually many more cells responded to fewer numbers of odorants. E, Time-by-activity plot for sTC cell bodies. Note that, compared with C, peak sTC activity tends to occur earlier than peak MC activity, and sTC responses generally turned off quickly after odor presentation compared with MC responses. In both C, E, odorant offset is at 8 s. F, Cell-response histograms for three sTC experiments, similar to D, again showing that more cells responded to greater number of odorants at higher inhalation frequencies.
Figure 3.
Figure 3.
MC population responses evolve with repeated odorant sampling more than sTC populations. A, Example MC-cell body experiment, showing responsive cells during 1 and 5 Hz inhalation at different time points. Time progresses horizontally in 2-s increments that represent the response maps during odorant presentation, averaged over 1 s. A number of MC cell bodies change their response strength or response polarity during 5 Hz inhalation, with fewer changing during 1 Hz inhalation. Black arrows highlight cells whose response changes substantially or switches polarity during odor presentation. B, Example sTC cell body experiment, displayed as in A, showing a relative lack of changes in responses among individual cells, regardless of inhalation frequency. C, Average MC population response to an odorant at a given time point correlated to the population response at the first time point over the length of odorant presentation. Correlations decreased faster at higher frequencies, although this difference was not statistically significant. Left, All MC-cell body data. Middle, Data from GCaMP6f experiments. Right, Data from GCaMP6s experiments. D, Plot of same analysis for sTC responses. Temporal decorrelation does not vary substantially across inhalation frequencies among sTCs. Decorrelation values differed between MCs and sTCs (see text for details). In both C, D, shaded areas represent SEM.
Figure 4.
Figure 4.
MC and TC responses show high variance in response to changing inhalation frequency. A, Change in signal amplitudes (ΔF/F) from the last second to the first second for all three inhalation frequencies across both cell types. In both MCs and sTCs, responses late in the odor presentation (final 1 s) are slightly greater than responses early in the odor presentation (first 1 s), but mean changes are small relative to variance across cells. Boxplots represent means and 25th to 75th percentiles, and whiskers extend for 3 SDs. Outliers are plotted as individual points outside of the whiskers. B, Change in strength of response magnitudes at 3 and 5 Hz compared with 1 Hz, for both MCs (left) and sTCs (right). For both cell types, the plot on the left reflects change within the first second of odorant presentation, and the plot on the left shows change within the last second of odorant presentation. Points in each plot are relative to maximum value at 1 Hz. For both MCs and sTCs, higher frequency inhalations lead to increased excitation (means in each plot are greater than zero). For MCs, early amplitudes change less than late amplitudes. The same holds for sTCs, although early amplitude changes are relatively much higher compared with MCs. Activity within the same cells are joined by lines. Beside the individual points, mean ± SEM is plotted for each case. C, Correlation-over-time (Fig. 3C) for MCs, when a subpopulation of cells (as indicated by the titles of the figure panels) has been removed. Removing any subpopulation of cells still produces a high level of decorrelation, suggesting that no single group of cells dominates that population reformatting; *p < 0.01 (see text for specific values). D, Correlation-to-early values of the final time bins taken from C, compared across all groups and inhalation-frequency conditions. No significant differences were found within any inhalation frequency.
Figure 5.
Figure 5.
Glomerular signals from apical dendrites of MCs and sTCs show similar diversity in responses and decorrelation patterns compared with MC and sTC cell cell bodies. A, FOV of one experimental preparation, showing how the same set of MC glomeruli respond to three different inhalation frequencies of the same odorant. Right, Example trial-averaged responses from five glomeruli. Glomeruli have variable responses at differing inhalation frequencies. Glomerulus 2, for example, shows a quick burst of activity at all three frequencies, but at 3 and 5 Hz, this initial burst is followed by a rapid decrease in activity below baseline, which is not seen at 1 Hz. Glomerulus 4 shows slight excitation at 1 Hz, and gradual suppression at 3 and 5 Hz. Scale bars = 100 µm. B, Time-by-activity plots for all MC glomeruli, rank-ordered by time-to-peak activity at 1 Hz. Similar to MC cell bodies, glomerular responses are diverse and prolonged. MC glomeruli include a high proportion of suppressive responses. C, Correlation of the average MC glomerular population response to an odorant at a given time point to the population response at the first time point, over the length of odorant presentation. Top, All MC glomerular data. Bottom left, Data from GCaMP6f experiments. Bottom right, Data from GCaMP6s experiments. MC glomerular responses decorrelate more strongly at 3 and 5 Hz compared with 1 Hz. The magnitude of decorrelation is lower than in MC-cell body data (compare to Fig. 3A). D, FOV of one TC experimental preparation, showing the same set of glomeruli responding to three different inhalation frequencies of the same odorant. Right, Example trial-averaged responses from five glomeruli. At low frequencies, fluorescence signals often follow inhalations, which is not seen at 5 Hz. Glomeruli also show variable responses at differing inhalation frequencies. Glomerulus 1, for example, shows inhalation-locked activity throughout 8-s odorant presentation, but at 3 and 5 Hz, it instead shows a relatively quick burst of activity followed by slow adaptation throughout the remaining 8 s, with a rapid drop-off when the odorant shuts off. Glomerulus 2 shows similar behavior to glomerulus 1 at 1 Hz, but its response to 3 and 5 Hz differs. At 3 Hz, it responds with high amplitude throughout the full 8-s presentation, but its response at 5 Hz instead shows a gradual adaptation. Scale bars = 100 µm. E, Time-by-activity plots for all TC glomeruli, rank-ordered by time-to-peak activity at 1 Hz. Signals follow individual inhalations at 1 and 3 Hz. In general, responses last for the duration of odorant presentation, although especially at 5 Hz, some cells can be seen to excite rapidly and adapt within the first 500 ms of odorant presentation. F, Correlation of the average TC glomerular population response to an odorant at a given time point to the population response at the first time point, over the length of odorant presentation. The pattern and strength of decorrelation is very similar to that for sTC cell bodies (Fig. 3D).
Figure 6.
Figure 6.
Odor representations become more distinct over time at high inhalation frequencies in MCs but not in sTCs. A, Example MC experiment, showing a rapid increase in distances at the beginning of odorant presentation (especially at 3 and 5 Hz), followed by a slow rise/plateauing of Euclidean distance for the bulk of the odorant presentation. B, Example sTC experiment, showing that one of the dominant longer-term signals is that sTC responses closely follow inhalation, at least at low frequencies. Odorant trajectories do not spread out as much at high frequencies as compared with the MC case, and a major feature is the oscillatory nature of the PCA, reflecting the inhalation-linked responses of sTCs. In A and B, point size increases from early to late in the 8 s odorant presentation window. C, Summed Euclidean distances across MC and sTC preparations at1 Hz inhalation frequency, showing that the distances parallel each other in both cell types. D, Euclidean distance at 3 Hz exhibits different trends between MCs and TCs, diverging midway through the 8 s odor presentation. E, At 5 Hz inhalation, distances diverge between MCs and sTCs after roughly 3 s of odorant presentation. In C–E, shaded areas represent SEM A gray dashed line has been added in each plot that corresponds to the time point at which decorrelation analyses in previous figures/text results begins.

References

    1. Abraham NM, Spors H, Carleton A, Margrie TW, Kuner T, Schaefer AT (2004) Maintaining accuracy at the expense of speed: stimulus similarity defines odor discrimination time in mice. Neuron 44:865–876. 10.1016/j.neuron.2004.11.017 - DOI - PubMed
    1. Baltanás FC, Curto GG, Gómez C, Díaz D, Murias AR, Crespo C, Erdelyi F, Szabó G, Alonso JR, Weruaga E (2011) Types of cholecystokinin-containing periglomerular cells in the mouse olfactory bulb. J Neurosci Res 89:35–43. 10.1002/jnr.22521 - DOI - PubMed
    1. Bathellier B, Buhl DL, Accolla R, Carleton A (2008) Dynamic ensemble odor coding in the mammalian olfactory bulb: sensory information at different timescales. Neuron 57:586–598. 10.1016/j.neuron.2008.02.011 - DOI - PubMed
    1. Carey RM, Wachowiak M (2011) Effect of sniffing on the temporal structure of mitral/tufted cell output from the olfactory bulb. J Neurosci 31:10615–10626. 10.1523/JNEUROSCI.1805-11.2011 - DOI - PMC - PubMed
    1. Christie J, Schoppa N, Westbrook G (2001) Tufted cell dendrodendritic inhibition in the olfactory bulb is dependent on NMDA receptor activity. J Neurophysiol 85:169–173. 10.1152/jn.2001.85.1.169 - DOI - PubMed

Publication types

LinkOut - more resources