. 2020 Aug 5;40(32):6103-6111.
doi: 10.1523/JNEUROSCI.0912-20.2020. Epub 2020 Jun 29.

N-Wasp Regulates Oligodendrocyte Myelination

Affiliations

N-Wasp Regulates Oligodendrocyte Myelination

Christina Katanov et al. J Neurosci. .

Erratum in

Abstract

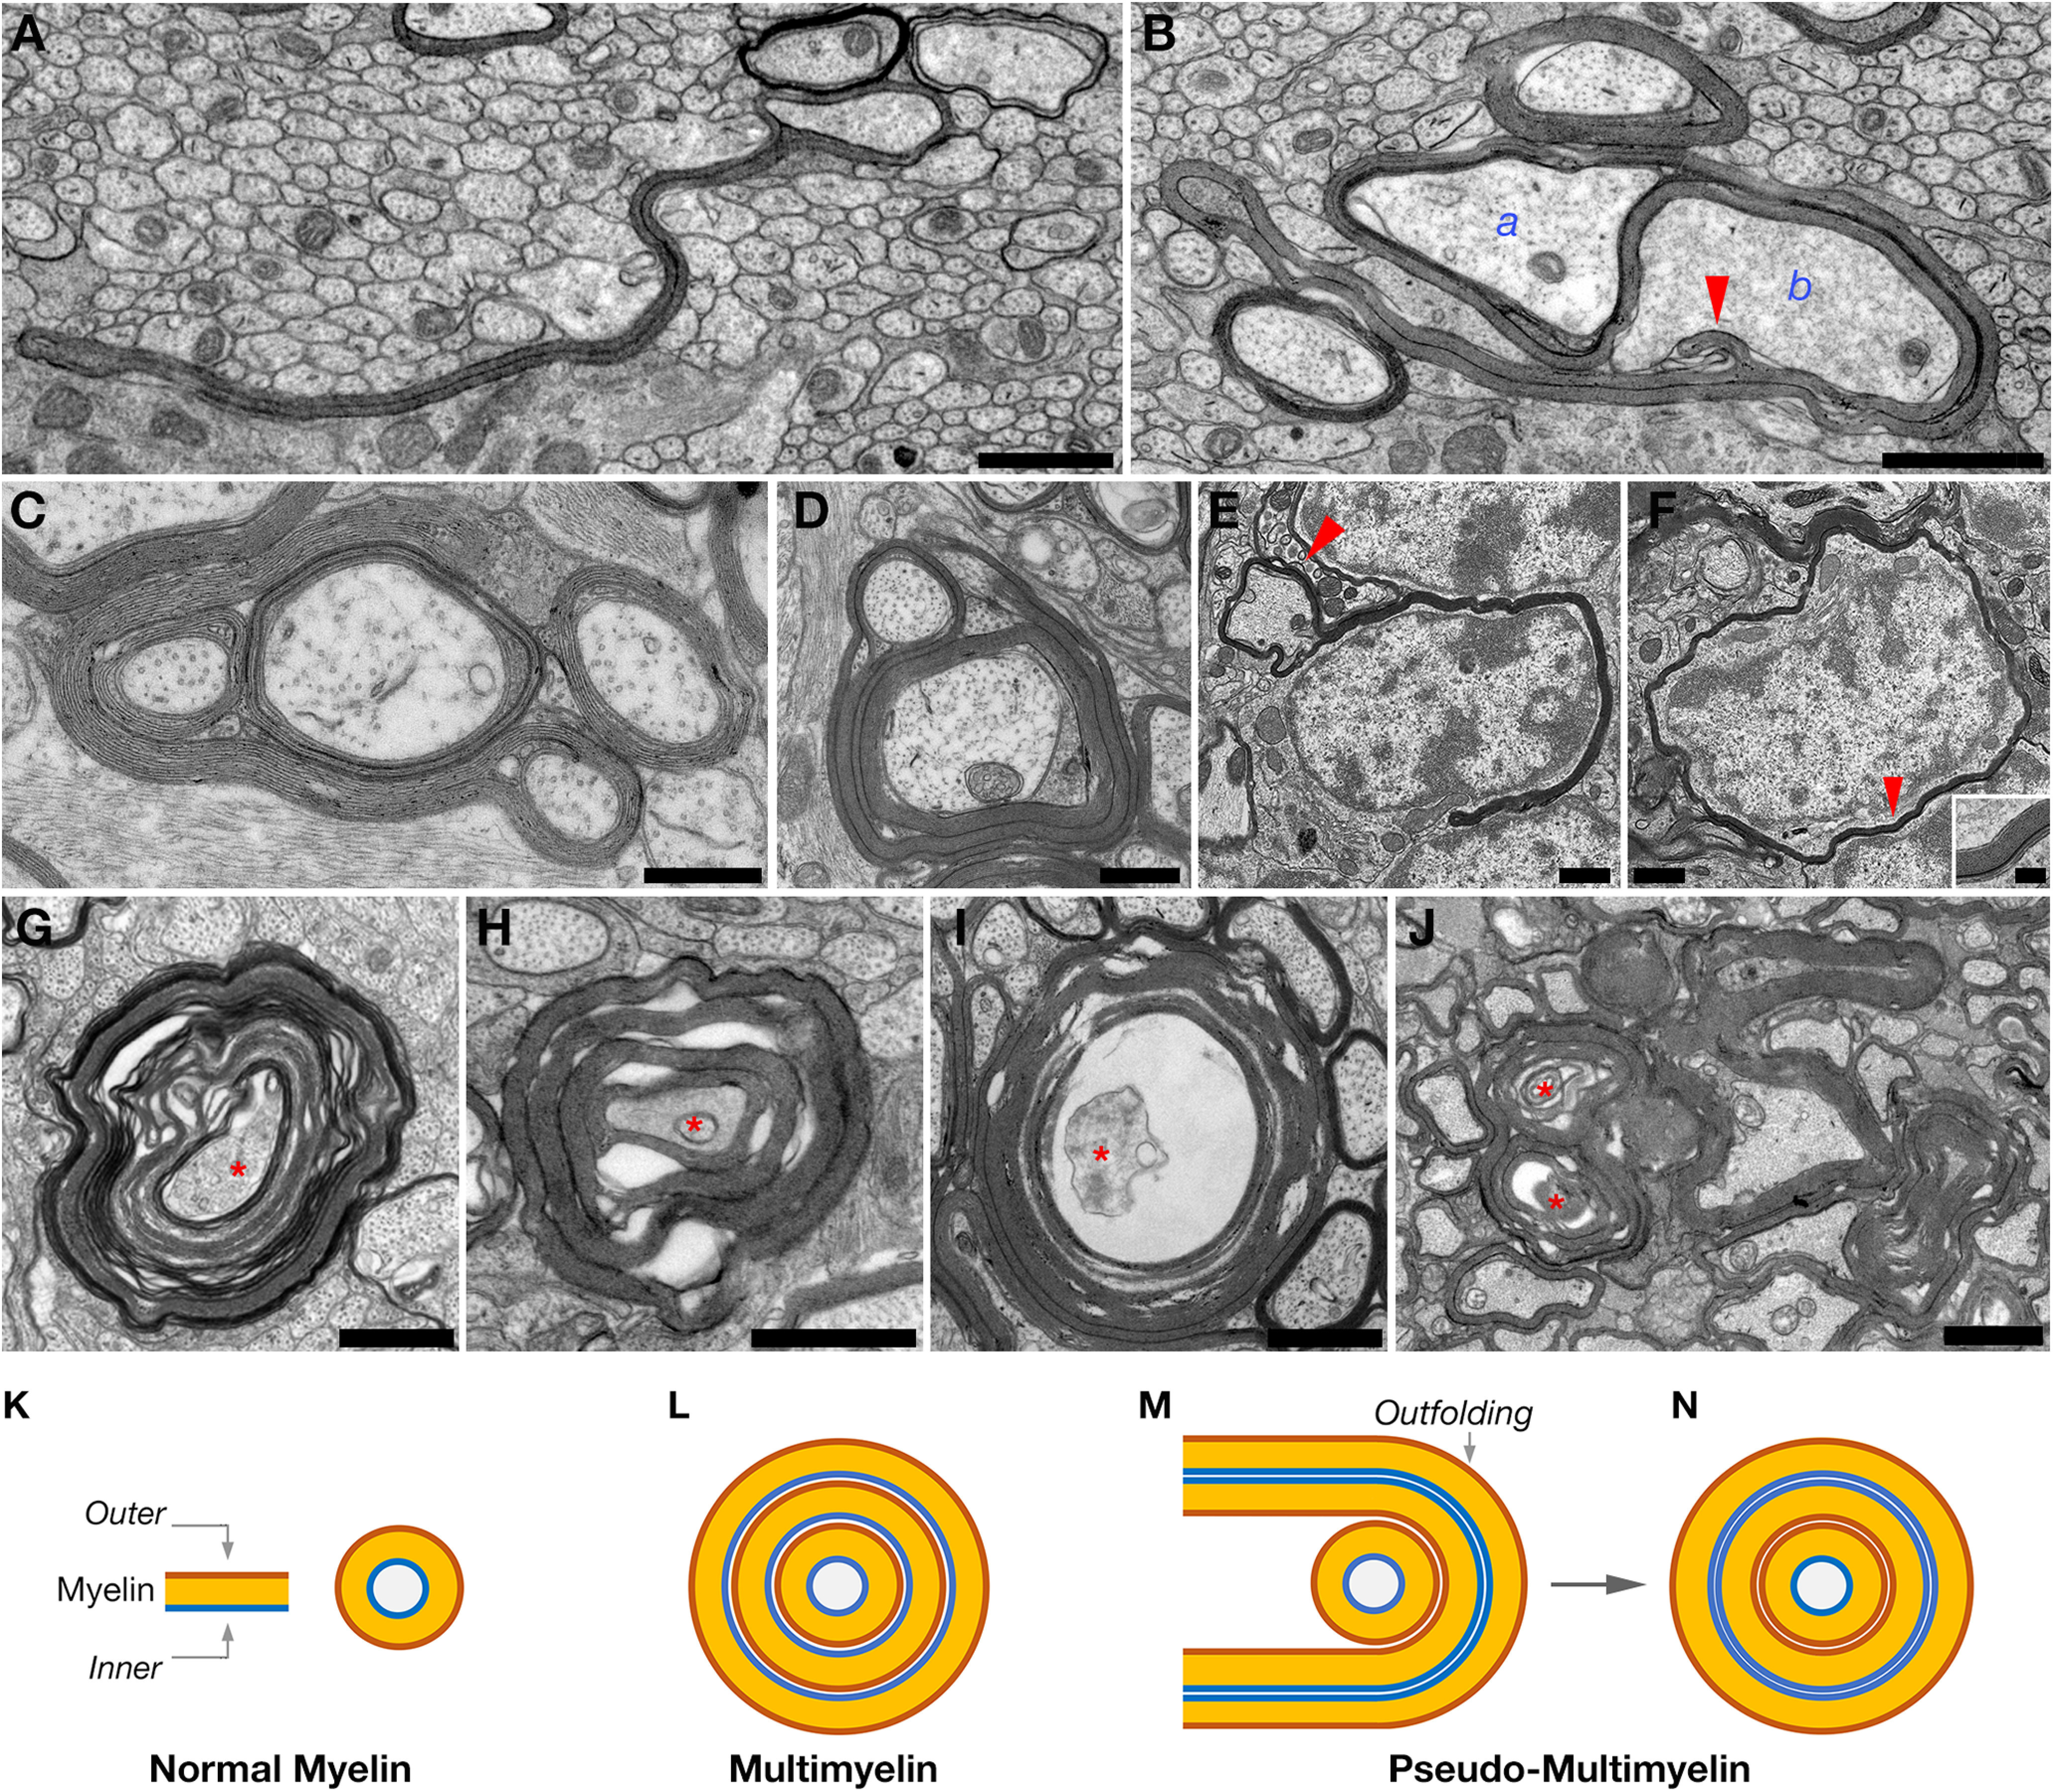
Oligodendrocyte myelination depends on actin cytoskeleton rearrangement. Neural Wiskott-Aldrich syndrome protein(N-Wasp) is an actin nucleation factor that promotes polymerization of branched actin filaments. N-Wasp activity is essential for myelin membrane wrapping by Schwann cells, but its role in oligodendrocytes and CNS myelination remains unknown. Here we report that oligodendrocytes-specific deletion of N-Wasp in mice of both sexes resulted in hypomyelination (i.e., reduced number of myelinated axons and thinner myelin profiles), as well as substantial focal hypermyelination reflected by the formation of remarkably long myelin outfolds. These myelin outfolds surrounded unmyelinated axons, neuronal cell bodies, and other myelin profiles. The latter configuration resulted in pseudo-multimyelin profiles that were often associated with axonal detachment and degeneration throughout the CNS, including in the optic nerve, corpus callosum, and the spinal cord. Furthermore, developmental analysis revealed that myelin abnormalities were already observed during the onset of myelination, suggesting that they are formed by aberrant and misguided elongation of the oligodendrocyte inner lip membrane. Our results demonstrate that N-Wasp is required for the formation of normal myelin in the CNS. They also reveal that N-Wasp plays a distinct role in oligodendrocytes compared with Schwann cells, highlighting a difference in the regulation of actin dynamics during CNS and PNS myelination.SIGNIFICANCE STATEMENT Myelin is critical for the normal function of the nervous system by facilitating fast conduction of action potentials. During the process of myelination in the CNS, oligodendrocytes undergo extensive morphological changes that involve cellular process extension and retraction, axonal ensheathment, and myelin membrane wrapping. Here we present evidence that N-Wasp, a protein regulating actin filament assembly through Arp2/3 complex-dependent actin nucleation, plays a critical role in CNS myelination, and its absence leads to several myelin abnormalities. Our data provide an important step into the understanding of the molecular mechanisms underlying CNS myelination.

Keywords: Schwann cell; actin dynamics; axon-glia; myelin; oligodendrocyte.


Figures

Figure 1.
Figure 1.
Absence of N-Wasp in oligodendrocytes results in hypomyelination. A, RT-PCR analysis of mRNA isolated from optic nerves at 2 months from Cnp-Cre/N-Waspflx/flx mutant and from N-Waspflx/flx (WT) mice. Amplification of N-Wasp and actin was performed using the relevant primers, and products of expected sizes were obtained. B, WB analysis of optic nerves isolated at 2 months from Cnp-Cre/N-Waspflx/flx mutant and from N-Waspflx/flx (WT) mice using antibodies to N-Wasp and β-tubulin. C, Rotarod test performed with 3-month-old Cnp-Cre/N-Waspflx/flx mutant and from N-Waspflx/flx (WT) mice. The mutant mice had a shorter latency to fall than their littermate control. Error bars indicate SD of n > 5 mice for each genotype (*p < 0.05). D–I, Sagittal sections of brains from 2-month-old N-Waspflx/flx (WT; D,F,H) and Cnp-Cre/N-Waspflx/flx (E,G,I) mice stained with LFB and crysel violet (D,E), or immunolabeled using antibodies to MBP (F–I). Hypomyelination is detected in the mutant corpus callosum and the fimbria (D–G, arrowheads). D, E, Insets, High-magnification image of the framed area in the corpus callosum. H, I, High-magnification images of the framed regions in F and G showing a decrease in MBP immunoreactivity in the absence of N-Wasp (arrowheads). J, Cnp-Cre/N-Waspflx/flx mice lack myelin profiles in the PNS. EM images of sciatic nerve cross sections from 2-month-old N-Waspflx/flx (WT) and Cnp-Cre/N-Waspflx/flx mutant mice. In mutant nerves, most Schwann cells were arrested at the promyelinating stage, similarly to our DHH-Cre/N-Waspflx/flx mutant nerves (Novak et al., 2011). Scale bars: D–G, 500 µm; Inset, 100 µm; H, I, 50 µm; J, 5 µm.
Figure 2.
Figure 2.
N-Wasp is required for myelination in the optic nerve. A, B, EM images of optic nerve cross sections obtained from 1-month-old WT and Cnp-Cre/N-Waspflx/flx mutant mice. C, Percentage of myelinated axons per mm2 (3-5 random FOVs) was significantly lower in the mutant (KO) than in WT optic nerves at 1 month (***p < 0.001). Data are mean ± SEM. D, E, g-ratio analysis of myelinated axons in 1-month-old optic nerves is presented as a function of axon diameter (D), or as an average value (E). Cnp-Cre/N-Waspflx/flx mutant mice (KO) exhibit significantly higher g-ratio than N-Waspflx/flx (WT) mice (∼200 axons from 3 animals per genotype, ***p < 0.001). Error bars indicate mean ± SEM. F, Percentage of abnormal profiles detected in optic nerves isolated from 1-month-old N-Waspflx/flx (WT) and Cnp-Cre/N-Waspflx/flx mice (KO) (3-5 random FOVs, **p < 0.01). Error bars indicate mean ± SEM. n = 3 mice per genotype. G–J, EM images of optic nerve cross sections from 4-month-old WT and Cnp-Cre/N-Waspflx/flx mutant mice. High-magnification images of optic nerves reveal a thinner myelin in Cnp-Cre/N-Waspflx/flx mutant (I) than N-Waspflx/flx mice (WT; G). K–N, Quantification showing the percentage of myelinated axons (K), g-ratio analysis as a function of axon diameter (L), or as an average value (M), as well as the percentage of abnormal profiles detected (N), as described above for 1-month-old mice (C–F). Scale bars: A, B, 2 µm; G, I, 0.1 µm; H, J, 2 µm.
Figure 3.
Figure 3.
Cnp-Cre/N-Waspflx/flx mice exhibit severe myelin abnormalities. A, B, EM images of Cnp-Cre/N-Waspflx/flx corpus callosum at P15. The long extending myelin outfolds originated from one axon (labeled a in B) surrounds a nonmyelinated axon (b), and extends an additional outfold (arrowhead) that contact this axon. C, D, High-magnification EM images of optic nerve cross sections obtained from 1-month-old Cnp-Cre/N-Waspflx/flx mutant mice, showing long myelin outfoldings. Myelin outfolds cover other myelinated axons. E, F, Presence of oligodendrocyte myelin around neuronal cell bodies. EM images of the cerebellum of 4-month-old Cnp-Cre/N-Waspflx/flx mutant mice. The presence of myelin outfolds that either partially (E) or completely (F) surrounding neuronal cell bodies. E, Arrow indicates the presence of a nearby myelinated axon. High magnification of area indicated by arrowhead in F showing multiple myelin layers around the cell body. G-I, High-magnification EM images of optic nerve cross sections obtained from P10 (G), P15 (H), and P30 (I) Cnp-Cre/N-Waspflx/flx mutant mice showing different configurations of multimyelinated axons undergoing degeneration and axon (red asterisk) detachment. J, EM image of optic nerve cross sections obtained from 4-month-old Cnp-Cre/N-Waspflx/flx mutant mice showing multiple profiles of focal hypermyelination and degeneration (red asterisk). K–N, Schematic model showing normal myelin (K), multimyelin configuration resulting from aberrant adhesion (L), and pseudo-multimyelin configuration formed by wrapping of a myelin outfolding around myelinated axon (M,N). K, The myelin sheath (Myelin) and the location of the most inner and outer myelin membranes. Scale bars: A, B, D–I, 1 µm; C, 0.5 µm; J, 2 µm.
Figure 4.
Figure 4.
Myelin abnormalities in the absence of N-Wasp occur at early developmental stage. A, B, EM images of optic nerve cross sections from N-Waspflx/flx (WT; left panels) and Cnp-Cre/N-Waspflx/flx mutant mice (middle and right panels) at p10 (A) and p15 (B). C, E, Percentage of myelinated axons per mm2 at P10 (C) and P15 (E). Percentage of myelinated axons was significantly lower in the mutant (KO) than in WT optic nerves at P15 (E, **p < 0.01). Data are mean ± SEM. Three to five random FOVs were used from 3 mice per genotype at different ages. D, F, Percentage of abnormal profiles detected in N-Waspflx/flx (WT) and Cnp-Cre/N-Waspflx/flx mutant (KO) mice at P10 (D) and P15 (F). Error bars indicate mean ± SEM. **p < 0.01. Three to five random FOVs were used from 3 mice per genotype at different ages. Scale bars: A, B, 2 µm.
Figure 5.
Figure 5.
Cnp-Cre/N-Waspflx/flx mice display myelin impairments and axonal degeneration in different CNS tissues. A, C, EM images of corpus callosum (A) and spinal cord (C) from N-Waspflx/flx (WT) and Cnp-Cre/N-Waspflx/flx mutant mice (KO). Red arrowheads indicate abnormal myelin outfoldings. Red asterisks indicate degenerated profiles at different stages. B, D, Graphs representing percentage of abnormal myelin profiles in both genotypes. Three to five random FOVs were used from 3 mice for each genotype. **p < 0.01. Error bars indicate mean ± SEM. E, F, EM images of spinal cord cross sections from 4-month-old (E) and 1-month-old (F) Cnp-Cre/N-Waspflx/flx mutant mice (KO). Red asterisks indicate degenerated profiles at different stages. E, Arrowheads indicate detachment of the axon from the myelin sheath. G, Quantification of degenerated profiles (myelin sheaths and axons) detected in N-Waspflx/flx (WT) and Cnp-Cre/N-Waspflx/flx mutant mice (KO). Results shown as percentage of degenerated profiles of all myelinated axons at different ages. Three to five random FOVs were used from 3 mice for each genotype. ***p < 0.0001. **p < 0.01. *p < 0.05. Error bars indicate mean ± SEM. Scale bars: A, C, F, 2 µm; E, 10 µm.

Similar articles

Cited by

References

    1. Alekhina O, Burstein E, Billadeau DD (2017) Cellular functions of WASP family proteins at a glance. J Cell Sci 130:2235–2241. 10.1242/jcs.199570 - DOI - PMC - PubMed
    1. Almeida RG, Lyons DA (2014) On the resemblance of synapse formation and CNS myelination. Neuroscience 276:98–108. 10.1016/j.neuroscience.2013.08.062 - DOI - PubMed
    1. Amor V, Zhang C, Vainshtein A, Zhang A, Zollinger DR, Eshed-Eisenbach Y, Brophy PJ, Rasband MN, Peles E (2017) The paranodal cytoskeleton clusters Na(+) channels at nodes of Ranvier. Elife 6:e21392 10.7554/eLife.21392 - DOI - PMC - PubMed
    1. Azevedo MM, Domingues HS, Cordelieres FP, Sampaio P, Seixas AI, Relvas JB (2018) Jmy regulates oligodendrocyte differentiation via modulation of actin cytoskeleton dynamics. Glia 66:1826–1844. 10.1002/glia.23342 - DOI - PubMed
    1. Bacon C, Lakics V, Machesky L, Rumsby M (2007) N-WASP regulates extension of filopodia and processes by oligodendrocyte progenitors, oligodendrocytes, and Schwann cells: implications for axon ensheathment at myelination. Glia 55:844–858. 10.1002/glia.20505 - DOI - PubMed

Publication types

Substances

LinkOut - more resources