. 2020 Jun 29;11(1):3273.
doi: 10.1038/s41467-020-16923-0.

Iron imaging in myocardial infarction reperfusion injury

Affiliations

Iron imaging in myocardial infarction reperfusion injury

Brianna F Moon et al. Nat Commun. .

Abstract

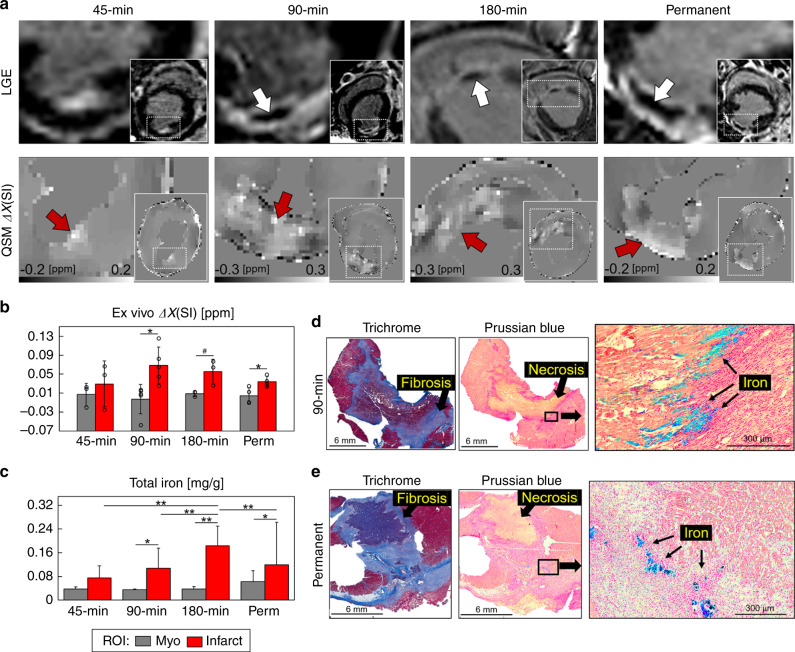
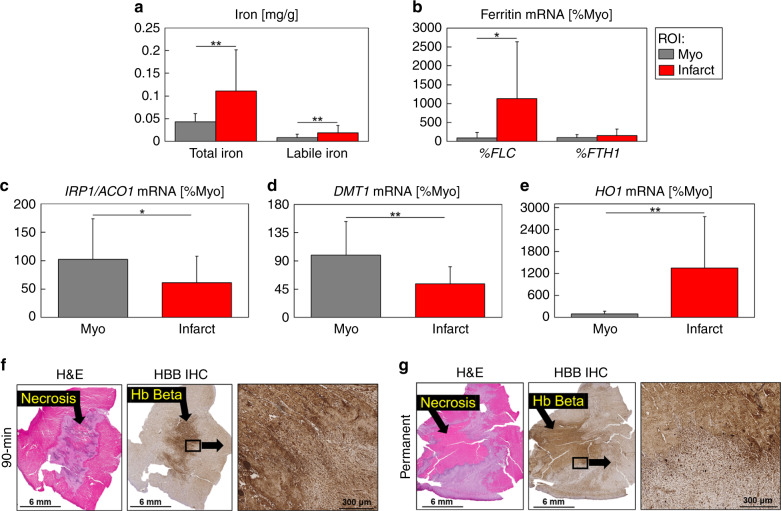
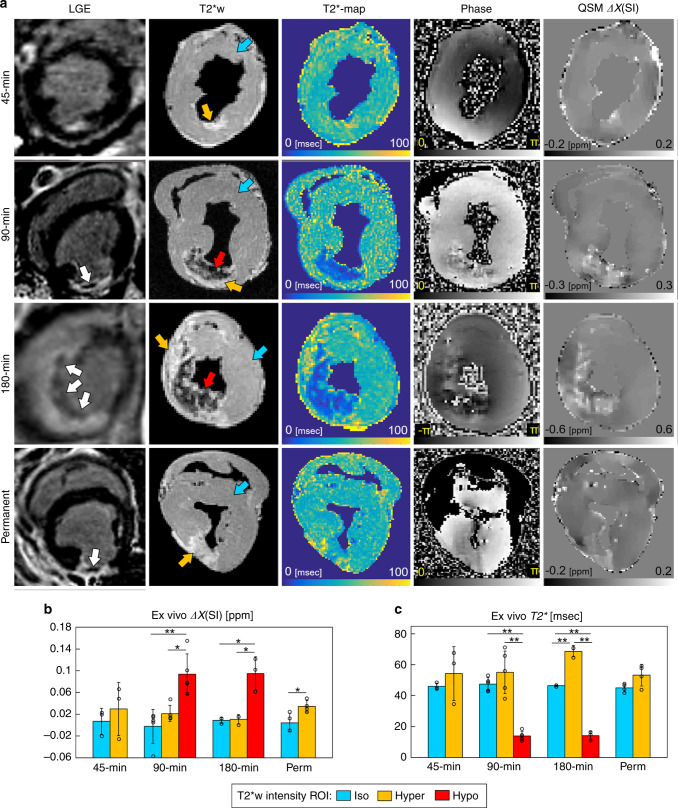
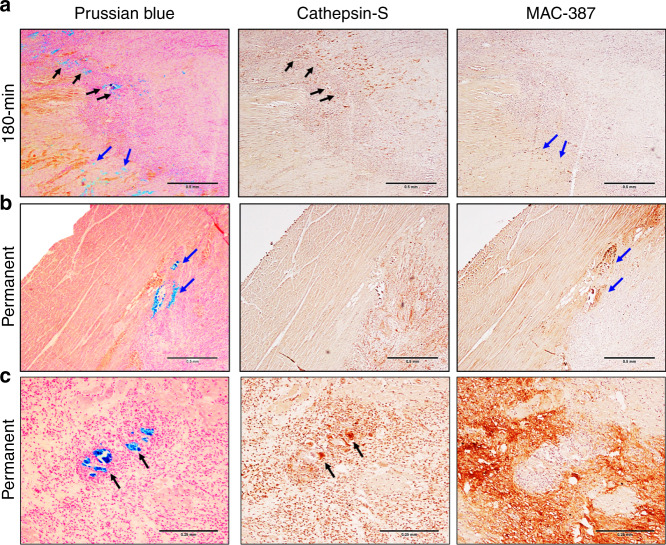
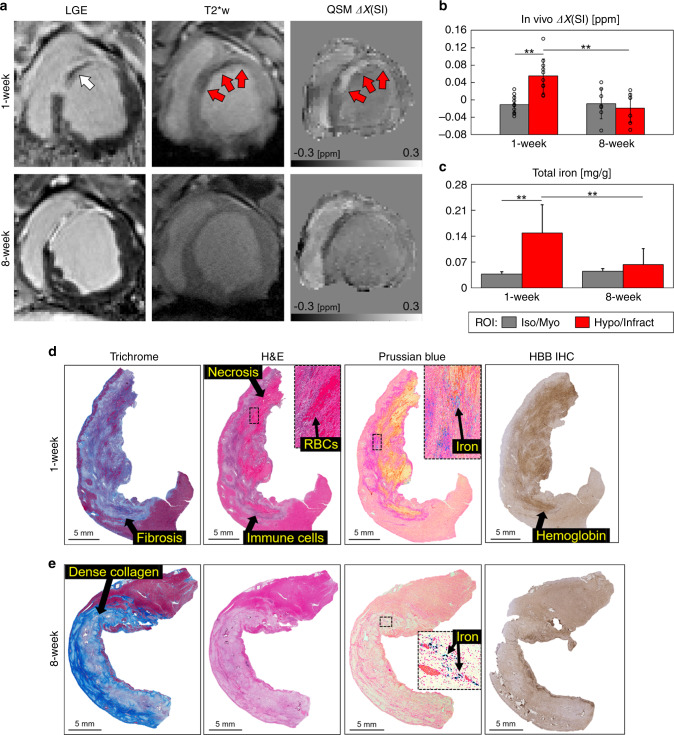
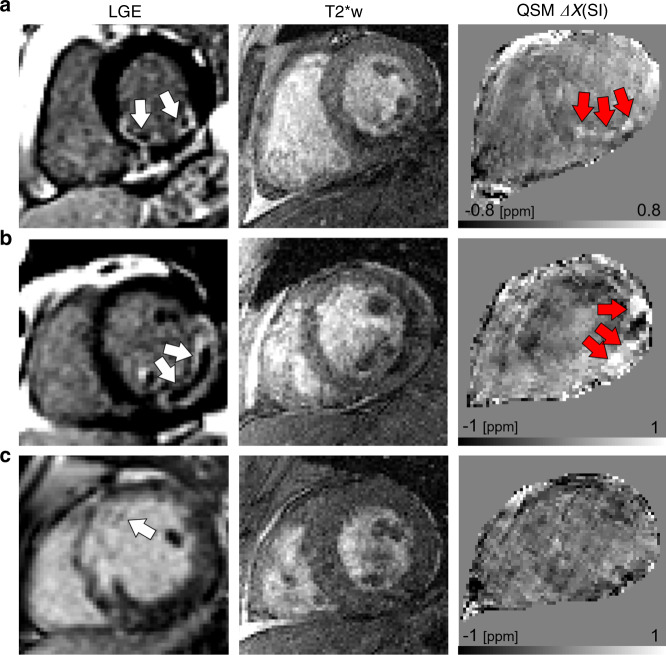
Restoration of coronary blood flow after a heart attack can cause reperfusion injury potentially leading to impaired cardiac function, adverse tissue remodeling and heart failure. Iron is an essential biometal that may have a pathologic role in this process. There is a clinical need for a precise noninvasive method to detect iron for risk stratification of patients and therapy evaluation. Here, we report that magnetic susceptibility imaging in a large animal model shows an infarct paramagnetic shift associated with duration of coronary artery occlusion and the presence of iron. Iron validation techniques used include histology, immunohistochemistry, spectrometry and spectroscopy. Further mRNA analysis shows upregulation of ferritin and heme oxygenase. While conventional imaging corroborates the findings of iron deposition, magnetic susceptibility imaging has improved sensitivity to iron and mitigates confounding factors such as edema and fibrosis. Myocardial infarction patients receiving reperfusion therapy show magnetic susceptibility changes associated with hypokinetic myocardial wall motion and microvascular obstruction, demonstrating potential for clinical translation.


Conflict of interest statement

The authors declare no competing interests.

Figures

Fig. 1
Fig. 1. Infarct magnetic susceptibility is associated with elevated tissue iron content.
At 1 week post-infarction (a), late gadolinium enhanced (LGE) MRI shows hyperintense signal in the infarct region corresponding to uptake of gadolinium contrast agent. In total, 90, 180 min, and permanent infarcts were larger with microvascular obstruction, as indicated by hypointense regions in the infarct core (white arrows). Images show views of the infarct region and left ventricular short axis (insets). Infarcts show a paramagnetic shift in ex vivo quantitative susceptibility maps (QSM) for each infarct group compared with remote (myo) regions. b There was a significant infarct paramagnetic shift in 90 min (P = 0.012) and permanent (P = 0.025) infarct groups. Magnetic susceptibility measurements in 45 min (n = 3), 90 min (n = 5), 180 min (n = 3), and permanent (n = 4) infarct groups were from independent whole heart ex vivo specimens, regions of interest (ROI) were compared using a two-tailed two-sample t test for each infarct group. c Infarct total iron concentration was significantly elevated in 90 min (P = 0.001), 180 min (P < 0.0001), and permanent (P = 0.015) infarcts compared with remote myocardium. In total, 45 min (n = 31, 24), 90 min (n = 32, 32), 180 min (n = 48, 37), and permanent (n = 30, 50) measurements were from independent tissue samples (myo, infarct), tissue regions and infarct groups were compared using two-way analysis of variance (ANOVA) with Tukey’s HSD post-hoc test. d Representative histological findings in a 90 min reperfused infarct. Trichrome stain shows a nontransmural infarct, fibrosis, and nonviable myocytes at the core of the infarct. Prussian blue staining shows iron accumulation (black arrows) at the transition zone between necrotic myocytes and mixed viable myocytes suggesting an active immune response originating outside the infarct core. e Representative histological findings in a permanent occlusion infarct. Trichrome stain shows fibrosis and transmural infarct. Prussian blue shows iron deposits at the peripheral infarct fibrotic regions. Representative histology from each infarct group and remote myocardium are shown in Supplementary Fig. 6. Histology was repeated independently on multiple tissue sections (n > 5) for each whole heart specimen (n = 15) showing similar histopathological findings for each infarct group. The results are reported as mean ± SD. #P = 0.094 and significance *P < 0.05 and **P < 0.001. Source data for b and c are provided as a Source data file.
Fig. 2
Fig. 2. Ex vivo iron content and expression of cellular markers of iron homeostasis.
a Infarcts had significantly increased total iron (P = 7e−22) and labile iron (P = 3e−4) concentration compared with remote (myo) regions. Myo (n = 188) and infarct (n = 216) total iron ICP-OES and myo (n = 25) and infarct (n = 43) labile iron EPR measurements were from independent tissue samples. b Ferritin light chain (FLC) expression was significantly increased in infarct regions (P = 0.002) and ferritin heavy chain (FTH1) expression was not significantly modified (P = 0.15). c The expression of the intracellular iron sensor iron regulatory protein 2 (IRP1, also known as ACO1) (P = 0.035), and d divalent metal transporter 1 (DMT1), which transports iron into the labile iron pool (= 0.002), were significantly decreased in infarct regions. e Heme oxygenase-1 (HO1) expression was significantly increased in infarct regions (P = 2e−4). Total mRNA was isolated from myo (n = 20) and infarct (n = 24) independent frozen tissue samples and real-time PCR for quantification of mRNA was performed by using an SYBR-Green protocol. The results are expressed as fold changes in expression when compared with the average of remote samples from all time points using the cycle threshold 2(ΔΔCT) method with GAPDH and HPRT as reference genes. Total and labile iron, FLC, FTH1, IRP1, DMT1, and HO1 measurements were compared between myo and infarct regions using a two-tailed two-sample t test. f Representative 90 min reperfused infarct at 1 week post-infarction shows a lack of cell viability (H&E) and positive hemoglobin (Hb) beta staining (HBB IHC). g Representative permanently occluded infarct at 1 week post-infarction shows similar dark Hb β staining, with less concentrated areas of positive staining. The darker staining may reflect extracellular or uptake of Hb β from past hemorrhage. Representative histology from each infarct group and remote myocardium are shown in Supplementary Figs. 6 and 7. Histology was repeated independently on multiple tissue sections (n > 5) for all reperfused and permanent infarcts which showed similar histopathological findings within each infarct group. The results are reported as mean ± SD. Significance is indicated by *P < 0.05 and **P < 0.001, region of interest (ROI). Analysis is across all reperfusion groups. Source data for ae are provided as a Source data file.
Fig. 3
Fig. 3. Comparison of conventional MRI with magnetic susceptibility imaging.
a In vivo late gadolinium enhanced (LGE), and ex vivo T2*-weighted (T2*w), T2* maps, gradient-echo phase images, and quantitative susceptibility maps (QSM) obtained 1 week after 45, 90, 180 min, and permanent coronary occlusion. In distinction to the 45 min infarct group, 90, 180 min, and permanent infarcts showed a hypointense signal on LGE MRI corresponding to delayed uptake of the contrast agent (white arrows). T2*w and T2* maps show hypointense regions after 90 and 180 min of coronary occlusion, but not after 45 min and permanent coronary occlusion. This suggests elevated iron content in reperfused infarcts with longer coronary occlusion time. Gradient-echo phase images show local signal dephasing in the infarcted myocardium in all infarct groups and corresponds to elevated susceptibility seen in QSM. b Magnetic susceptibility from iso, hyper, and hypo regions of interest (ROI) on T2*w images. In total, 90 min reperfused infarcts showed substantially elevated magnetic susceptibility in hypo compared with hyper (P = 0.006) and iso (P = 7e−4) regions. In total, 180 min infarcts were elevated in hypo compared with hyper (P = 0.003) and iso (P = 0.003) regions, and permanent infarcts were elevated in hyper compared with iso (P = 0.025) regions. c T2* relaxation times from iso, hyper, and hypo ROI on T2*w images. Together, (b) and (c), show elevated magnetic susceptibility in all infarct groups despite increased T2* relaxation times in 45 min and permanent infarcts. This suggests that low levels of iron may be undetectable by T2* when edema and fibrosis changes are present. Magnetic susceptibility and T2* measurements in 45 min (n = 3), 90 min (n = 5), 180 min (n = 3), and permanent (n = 4) infarct groups were from independent whole heart ex vivo specimens. ROIs were compared for each infarct group using one-way ANOVA with Tukey’s HSD post-hoc test. The results are reported as mean ± SD. Significance is indicated by *P < 0.05 and **P < 0.001. T2*w and phase images are at echo time (TE) 16.1 ms. Source data for b and c are provided as a Source data file.
Fig. 4
Fig. 4. Immune response and iron deposition in reperfused and permanent infarcts.
a Representative 180 min reperfused infarct at 1 week post-infarction shows regions of iron accumulation at the transition zone between myocyte necrosis and mixed viable myocytes (Prussian blue, black, and blue arrows) colocalized with MHC class II antigen-presenting cells (Cathepsin-S, black arrows) and newly recruited macrophages (MAC-387, blue arrows). b, c Representative permanently occluded infarct at 1 week post-infarction also had heterogeneous macrophage aggregation with newly recruited macrophages (MAC-387, blue arrows) and MHC class II antigen-presenting cells (Cathepsin-S, black arrows) colocalized with iron accumulation (Prussian blue, black, and blue arrows). Histology was repeated in independent tissue sections for 90 (n = 2), 180 min (n = 2) reperfused, and permanent (n = 2) infarcts which showed similar histopathological findings within reperfused and permanent infarct groups. a and b are at ×40 magnification and c is at ×100 magnification.
Fig. 5
Fig. 5. Magnetic susceptibility and iron evolve from 1 to 8 weeks post-infarction.
a In vivo late gadolinium enhanced (LGE), T2*-weighted (T2*w), T2* maps, and quantitative susceptibility maps (QSM) from a reperfused 90 min animal imaged serially. In vivo LGE, reperfused infarcts at 1 week post-infarction had microvascular obstruction (MVO) indicated by hypointense regions (white arrows), MVO is no longer present at 8 weeks post-infarction. QSM shows an infarct paramagnetic shift (red arrows) compared with viable myocardium (myo). b At 1 week, reperfused infarcts had a significant paramagnetic shift (P = 2e−4) associated with (c) a significant elevation in infarct iron concentration (P < 0.0001). From 1 to 8 weeks post-infarction there was a significant decrease in infarct magnetic susceptibility (P = 1e−4) and iron concentration (P < 0.0001). Magnetic susceptibility was measured in vivo at 1 week (n = 11) and 8 weeks (n = 8) post-infarction from independent animals. Total iron ICP-OES measurements at 1 week (n = 80, 68) and 8 weeks (n = 20, 23) were from independent tissue samples (myo, infarct). Two-way ANOVA with Tukey’s HSD post-hoc tests were used to compare across tissue regions and post-infarction time points. d Representative 90 min 1 week post-infarction histology shows extensive fibrosis (Trichrome), erythrocyte deposition (H&E, inset), and iron accumulation (Prussian blue, inset) at the transition zone between autolyzed necrotic myocytes (H&E) and mixed viable myocytes. Immunohistochemistry shows positive staining for hemoglobin (HBB IHC). e Representative 90 min 8 weeks post-infarction histology shows dense collagen deposition (Trichrome), lack of cell viability (H&E), sparse regions of iron accumulation (Prussian blue, inset) within the infarct core and there was a lack of positive hemoglobin staining (HBB IHC). Representative histology from each infarct group and remote myocardium are shown in Supplementary Figs. 6 and 7. Histology was repeated independently on multiple tissue sections (n > 5) for each post-infarction time point which showed similar histopathological findings within each group. The results are reported as mean ± SD. Significance is indicated by **P < 0.001. T2*w images are at echo time (TE) 10 ms. Source data for b and c are provided as a Source data file.
Fig. 6
Fig. 6. Imaging of ST-elevation myocardial infarction patients after reperfusion therapy.
a Patient had a nontransmural infarction with microvascular obstruction (LGE, white arrows), hemorrhage, and elevated magnetic susceptibility (QSM, red arrows). b Patient had substantial transmural infarction with microvascular obstruction, and significant hemorrhage and increases in magnetic susceptibility. c Patient shows a nontransmural infarction, minimal microvascular obstruction, and no substantial increase in magnetic susceptibility in the infarct region. All patients were reported to have TIMI grade 3 flow (no flow defects) following reperfusion and were imaged within 48 h after reperfusion therapy. T2*w images are at echo time (TE) 10 ms.

References

    1. Carrick D, et al. Myocardial hemorrhage after acute reperfused ST-segment-elevation myocardial infarction: relation to microvascular obstruction and prognostic significance. Circ. Cardiovasc. Imaging. 2016;9:e004148. - PMC - PubMed
    1. Carrick D, et al. Temporal evolution of myocardial hemorrhage and edema in patients after acute ST-segment elevation myocardial infarction: pathophysiological insights and clinical implications. J. Am. Heart. Assoc. 2016;5:e002834. - PMC - PubMed
    1. Ganame J, et al. Impact of myocardial haemorrhage on left ventricular function and remodelling in patients with reperfused acute myocardial infarction. Eur. Heart J. 2009;30:1440–1449. - PubMed
    1. Amabile N, et al. Incidence, predictors, and prognostic value of intramyocardial hemorrhage lesions in ST elevation myocardial infarction. Catheter. Cardiovasc. Interv. 2012;79:1101–1108. - PubMed
    1. Eitel I, et al. Prognostic value and determinants of a hypointense infarct core in T2-weighted cardiac magnetic resonance in acute reperfused ST-elevation-myocardial infarction. Circ. Cardiovasc. Imaging. 2011;4:354–362. - PubMed

Publication types