. 2020 Aug;26(8):1240-1246.
doi: 10.1038/s41591-020-0937-x. Epub 2020 Jun 29.

Pre-existing immunity to influenza virus hemagglutinin stalk might drive selection for antibody-escape mutant viruses in a human challenge model

Affiliations

Pre-existing immunity to influenza virus hemagglutinin stalk might drive selection for antibody-escape mutant viruses in a human challenge model

Jae-Keun Park et al. Nat Med. 2020 Aug.

Abstract

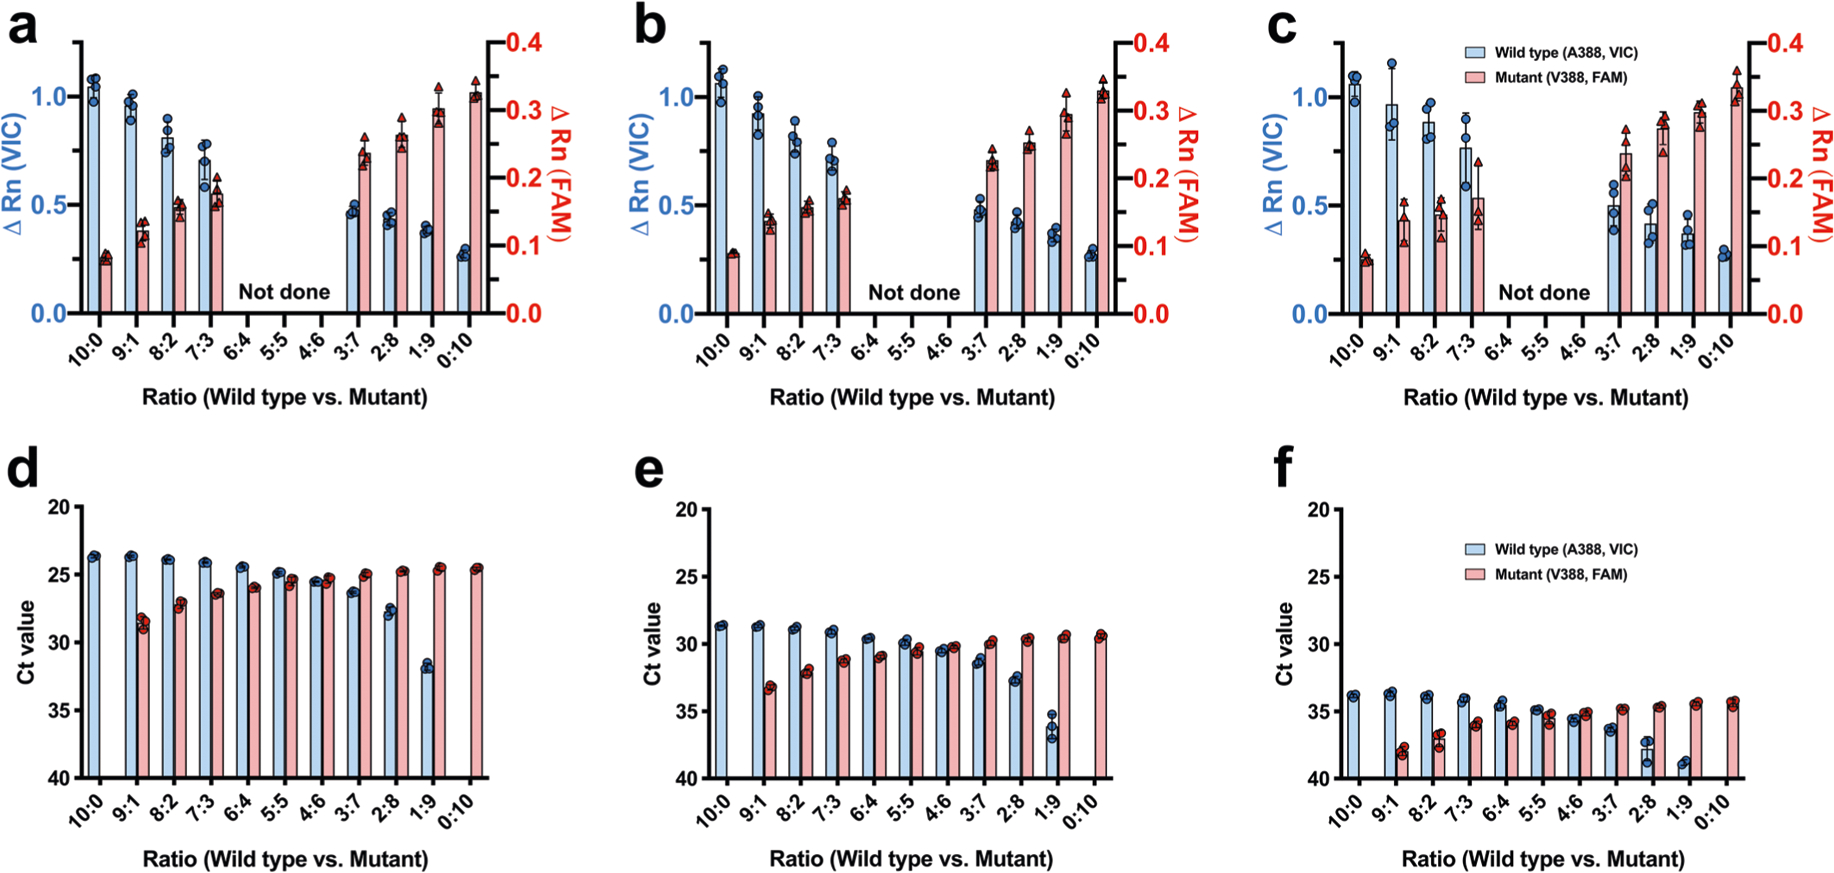
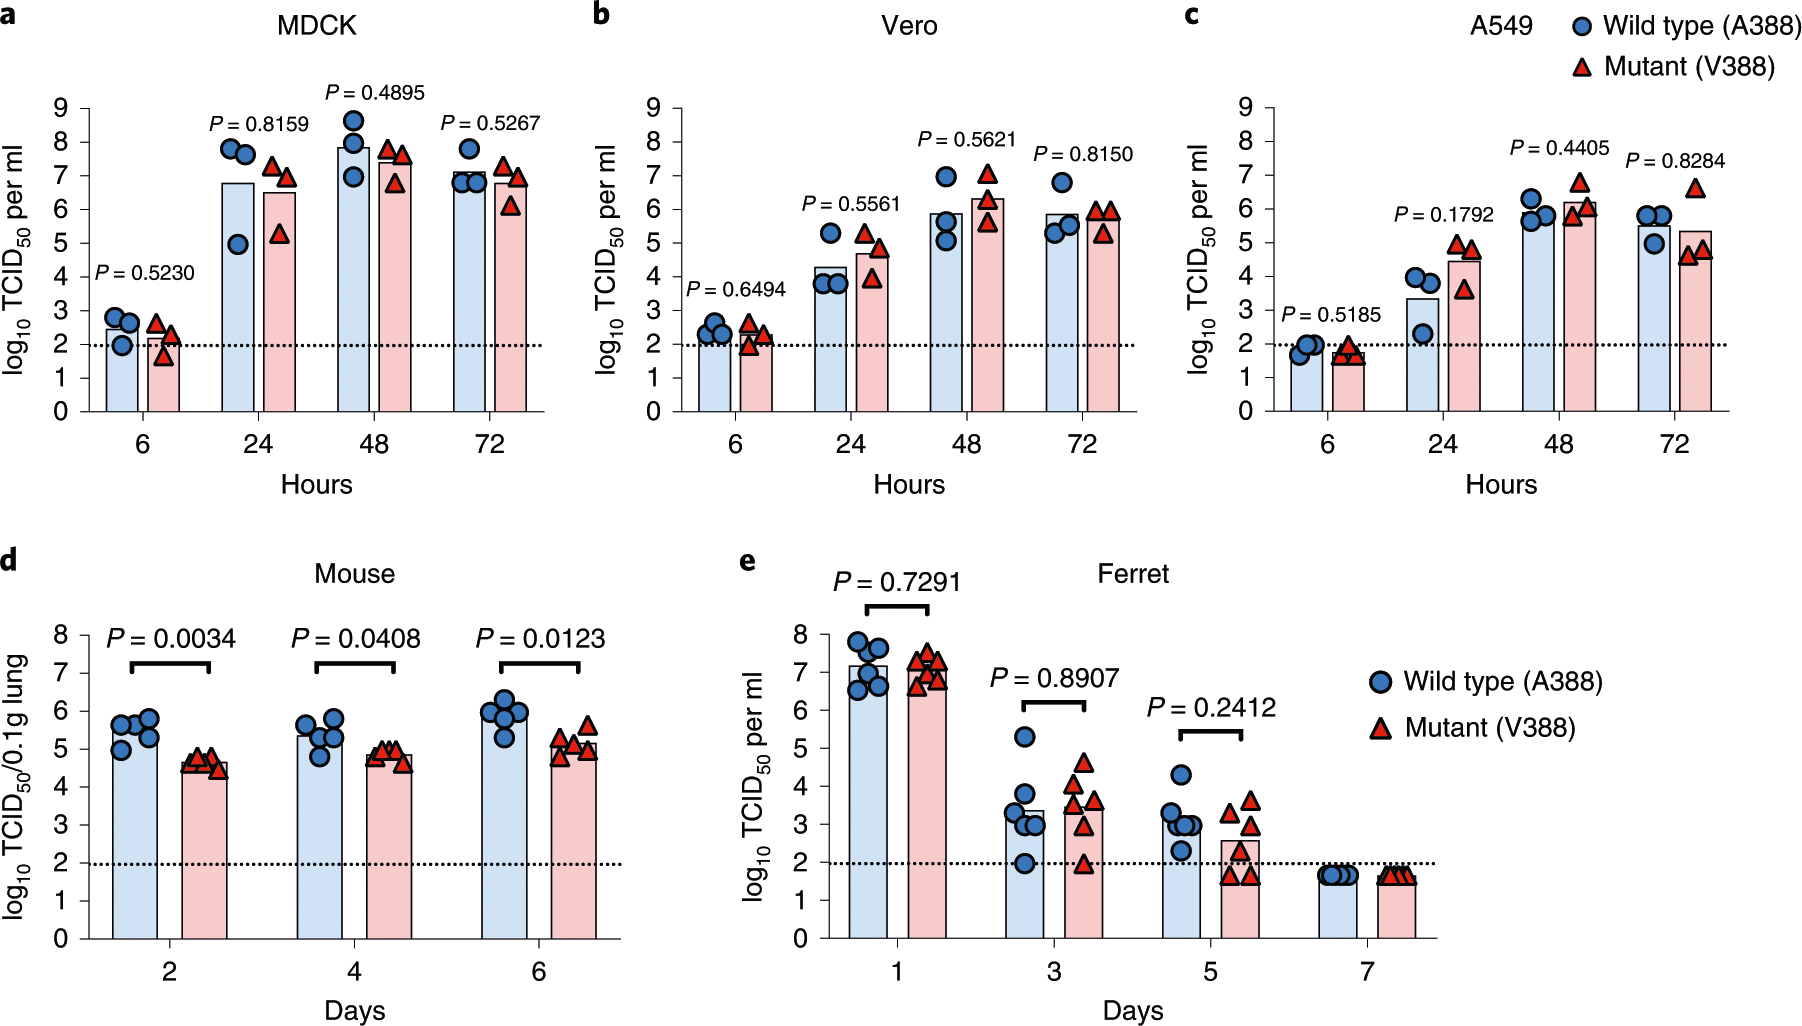
The conserved region of influenza hemagglutinin (HA) stalk (or stem) has gained attention as a potent target for universal influenza vaccines1-5. Although the HA stalk region is relatively well conserved, the evolutionarily dynamic nature of influenza viruses6 raises concerns about the possible emergence of viruses carrying stalk escape mutation(s) under sufficient immune pressure. Here we show that immune pressure on the HA stalk can lead to expansion of escape mutant viruses in study participants challenged with a 2009 H1N1 pandemic influenza virus inoculum containing an A388V polymorphism in the HA stalk (45% wild type and 55% mutant). High level of stalk antibody titers was associated with the selection of the mutant virus both in humans and in vitro. Although the mutant virus showed slightly decreased replication in mice, it was not observed in cell culture, ferrets or human challenge participants. The A388V mutation conferred resistance to some of the potent HA stalk broadly neutralizing monoclonal antibodies (bNAbs). Co-culture of wild-type and mutant viruses in the presence of either a bNAb or human serum resulted in rapid expansion of the mutant. These data shed light on a potential obstacle for the success of HA-stalk-targeting universal influenza vaccines-viral escape from vaccine-induced stalk immunity.


Conflict of interest statement

Competing interests

All authors declare no competing financial or non-financial interests.

Figures

Extended Data Fig. 1 |
Extended Data Fig. 1 |. A Single Nucleotide Polymorphism (SNP) assay using minor groove binder (MGB)-based TaqMan probes for detecting wild-type (A388) or mutant (V388) genes in various conditions.
A SNP assay was developed for detecting wild-type (A388) or mutant (V388) HA genes in various conditions utilizing a set of Minor Groove Binder (MGB)-based TaqMan probes: VIC-labeled probe detecting the wild-type (A388) and a FAM-labeled probe detecting the mutant (V388). The SNP assay was validated using a mixed viral genome from the 2009 H1N1pdm wild-type (A388) and the mutant (V388) viruses. Viral RNA was mixed in varying ratios from 10:0 (0% mutant virus) to 0:10 (100% mutant virus). For the validation of two-step SNP assay for analyzing nasal wash samples from the human challenge study, mixed viral RNA was diluted to represent varying viral loads of (a) 105.5 TCID50/ml, (b) 104.0 TCID50/ml, and (c) 103.0 TCID50/ml. Prepared viral RNA was analyzed by the two-step SNP assay (see Methods). Blue and red bars indicate the ΔRn value of wild-type and mutant virus, respectively. Graphs show mean ΔRn value and standard deviation from 4 independent experiments (a-c, n = 4). For the validation of one-step SNP assay used to analyze selection dynamics in vitro, mixed viral RNA was diluted to represent varying viral loads of (d) 107.0 TCID50/ml, (e) 105.5 TCID50/ml, and (f) 104.0 TCID50/ml. Prepared viral RNA was analyzed by the one-step SNP assay (see Methods). Blue bars indicate the threshold cycle (Ct) values representing the amount of wild-type (A388) virus. Red bars represent the amount of mutant (V388) virus. Graphs show mean Ct value and standard deviation from 3 independent experiments (d-f, n = 3). Results show that the SNP assay reliably detects minor population, either wild-type or mutant, existing as low as 10% across the various viral loads.
Extended Data Fig. 2 |
Extended Data Fig. 2 |. Comparison of different parameters between study participants with different selection outcomes.
Different parameters were compared between groups to find possible correlates of the selection outcomes. a, Pre-challenge serum hemagglutination inhibition (HAI) titers were compared. Black horizontal lines and grey error bars represent geometric mean titer and 95% CI, respectively. Dashed line shows the detection limit. b, The fraction of HA stalk antibodies relative to total HA antibodies was compared. The ratio is a calculation of serum anti-stalk IgG and anti-full-length HA IgG titers measured by ELISA. c, Serum IgG titer data (anti-stalk and anti-total HA) generated in (b) were used to analyze the correlation between the stalk and total HA antibody titers in each selection group. A two-tailed Pearson’s correlation coefficient (Pearson’s r) was used for the analysis. The positive correlation between the stalk antibody titers and total HA titers may explain the lack of difference in stalk/total HA antibody ratio between groups seen in (b). To find a possible role of immunological imprinting on the selection outcomes, (d) age of the participants at the study enrollment and (e) birth year was compared. To find potential loss in viral fitness in humans caused by the A388V mutation, (f) days of symptoms, (g) number of symptoms, and (h) duration of shedding after the challenge infection were compared between groups. Black horizontal lines and grey error bars represent median value and 95% CI, respectively (b,d,e-h). A two tailed nonparametric Mann-Whitney test was used to compare parameters from the mutant selection group to other selection groups. Each symbol represents an individual study participant and their selection outcome (wild-type selection, n = 8; mixed shedding, n = 9; mutant selection, n = 12).
Extended Data Fig. 3 |
Extended Data Fig. 3 |. A significant conformational change to the HA stalk region induced by A388V mutation.
MDCK cells were infected with 1 multiplicity of infection (MOI) of wild-type (A388) or mutant (V388) H1N1pdm viruses generated by reverse genetics. 24 hours after infection, cells were harvested, and the expression of wild-type and mutant HA was measured by flow cytometry to evaluate the effect of the A388V mutation on the HA stalk epitopes. a, A representative example of the gating strategy. Dead cells and debris were excluded based on FSC/SSC cell dot plot. Anti-influenza nucleoprotein (NP) antibodies conjugated with allophycocyanin (APC) were used for gating. Only infected cells, expressing NP, were used for the analysis. Broadly neutralizing antibodies binding to the HA stalk, (b) CR6261, (c) CR9114, (d) FI6V3, (e) 70–1F02, (f) C179, and (g) CT149 were conjugated with fluorescein isothiocyanate (FITC). A monoclonal antibody that binds to the HA globular head, (h) EM-4C04, was conjugated with r-phycoerythrin (R-PE). Each stalk-binding antibody was mixed with the head-binding EM-4C04 antibody and NP antibody, and the antibody mixtures were used to stain cells expressing the wild-type or mutant HA. Histograms are colored differently to show different experimental groups: Blue - cells infected with wild-type (A388) virus; Pink - cells infected with mutant (V388) virus; Black - unstained cell control. Representative histograms from three independent experiments are shown. The summary table shows the average median fluorescence intensity (MFI) and standard error of mean (s.e.m.) of the three independent experiments.
Extended Data Fig. 4 |
Extended Data Fig. 4 |. Comparison between stalk-only and full-length HA construct.
Stalk-only constructs with or without the A388V mutation (See Extended Data Fig. 7b for the amino acid sequence) were produced to measure the level of antibodies recognizing the mutant stalk in human serum while excluding head-binding antibodies (Fig. 3j). To confirm that the stalk-only construct with A388V mutation appropriately represents the natural A388V stalk structure, the level of decrease in broadly neutralizing monoclonal antibodies (bNAbs) binding was compared between the stalk-only construct and the full-length HA. ELISA was performed using serially diluted (a,b) CR6261, (c,d) CR9114, (e,f) FI6V3, (g,h) 70–1F02, (l,j) C179, and (k,l) CT149. (m,n) Anti-StrepTag II antibody was used to show that equal amounts of wild-type and mutant antigen were used for the analysis. The AUC was calculated using GraphPad Prism8 (v.8.3.0). The AUC for the full-length HAs (b,d,f,h,j,l) was calculated using the data from Fig. 3. Graphs show mean and standard deviations from three independent measurements. The summary table shows the mean OD492 values and standard error of mean (s.e.m.) of the three independent measurements. The comparison result (summarized in the table) shows that the A388V stalk-only construct closely represents the natural stalk structure of the full-length A388V HA.
Extended Data Fig. 5 |
Extended Data Fig. 5 |. AuC calculation using wile-type and mutant stalk-only construct.
Raw ELISA data used to generate Fig. 3j are shown. Stalk-only constructs with or without the A388V mutation (See Extended Data Fig. 7b for the amino acid sequence) were used to measure changes in the level of antibodies recognizing the wild-type (A388) of mutant (V388) stalk in human serum. twenty-nine pre-challenge serum samples from the influenza human challenge study participants were serially diluted and used for the ELISA. the AUC was calculated using graphPad Prism8 (v.8.3.0) with the baseline value of 0.1 (approximately 2 times the OD492 value from the control wells). Blue lines and numbers show the ELISA data and the AUC, respectively, obtained using the wild-type (A388) stalk construct. Red lines and numbers show the ELISA data and the AUC, respectively, obtained using the mutant (V388) stalk construct. graphs show mean and standard deviations from three independent measurements.
Extended Data Fig. 6 |
Extended Data Fig. 6 |. Association between the stalk antibody titers and selection pressure measured in vitro.
Selection pressure placed by individual human sera was measured using pre-challenge serum from the influenza human challenge study participants. a, An equal mixture of the wild-type (A388) and mutant (V388) virus was cultured with 1:50 diluted serum samples. Sera from Q1, Q2, Q3 and Q4 from Fig. 1 (n = 7 per quartile) were used. Culture supernatants were collected at 48 and 72 hours after infection followed by viral RNA extraction. The selection dynamics were measured using a Single Nucleotide Polymorphism (SNP) assay utilizing a set of Minor Groove Binder (MGB)-based TaqMan probes; VIC-labeled probe detects the wild-type (A388); FAM-labeled probe detects the mutant (V388). Data are presented as the threshold cycle (Ct) value from the SNP assay. Dashed lines show the Ct value limit (Ct 40) of the SNP assay. A Ct value of 41 was given to undetected signals to generate graphs. Error bars represent standard deviations from three independent experiments. The final dilution is noted on the individual graph if higher than 1:50. b, Mutant selection index was calculated based on data from (a) by ΔΔCt method using controls cultured without serum (see Methods). A mutant selection index higher than 0 (pink area) indicates a serum sample selected for the mutant virus. An index lower than 0 (blue area) indicates a serum sample selected for the wild-type virus. Horizontal lines show median values and error bars represent 95% CI. The indexes between samples from different quartiles were compared using nonparametric one-way analysis of variance (Kruskal-Wallis test) and Dunn’s test as a post-hoc test. c, Correlation between the anti-stalk serum IgG titer and the selection index of 29 sera samples were analyzed by calculating two-tailed Spearman’s rank correlation coefficient (Spearman r). The best-fit line was plotted using simple linear regression analysis. Statistical analyses were performed using GraphPad Prism8 (v.8.3.0).
Extended Data Fig. 7 |
Extended Data Fig. 7 |. Sequence of wild-type and mutant full-length HA or HA stalk-only constructs.
Amino acid sequences of (a) full-length HA and (b) stalk-only proteins with or without A388V mutation are shown. A388V mutation, HA trimerization domain, and StrepTag II sequence are highlighted. Consensus amino acid sequences are shown in dots.
Fig. 1 |
Fig. 1 |. Association between pre-existing anti-HA stalk immunity and mutant virus selection in humans.
a, Study design. Influenza human challenge study participants were challenged using a virus stock containing a polymorphism in the HA stalk: 45% wild-type (A388) and 55% mutant (V388) virus. Viral RNA was extracted from post-challenge nasal wash samples and analyzed for selection outcomes (that is, whether the participants selected for the wild-type or mutant virus) by a SNP assay using a set of MGB-based TaqMan probes. b, Participants with a successful determination of the selection outcome were arranged in a descending manner by the participants’ pre-existing anti-HA stalk serum IgG titers measured using ELISA and divided into quartiles (Q1-Q4). Each bar represents an individual selection outcome by color (for example, a red bar represents a challenge study participant in which the mutant virus was selected during the viral challenge infection), and the length of each bar represents anti-HA stalk serum IgG titer of each participant. c, d, Participants were grouped depending on the selection outcome, and the stalk antibody titers from the mutant selection group were compared to other selection groups using a two-tailed nonparametric Mann-Whitney test. Median values are shown as a horizontal line.
Fig. 2 |
Fig. 2 |. Effect of A388V stalk mutation on viral replicative fitness.
Wild-type (A388) or mutant (V388) H1N1pdm viruses were generated by reverse genetics and characterized for the viral replicative fitness. To measure in vitro fitness, (a) MDCK, (b) Vero and (c) A549 cells were infected at 0.001 MOI. Supernatants were collected at 6, 24, 48 and 72 h after infection, followed by titration in MDCK cells. Each symbol indicates an individual measurement. All conditions were independently replicated a total of three times. Bars represent geometric means. For measuring in vivo fitness, (d) 7–8-week-old female BALB/c mice were intranasally infected with 103 TCID50 of wild-type or mutant virus in a 50-μl inoculum; (e) 6–7-month-old female ferrets were intranasally infected with 105 TCID50 of wild-type or mutant virus in a 1-ml inoculum. Each symbol in d and e represents an individual animal. Viral loads were titrated in MDCK from (d) mice lung homogenate (n = 5) or (e) ferret nasal wash (n = 6). Bars represent geometric mean titers. Dashed lines show the detection limit of the TCID50 assay. An unpaired two-tailed Welch’s t-test was used to compare the level of viral growth between the wild-type and mutant virus. log10-transformed titers were used for the comparison.
Fig. 3 |
Fig. 3 |. A significant conformational change to the HA stalk region induced by A388V mutation.
Full-length HA and HA stalk-only proteins with or without A388V mutation were used for ELISA to measure conformational changes introduced by the A388V mutation. Six bNAbs binding to the HA stalk—(a) CR6261, (b) CR9114, (c) FI6V3, (d) 70–1F02, (e) C179 and (f) CT149—were used to detect changes in the HA stalk structure using the full-length wild-type or mutant HAs. Neutralizing monoclonal antibodies that bind to the HA globular head, (g) EM-4C04 and (h) 2–12C, were used to show the structural integrity of the purified HA proteins. i, Anti-Strep-tag II antibody was used to show that equal amounts of wild-type or mutant HAs were used. Graphs show mean and s.d. from three independent measurements (a-i, n = 3). j, Decreased recognition of the mutant stalk by serum from the study participants (n = 29) is shown as assayed using stalk-only constructs (wild type or mutant) that measure only HA stalk-binding antibodies while excluding HA head-binding antibodies. A two-tailed paired t-test was used to compare the AUCs. A structural analysis was performed with UCSF Chimera using a previously published 2009 H1N1 influenza virus HA structure (PDB ID: 3LZG). k, Each monomer of the trimeric HA structure was colored in beige, gray and green. The location of A388V mutation in the short α-helix of the HA stalk structure is highlighted in pink. An area surrounding the A388V mutation (red box) was magnified for (l) wild-type HA (A388) and (m) mutant HA (V388) for clarity. A388V mutation and adjacent amino acids (Trp 365, cyan; Tyr 366, orange) that are predicted to undergo steric clash are shown. Molecules expected to experience steric clash are highlighted in red. Blue lines indicate the predicted clashes between molecules.
Fig. 4 |
Fig. 4 |. increased resistance to broadly neutralizing antibodies by A388V mutation and its rapid selection by immune pressure.
IC50 values of (a) CR6261, (b) CR9114 and (c) FI6V3 to the wild-type or mutant virus were measured three times independently (n = 3). An unpaired two-tailed Welch’s t-test was used to compare the IC50 values. d, 7–8-week-old female BALB/c mice were intranasally infected with 103 TCID50 of wild-type or mutant virus 24h after a prophylactic intraperitoneal injection of CR6261 antibody. At day 2 after infection, viral RNA levels from the mouse lung were quantified and compared to that of control mice not treated with antibodies. The level of viral RNA from control group was considered 100%. Each symbol represents an individual animal (n = 5). Bars represent geometric means. A two-tailed nonparametric Mann-Whitney test was used. Selection dynamics under immune pressure were measured by co-culturing the viruses with CR6261 antibody. The virus mixture, consisting of 50% wild-type and 50% mutant virus, was cultured in the (e) absence or (f) presence of CR6261. The mixture consisting of 95% wild-type and 5% mutant virus was cultured in the (g) absence or (h) presence of CR6261 antibody. Serum samples from each selection group (Fig. 1a) were pooled and used to place immune pressure. The viruses were mixed to represent the challenge virus inoculum used in the human challenge studies (45% wild type and 55% mutant) and co-cultured with pooled serum from each group: (i) mutant-select group, (j) mixed shedding group, (k) wild-type-select group and (l) without serum as a control. Data from e-l are presented as the Ct value from the SNP assay, and dashed lines show the Ct value limit (Ct 40) of the SNP assay. To generate graphs, undetected signals were assigned a Ct value of 41. Graphs show mean and s.d. from three independent experiments (n = 3).

References

    1. Okuno Y, Isegawa Y, Sasao F & Ueda S A common neutralizing epitope conserved between the hemagglutinins of influenza A virus H1 and H2 strains. J. Virol 67, 2552–2558 (1993). - PMC - PubMed
    1. Krammer F, Pica N, Hai R, Margine I & Palese P Chimeric hemagglutinin influenza virus vaccine constructs elicit broadly protective stalk-specific antibodies. J. Virol 87, 6542–6550 (2013). - PMC - PubMed
    1. Impagliazzo A et al. A stable trimeric influenza hemagglutinin stem as a broadly protective immunogen. Science 349, 1301–1306 (2015). - PubMed
    1. Yassine HM et al. Hemagglutinin-stem nanoparticles generate heterosubtypic influenza protection. Nat. Med 21, 1065–1070 (2015). - PubMed
    1. Andrews SF, Graham BS, Mascola JR & McDermott AB Is it possible to develop a “universal” influenza virus vaccine? Immunogenetic considerations underlying B-cell biology in the development of a pan-subtype influenza A vaccine targeting the hemagglutinin stem. Cold Spring Harb. Perspect. Biol 10, a029413 (2018). - PMC - PubMed

Publication types

MeSH terms

Substances