. 2020 Aug;15(8):690-697.
doi: 10.1038/s41565-020-0701-x. Epub 2020 Jun 29.

In situ electrochemical generation of nitric oxide for neuronal modulation

Affiliations

In situ electrochemical generation of nitric oxide for neuronal modulation

Jimin Park et al. Nat Nanotechnol. 2020 Aug.

Abstract

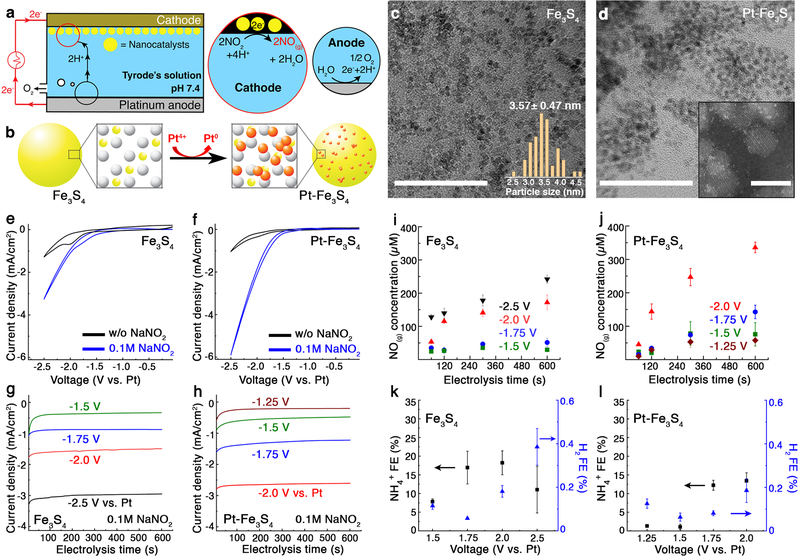
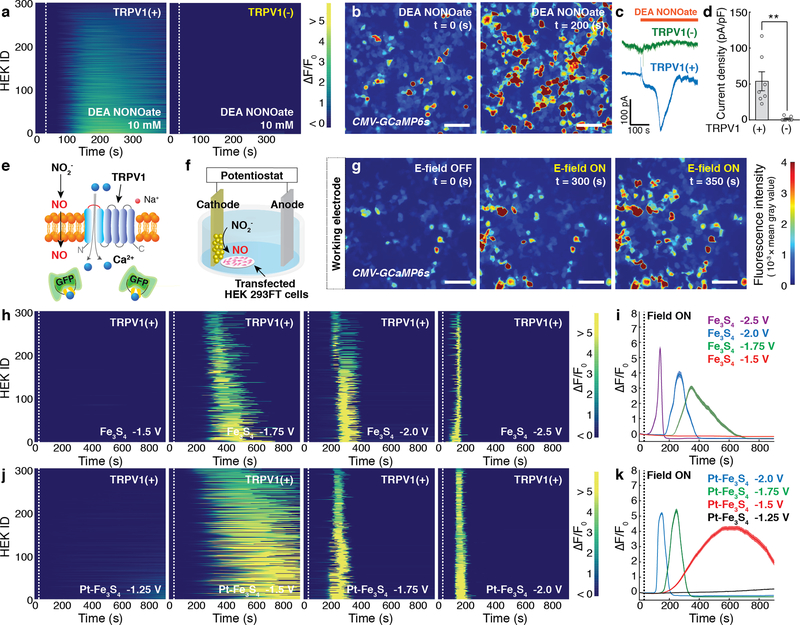
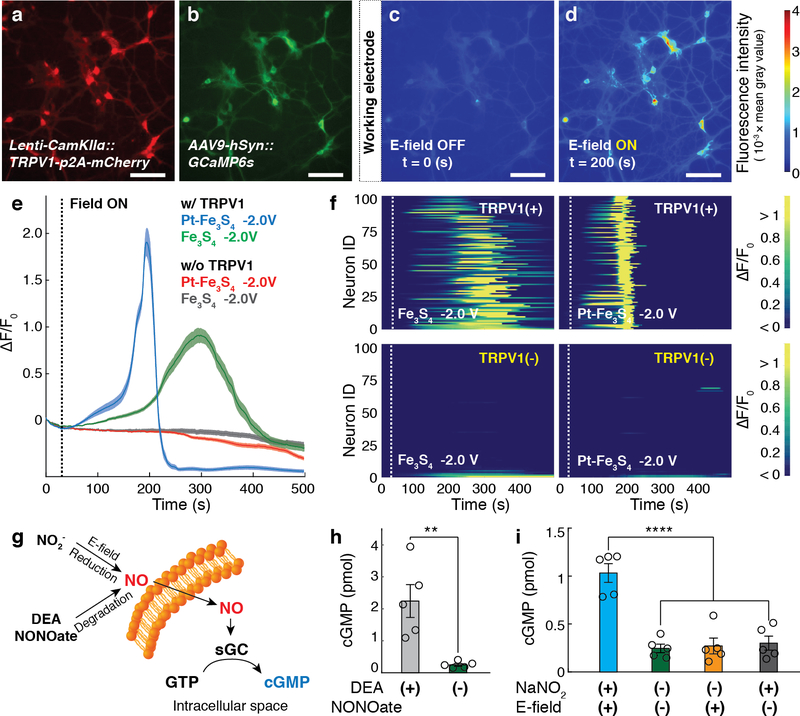
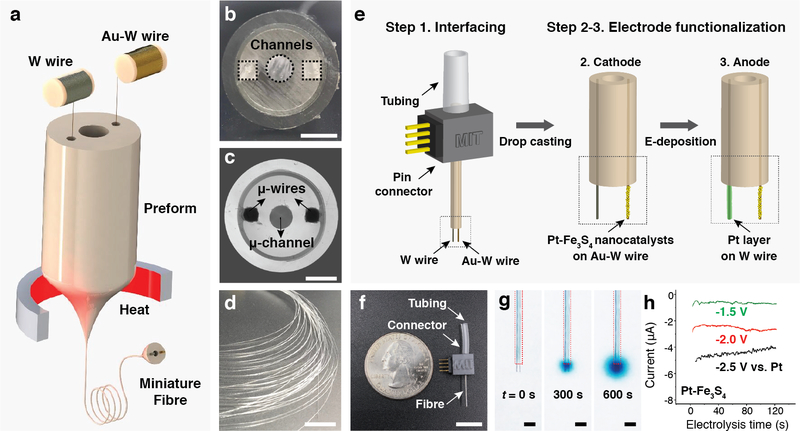
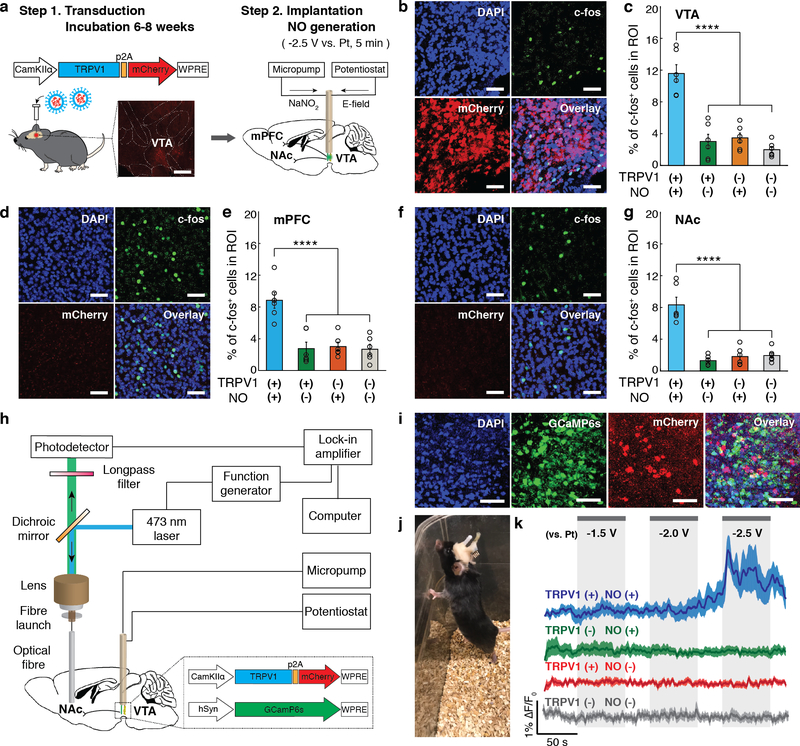
Understanding the function of nitric oxide, a lipophilic messenger in physiological processes across nervous, cardiovascular and immune systems, is currently impeded by the dearth of tools to deliver this gaseous molecule in situ to specific cells. To address this need, we have developed iron sulfide nanoclusters that catalyse nitric oxide generation from benign sodium nitrite in the presence of modest electric fields. Locally generated nitric oxide activates the nitric oxide-sensitive cation channel, transient receptor potential vanilloid family member 1 (TRPV1), and the latency of TRPV1-mediated Ca2+ responses can be controlled by varying the applied voltage. Integrating these electrocatalytic nanoclusters with multimaterial fibres allows nitric oxide-mediated neuronal interrogation in vivo. The in situ generation of nitric oxide in the ventral tegmental area with the electrocatalytic fibres evoked neuronal excitation in the targeted brain region and its excitatory projections. This nitric oxide generation platform may advance mechanistic studies of the role of nitric oxide in the nervous system and other organs.


Conflict of interest statement

Competing interests

The authors declare no competing financial interests.

Figures

Fig. 1:
Fig. 1:
Fe3S4 and Pt-Fe3S4 nanocatalysts for electrochemical reduction of NO2 into NO. a, An illustration of the electrochemical NO-delivery system. b, A schematic of the galvanic replacement method for decoration on the Fe3S4 nanocatalysts with Pt. Fe, S, and Pt atoms are marked in yellow, white, and red, respectively. c-d, Transmission electron microscope (TEM) images of the Fe3S4 (c) and the Pt-Fe3S4 (d) nanocatalysts. Scale bar: 50 nm. Insets show the size distribution of the Fe3S4, obtained from 50 randomly chosen nanoparticles (c) and high-resolution scanning TEM images of the Pt-Fe3S4 nanocatalysts (d). Scale bar: 5 nm. The experiment was repeated three times independently with similar results. e-f, Cyclic voltammetry (CV) curves of the Fe3S4 (e) and the Pt-Fe3S4 (f) nanocatalysts in the presence and absence of NO2. Scan rate: 50 mV/s. g-h, Chronoamperometry profiles of the Fe3S4 (g) and the Pt-Fe3S4 (h) nanocatalysts. i-j, Voltage-dependent NO generation (mean ± standard deviation (s.d.)) from the Fe3S4 (i) and the Pt-Fe3S4 (j) nanocatalysts (n=3 independent experiments for each group). k-l, The Faradaic efficiency (FE) for NH4+ and H2 (mean ± s.d.) from the Fe3S4 (k) and the Pt-Fe3S4 (l) nanocatalysts (n=3 independent experiments for each group). Voltage ranges of –1.5 V to –2.5 V and –1.25 V to –2.0 V vs Pt were chosen for the Fe3S4 and the Pt-Fe3S4 nanocatalysts, respectively.
Fig. 2:
Fig. 2:. Electrochemically produced NO triggers TRPV1.
a, GCaMP6s fluorescence intensity in 300 TRPV1+ (Left) or TRPV1– (Right) HEK293FT cells following addition of a NO donor, DEA NONOate (10 mM), at 30 s (dashed lines). b, Representative time-lapse images of global Ca2+ responses in TRPV1+ cells in response to the DEA NONOate infusion. Scale bar: 50 μm. c, Representative whole-cell patch-clamp traces of TRPV1+ cells (blue) and TRPV1- cells (green) in response to DEA NONOate infusion at the holding potential of – 40 mV. d, Peak current density (mean ± standard error of the mean (s.e.m.)) following DEA NONOate infusion in TRPV1+ cell or TRPV1- cells. A significant difference was observed between two groups, as confirmed by one-tailed Student’s t-test (n = 7 cells for each group, ** (p = 0.0038) < 0.01). e, A schematic illustrating Ca2+ influx through TRPV1 mediated by electrochemically produced NO. f, Experimental scheme for the electrochemical NO-delivery in vitro. g, Representative time-lapse images of Ca2+ influx into TRPV1+ cells evoked by the Fe3S4-catalysed NO generation at –1.75 V vs Pt. The cathode decorated with the Fe3S4 nanocatalysts was positioned at the left edge in all the images. Scale bar: 50 μm. (a, b, and g) The experiment was repeated three times independently with similar results. h-k, Individual (h, j) and averaged (i, k) GCaMP6s fluorescence traces for TRPV1+ cells (n = 300 cells for each trace) in the presence of Fe3S4 (h, i) and the Pt-Fe3S4 (j, k) nanocatalysts and 0.1 M NaNO2. Voltages of –1.5, –1.75, –2.0, –2.5 V and –1.25, –1.5, –1.75, –2.0 V vs Pt were applied at 30 s (dashed lines) in the presence of Fe3S4 and Pt-Fe3S4 nanocatalysts, respectively. i, k, Solid lines, and shaded areas indicate the mean and s.e.m., respectively. F0 indicates the mean of the fluorescence intensity during the initial 10 s of measurement.
Fig. 3:
Fig. 3:. Signalling pathways mediated by electrocatalytic NO generation in vitro.
a-b, Fluorescent images of hippocampal neurons co-transduced with TRPV1 and GCaMP6s. Scale bar: 50 μm. c-d, Representative images of GCaMP6s intensity of TRPV1+ neurons prior to (c) and following (d) NO release electrocatalysed by Pt-Fe3S4 at –2.0 V vs Pt. The Pt-Fe3S4 nanocatalysts-loaded cathode was located at the left edge in all the images. (a-d) The experiment was repeated three times independently with similar results. e, Normalized GCaMP6s fluorescence averaged across TRPV1+ and TRPV1– neurons (n = 100 neurons for each trace) following NO delivery electrocatalysed by Pt-Fe3S4 and Fe3S4 nanoclusters at –2.0 V vs Pt applied at 30 s (dashed line). Solid lines and shaded areas indicate the mean and s.e.m., respectively. f, Individual GCaMP6s fluorescence in 100 TRPV1+ and 100 TRPV1– neurons following NO delivery electrocatalysed by Pt-Fe3S4 and Fe3S4 at –2.0 V vs Pt applied at 30 s (dashed lines). F0 indicates the mean of the fluorescence intensity during the initial 10 s of measurement. g, An illustration of the NO-sGC-cGMP signalling pathway in genetically intact cerebellar neurons. GTP stands for guanosine 5’-triphosphate. h, Intracellular cGMP levels (mean ± s.e.m.) in 5 × 10⁶ cerebellar neurons following incubation with DEA NONOate (10 mM) or Tyrode’s solution for 5 min. A significant difference was found between two groups, as assessed by one-tailed Student’s t-test (n = 5 independent experiments for each group, ** (p = 0.0089) < 0.01). i, Intracellular cGMP levels (mean ± s.e.m.) in 5 × 10⁶ cerebellar neurons following NO delivery electrocatalysed by Pt-Fe3S4 at –2.5 V vs Pt for 5 min. Statistical significance of an increase in cGMP levels after NO delivery as compared to controls was confirmed by one-way ANOVA and Tukey’s multiple comparison test (n = 5 independent experiments for each group, F3,16 = 24.41, **** (p = 3.3 × 10⁻⁶) < 0.0001).
Fig. 4:
Fig. 4:. Fabrication and characterization of the NO-delivery fibre.
a, An illustration of the fibre drawing process. Tungsten and gold-plated tungsten wires were converged into the preform during the draw. b, Cross-sectional image of the preform containing three hollow channels. Scale bar: 3 mm. c, Cross-sectional microscope image of the resulting fibre. Scale bar: 100 μm. d, A photograph of a bundle of fibre produced during the draw. Scale bar: 10 cm. e, An illustration of fibre connectorization, followed by functionalization of the cathode and anode microwires with Pt-Fe3S4 nanocatalysts and Pt layer, respectively. f, A photograph of a fully assembled NO-delivery fibre. Scale bar: 10 mm. g, Infusion of Tyrode’s solution containing 0.1 M NaNO2 and a dye (BlueJuice) into a brain phantom (0.6% agarose gel) through the microfluidic channel. Images were taken at 0, 300 and 600 s after the infusion at a rate of 100 nL/min. Scale bar: 500 μm. h, Chronoamperometry profiles of the NO-delivery fibre in the Tyrode’s solution containing 0.1 M NaNO2.
Fig. 5:
Fig. 5:. Neuronal stimulation mediated by NO-delivery via implanted fibres in vivo.
a, An illustration of the virus-assisted gene delivery, fibre implantation, and NO generation in the mouse brain. Inset: A confocal image of TRPV1-p2A-mCherry expression in the mouse VTA. Scale bar: 500 μm. b-g, Confocal images (in TRPV1+ mice) (b, d, and f) and percentages of the c-fos expressing neurons among DAPI-labeled cells (mean ± s.e.m.) (c, e, and g) in the region of interest (ROI) in the VTA (b, c), mPFC (d, e), and NAc (f, g) following electrocatalytic NO generation in the VTA. Scale bar: 50 μm. Statistical significance of an increase in c-fos expression after NO generation in TRPV1+ mice as compared to controls was confirmed by one-way ANOVA and Tukey’s multiple comparison tests (n = 6 mice, VTA F3,20 = 29.97 p = 1.3 × 10⁻⁷, mPFC F3,20 = 15.49 p = 1.92 × 10⁻⁵, NAc F3,20 = 33.54 p = 5.4 × 10⁻⁸, **** p < 0.0001). h, An illustration of the fibre photometry setup integrated with the micropump and potentiostat for NO generation. i, Representative confocal microscope images of a mouse VTA co-expressing GCaMP6s and TRPV1-p2A-mCherry. Scale bar: 50 μm. The experiment was repeated three times independently with similar results. j, A mouse implanted with a NO-delivery fibre in the VTA and an optical fibre in the NAc. k, Normalized GCaMP6s fluorescence traces in the NAc of the anesthetized TRPV1+ (blue) and TRPV1– (green) mice in the presence of NO generation and the NAc of TRPV1+ (red) and TRPV1- mice (gray) in the presence of voltage alone (no NaNO2 infusion). Solid lines and shaded areas indicate the mean and s.e.m., respectively (n = 5 mice per condition). F0 indicates the mean of the fluorescence intensity during the initial 10 s of measurement.

Comment in

  • Electrochemical cell in the brain.
    Nam KT, Park S. Nam KT, et al. Nat Nanotechnol. 2020 Aug;15(8):625-626. doi: 10.1038/s41565-020-0711-8. Nat Nanotechnol. 2020. PMID: 32601445 No abstract available.

References

    1. Bredt DS & Snyder SH NITRIC OXIDE: A Physiologic Messenger Molecule. Annu. Rev. Biochem 63, 175–195 (1994). - PubMed
    1. Mustafa AK, Gadalla MM & Snyder SH Signaling by gasotransmitters. Sci. Signal 2, (2009). - PMC - PubMed
    1. Yoshida T et al. Nitric oxide activates TRP channels by cysteine S-nitrosylation. Nat. Chem. Biol 2, 596 (2006). - PubMed
    1. Lundberg JO, Weitzberg E & Gladwin MT The nitrate-nitrite-nitric oxide pathway in physiology and therapeutics. Nat. Rev. Drug Discov 7, 156–167 (2008). - PubMed
    1. Calabrese V et al. Nitric oxide in the central nervous system: neuroprotection versus neurotoxicity. Nat. Rev. Neurosci 8, 766 (2007). - PubMed

Publication types