. 2020 Sep;4(9):937-948.
doi: 10.1038/s41562-020-0901-2. Epub 2020 Jun 29.

Memorability of words in arbitrary verbal associations modulates memory retrieval in the anterior temporal lobe

Affiliations

Memorability of words in arbitrary verbal associations modulates memory retrieval in the anterior temporal lobe

Weizhen Xie et al. Nat Hum Behav. 2020 Sep.

Abstract

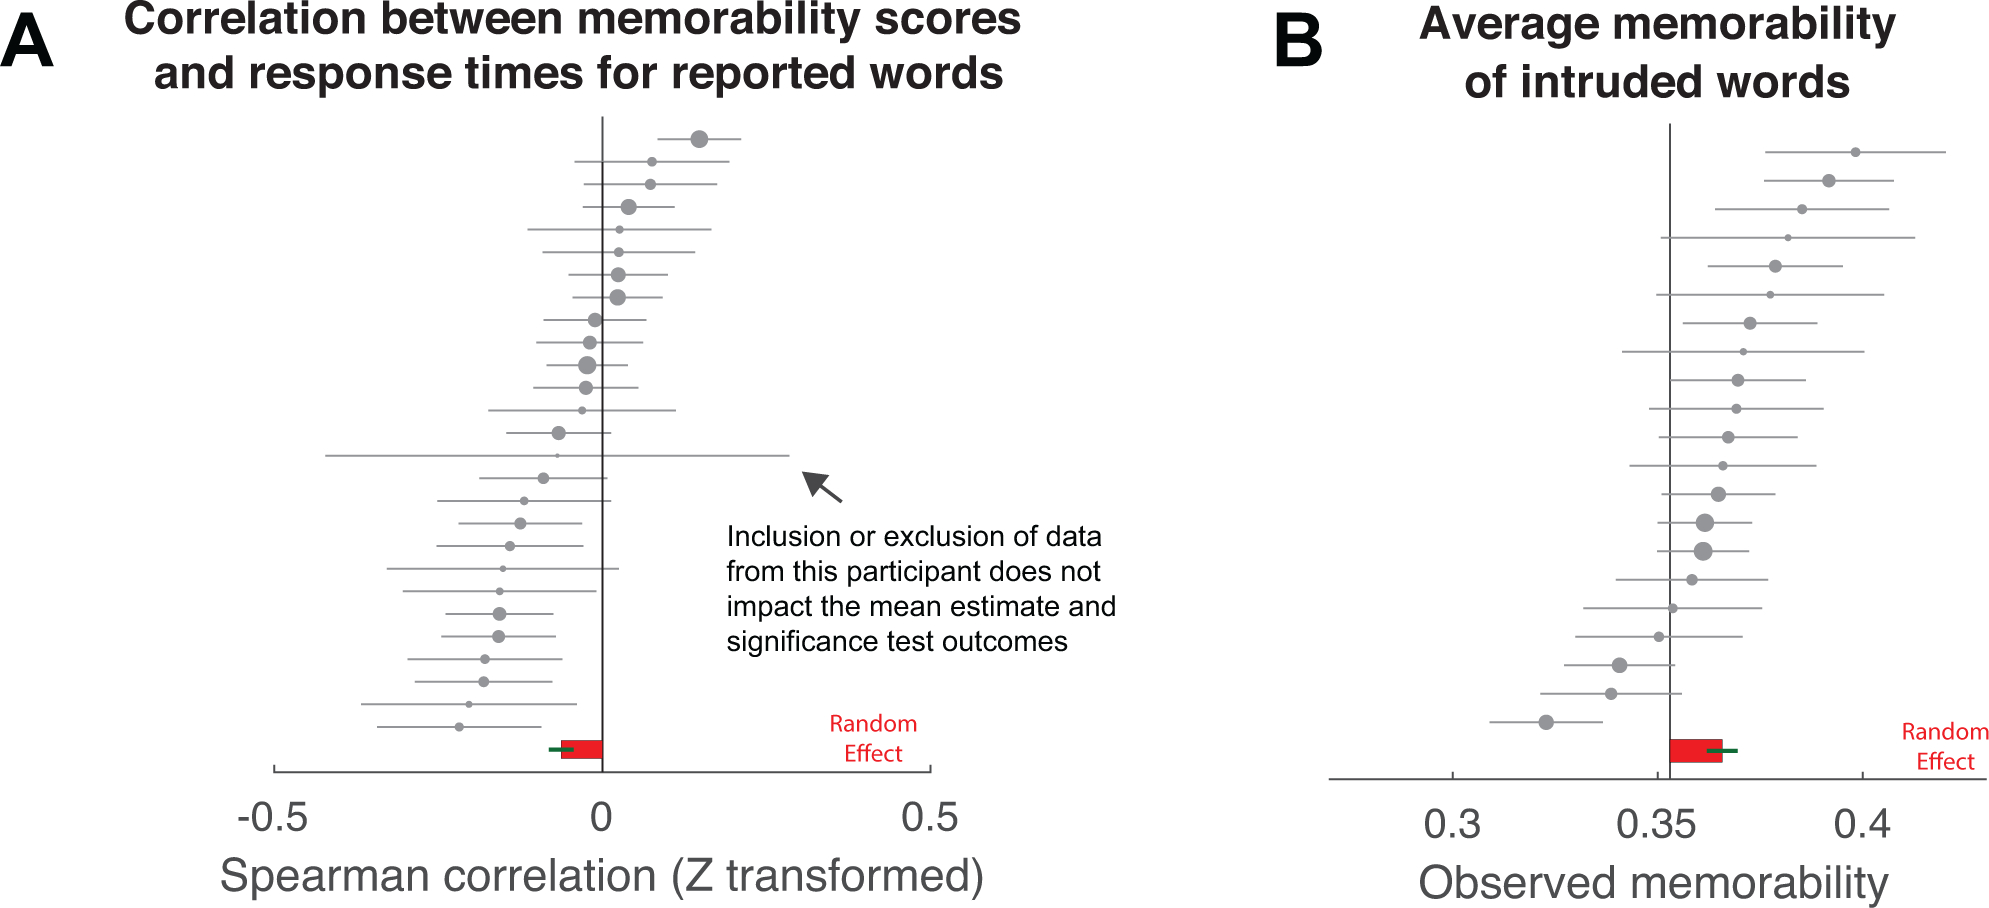
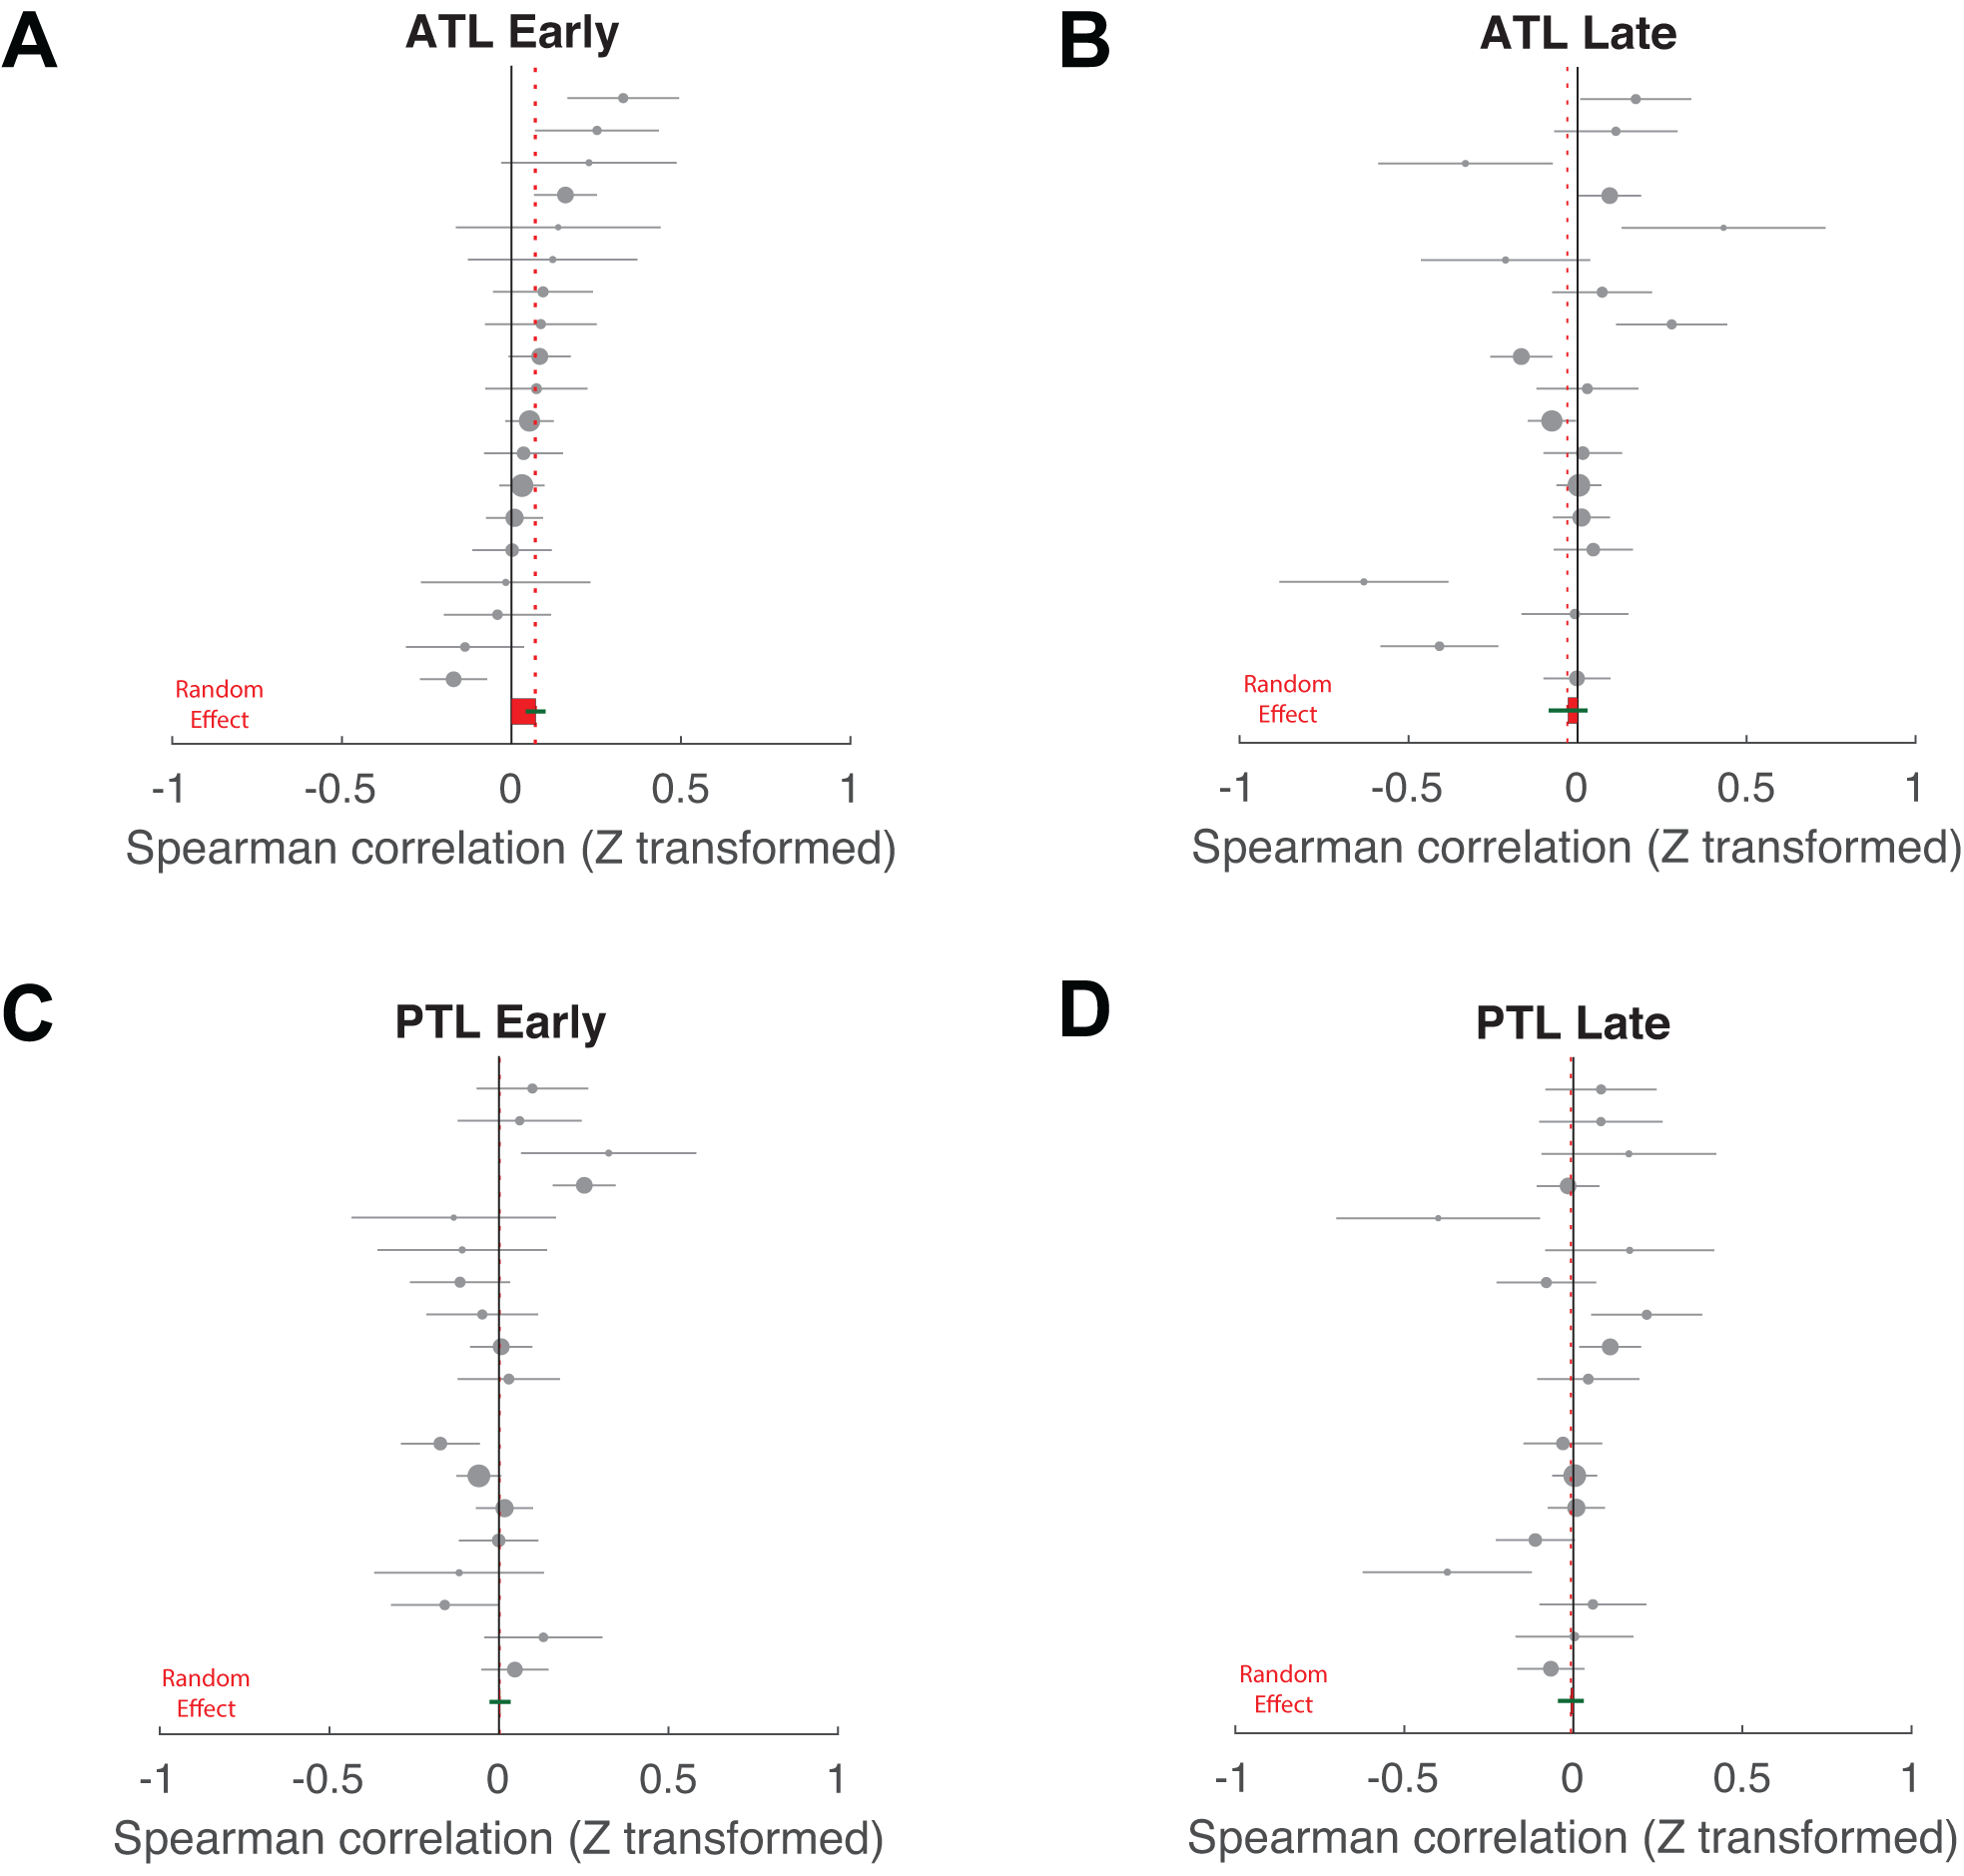
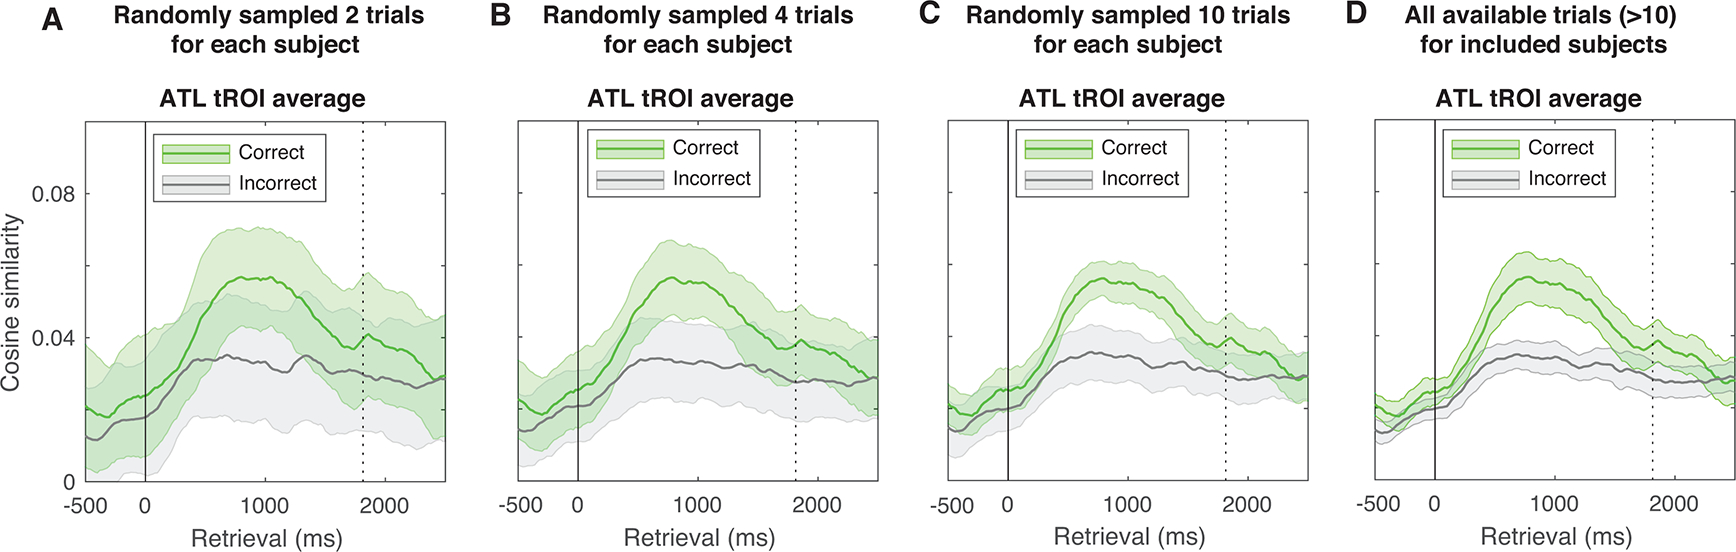
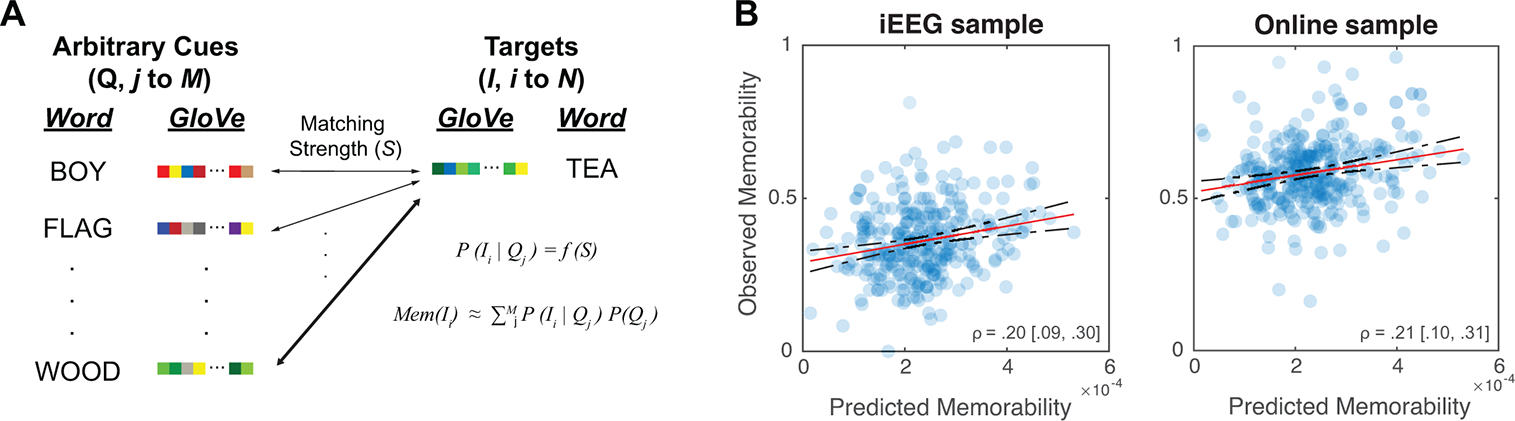
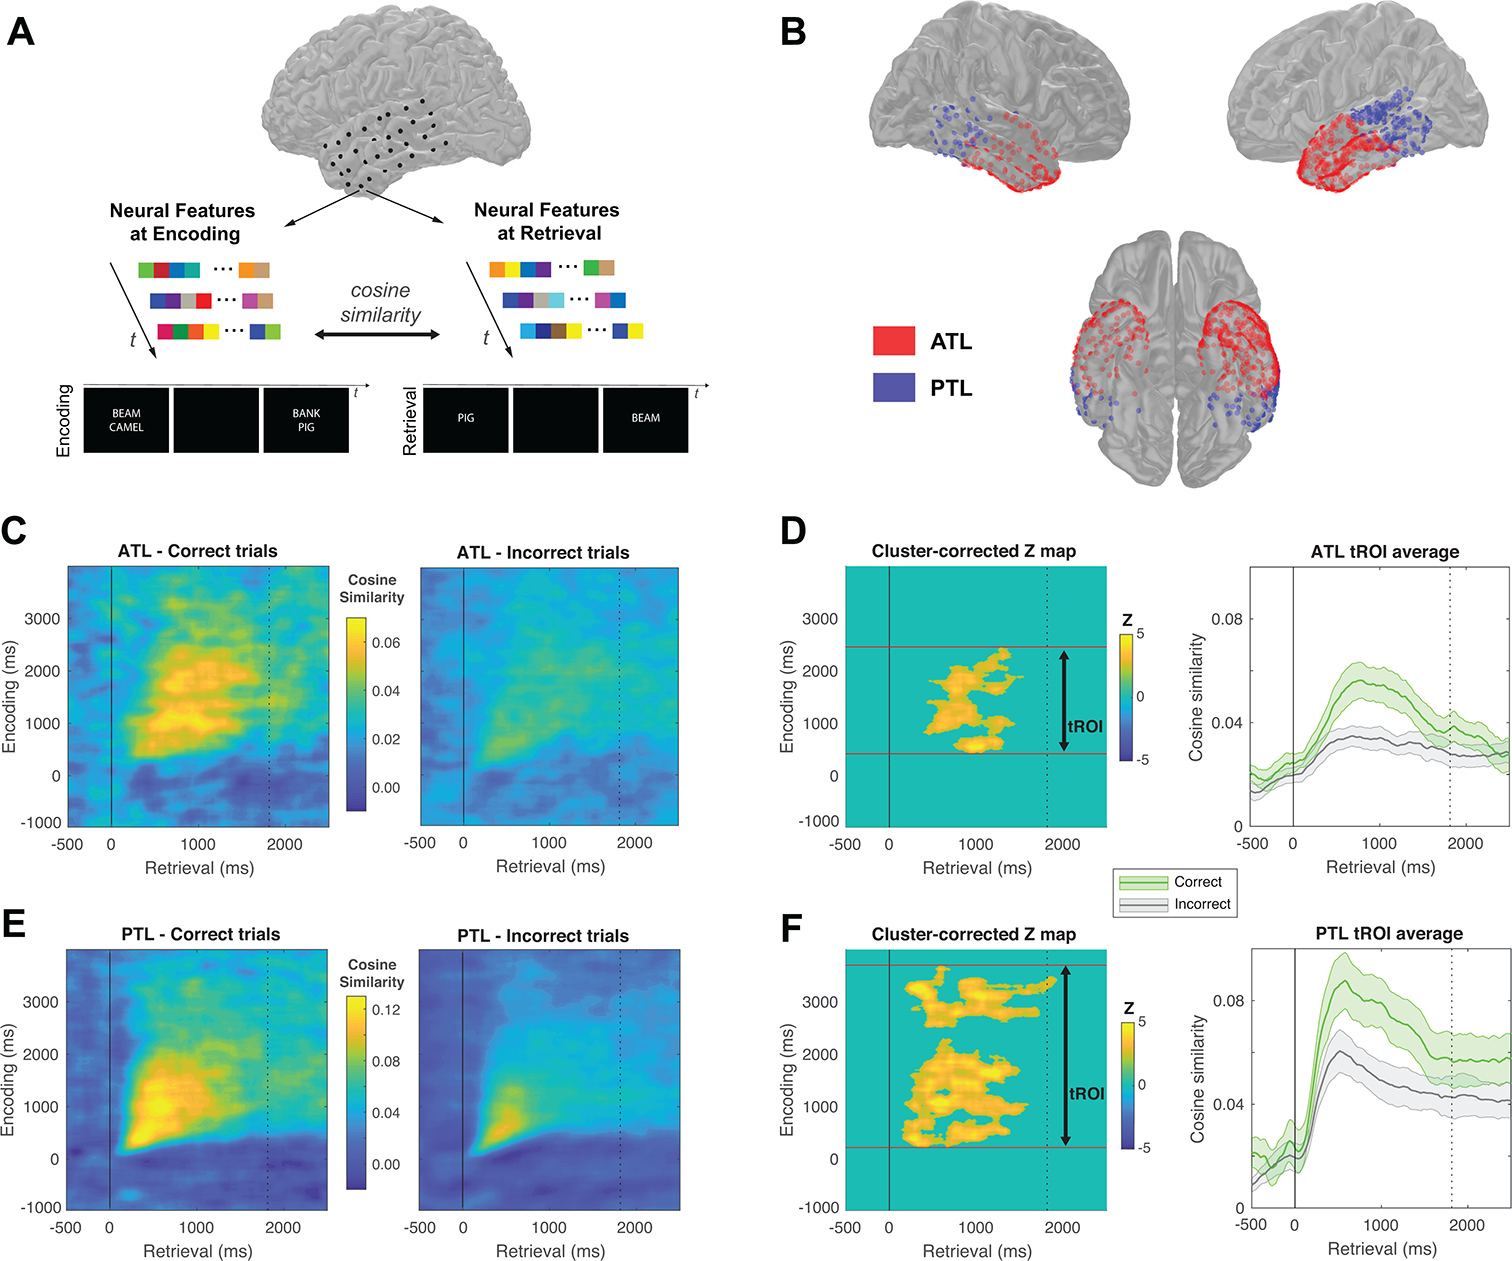
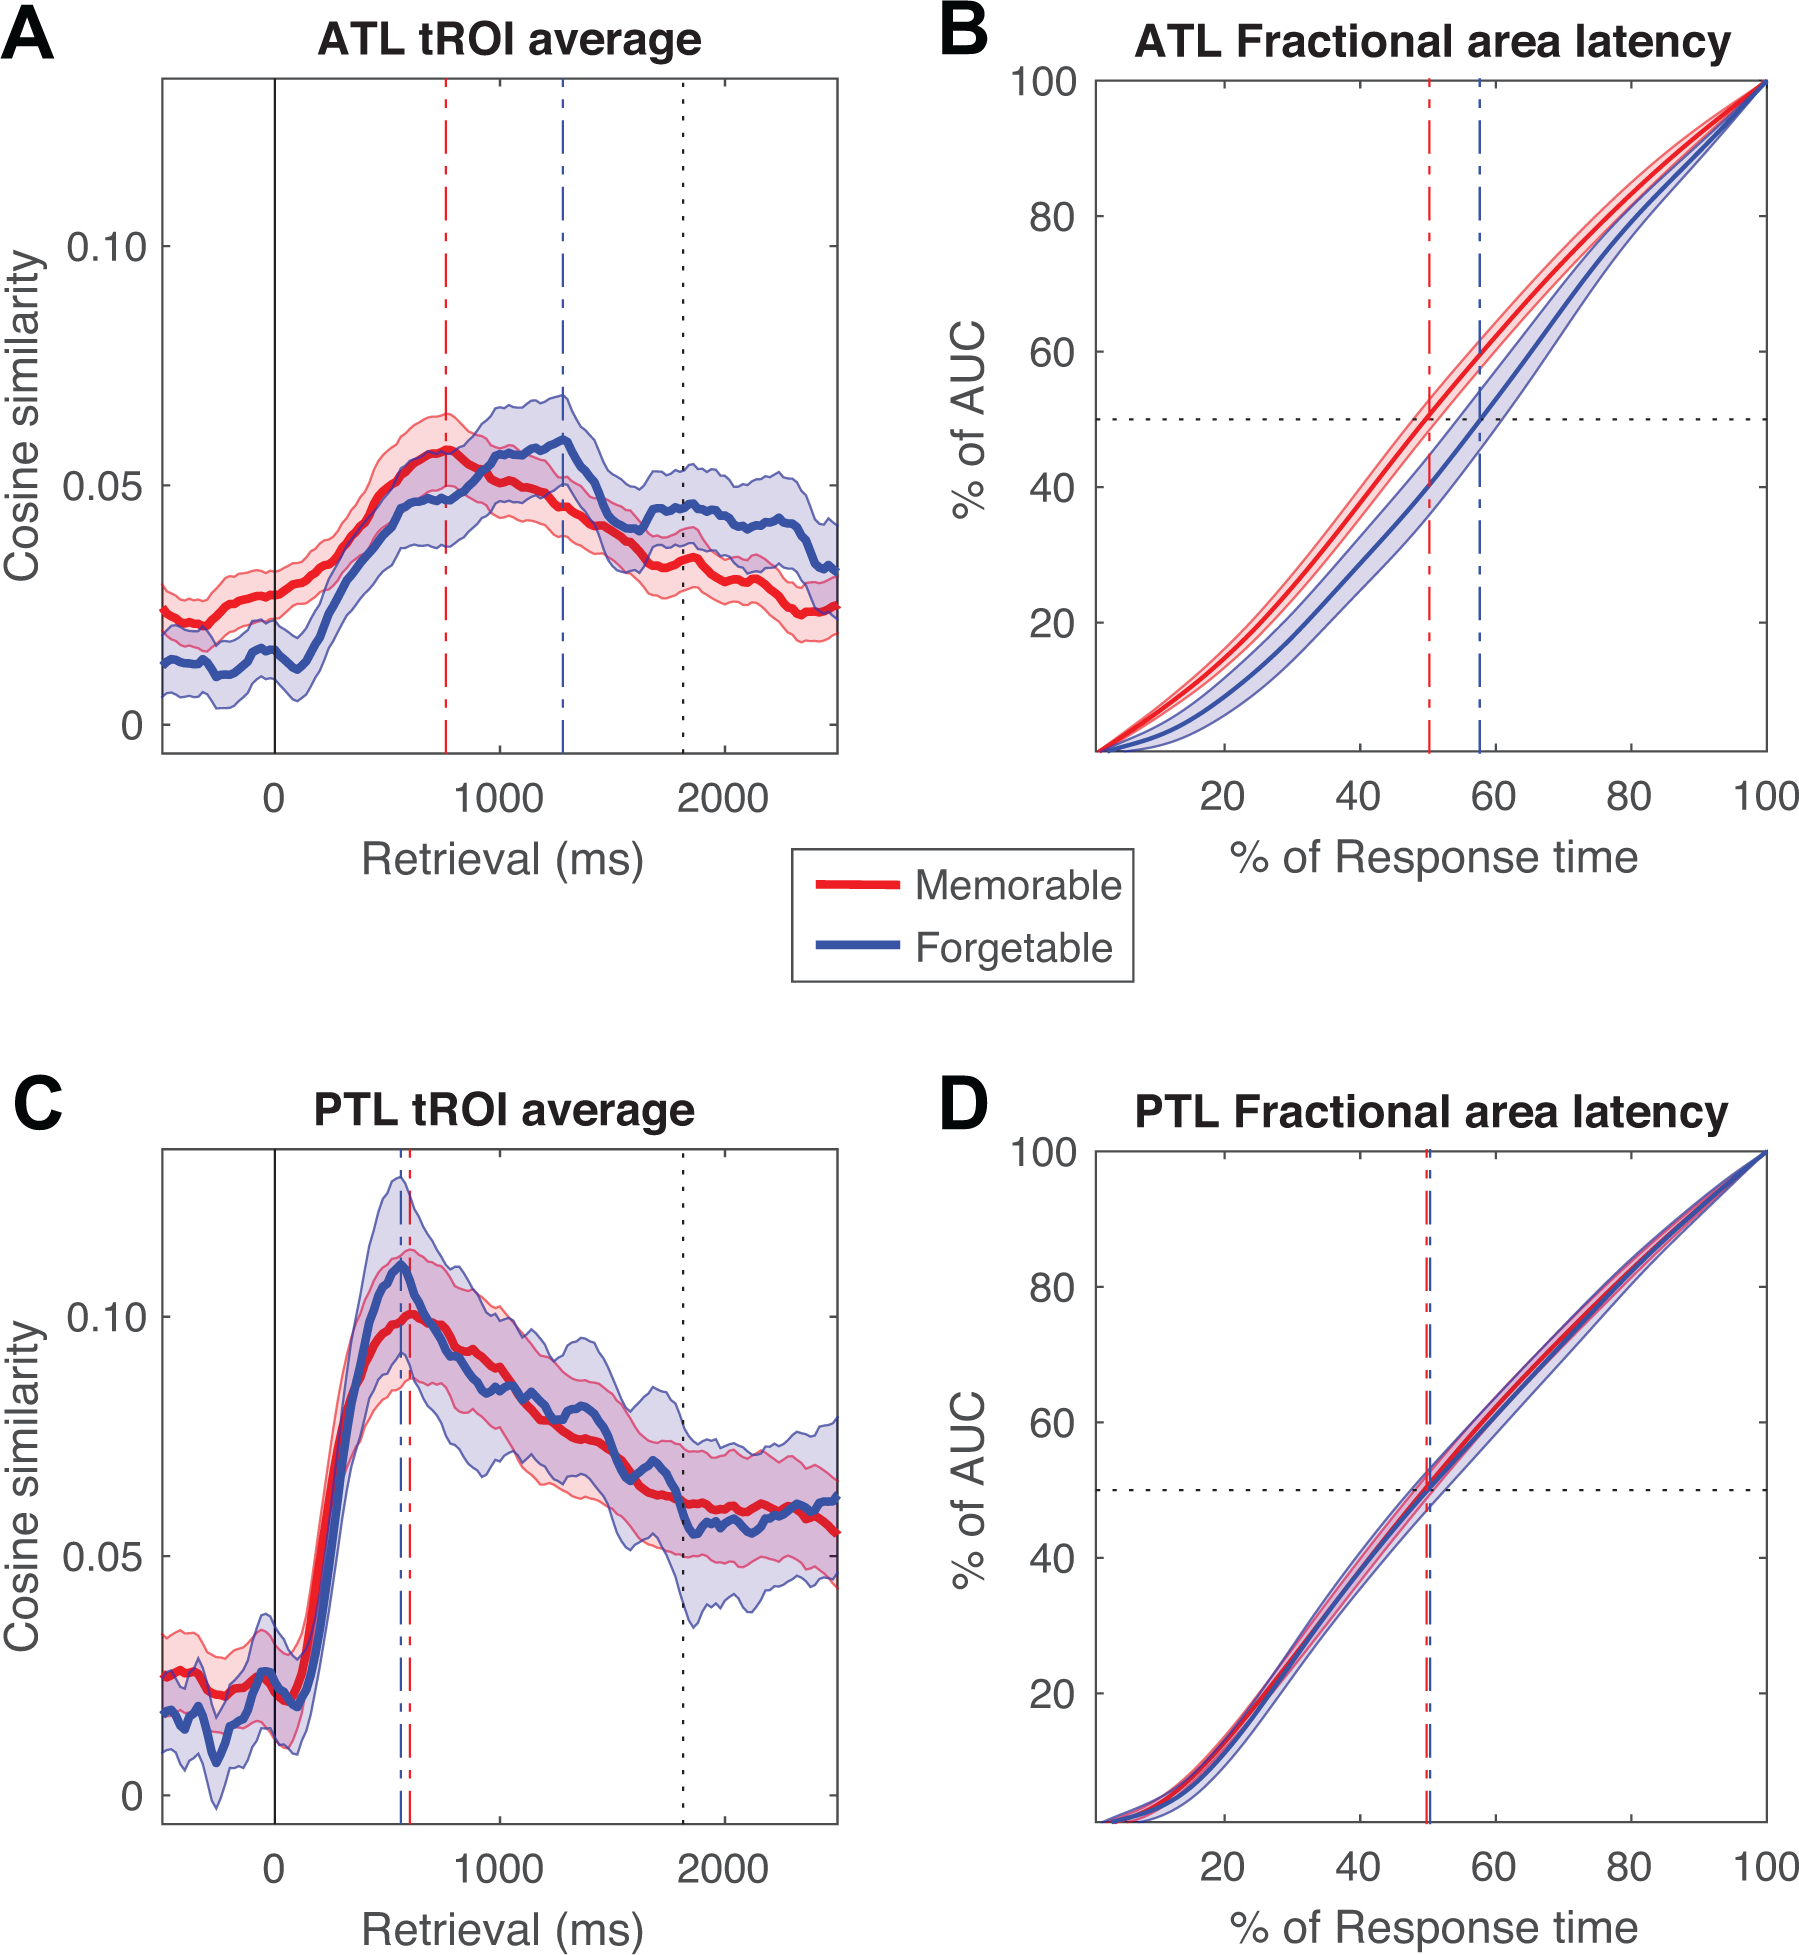
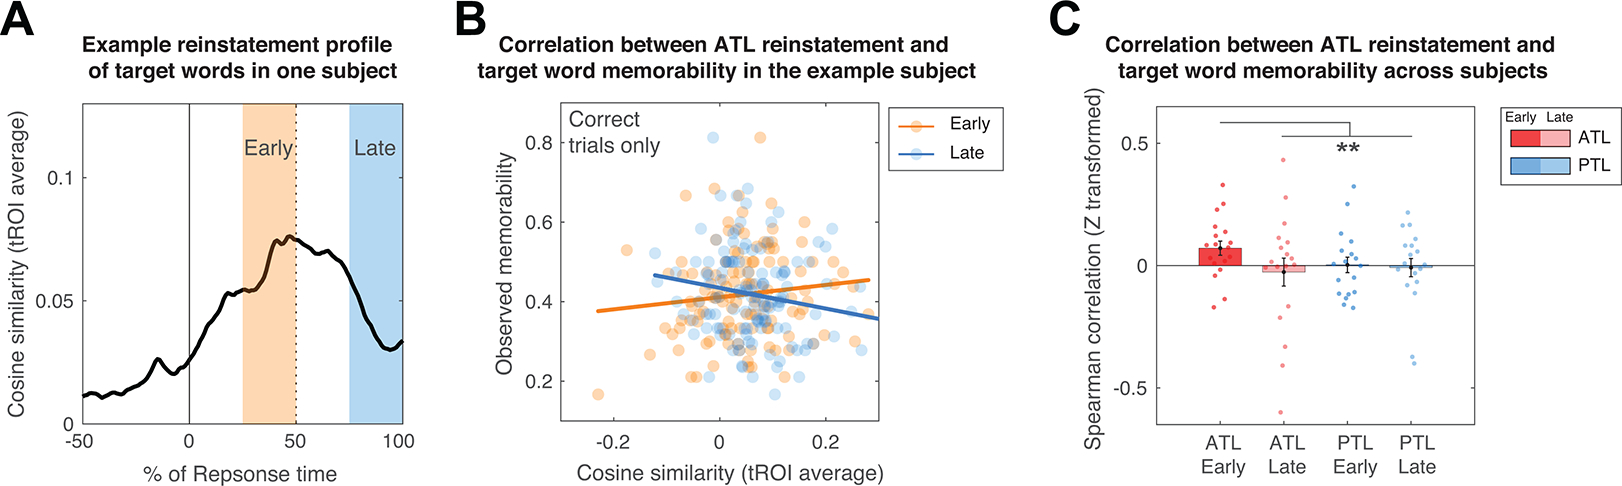
Despite large individual differences in memory performance, people remember certain stimuli with overwhelming consistency. This phenomenon is referred to as the memorability of an individual item. However, it remains unknown whether memorability also affects our ability to retrieve associations between items. Here, using a paired-associates verbal memory task, we combine behavioural data, computational modelling and direct recordings from the human brain to examine how memorability influences associative memory retrieval. We find that certain words are correctly retrieved across participants irrespective of the cues used to initiate memory retrieval. These words, which share greater semantic similarity with other words, are more readily available during retrieval and lead to more intrusions when retrieval fails. Successful retrieval of these memorable items, relative to less memorable ones, results in faster reinstatement of neural activity in the anterior temporal lobe. Collectively, our data reveal how the brain prioritizes certain information to facilitate memory retrieval.


Conflict of interest statement

Competing Interests

The authors declare no competing interests.

Figures

Extended Data Fig. 1
Extended Data Fig. 1. Memorable words are retrieved more quickly but lead to more intrusion errors across individuals.
(A) Participants’ values for Spearman correlation (Fisher’s z transformed) of the relationship between target words memorability and the response times of retrieved words and (B) average memorability of intruded words across participants in the iEEG sample. Each dot indicates a value from a single participant, with the whiskers indicating the within-participant standard error estimate across trials. The dot sizes are weighted by the overall within-participant standard error, with a larger size indicating smaller variability. The data are sorted by participant-specific estimates separately for (A) and (B). The random-effect mean estimates (in red) and their standard errors (in green) between participants are plotted at the bottom, which are identical to the bars shown in Fig. 3. Although there is a noisy estimate in (A) due to a low trial count (11 trials), inclusion or exclusion of this participant’s data does not substantially impact the mean estimate and significant testing across participants.
Extended Data Fig. 2
Extended Data Fig. 2. Correlation estimates (Fisher’s z transformed) for the association between trial-by-trial memorability of correctly retrieved items and neural reinstatement in the ATL and PTL.
(A) Data across participants in the ALT during the early retrieval time window. (B) Data across participants in the ALT during the late retrieval time window. (C) Data across participants in the PLT during the early retrieval time window. (D) Data across participants in the PLT during the late retrieval time window. Each dot indicates a value from a single participant, with the whiskers indicating the within-participant standard error estimate across trials. The dot sizes are weighted by the overall within-participant standard error, with a larger size indicating smaller variability. All data are sorted by participant-specific correlation estimates based on (A). The random-effect mean estimates (in red) and their standard errors (in green) across participants are marked at the bottom of each plot, which are identical to the bars shown in Fig. 6C.
Extended Data Fig. 3
Extended Data Fig. 3. Neural reinstatement effect stabilizes over around 10 trials.
(A) Resampling without replacement of the current dataset over 100 interactions with 2 trials per condition (i.e., 2 for correct and 2 for incorrect retrieval) per subject, (B) 4 trials per condition per subject, (C) 10 trials per condition per subject (10 trials), (D) and all available trials for included subjects. Intuitively, the more trials were included, the less noisy the data were. When the number of resampling trials reached to 10, the amount of variance in the estimate of mean neural reinstatement pattern for correct responses was similar to the data from all available trials from all included participants. This resampling analysis provides some analytical support for the trial count criterion we have imposed on the analysis.
Figure 1.
Figure 1.. Memorability of words is consistent across participants.
(A) In the paired associates task, six pairs of words are sequentially presented on the screen. After a ~20s distraction period with simple addition math questions, one word from each pair is presented as a retrieval cue in a random order. Participants are instructed to vocalize (iEEG sample) or type (online sample) the associated word following the onset of the cue word. Each iEEG session consisted of up to 25 lists of this encoding-distractor-recall procedure, while the online experiment consisted of 3 lists. (B) Split-half analyses demonstrate that the memorability of each word is consistent in both the iEEG sample and online sample of participants. top The blue lines reflect word recall performance ranked for a random split half (Group 1), whereas the orange lines show recall performance of the remaining half (Group 2) ranked by data from Group 1 (both averaged across 5,000 iterations). The grey line shows an estimation of chance, by shuffling the rank orders of Group 2 (surrogate data). bottom The mean of the split-half correlation coefficients across 5000 iterations is significantly larger than the surrogate (null) distributions in both the iEEG sample (mean ρz = 0.19, bootstrapped 95% confidence interval, CI: [0.01, 0.40], p = 0.035, one-tailed) and in the online Sample (mean ρz = 0.23, bootstrapped 95% CI: [0.06, 0.44], p = 0.011, one-tailed). The red lines indicate the mean of the split-half correlation coefficients across 5000 iterations, whereas the black dashed lines indicate the mean of the surrogate data.
Figure 2.
Figure 2.. Modelling memorability of target words in arbitrary verbal associations based on matching strength of words.
(A) The likelihood that a cue word, Qj (j = 1 to M), leads to the retrieval of a target word, Ii (I = 1 to N), is a function of the semantic similarity, or matching strength between Qj and Ii (see Methods). We modelled the semantic similarity between words using the vectorized word features based on GloVe values. Memorability of the target word Ii, Mem(Ii), can thus be approximated by the aggregated likelihood of successful retrieval cued by any arbitrary words in the available semantic space. (B) The predicted memorability estimates based on our computational model correlates with the observed memorability in both the iEEG sample (left; ρ = 0.20, 95% CI: [0.09, 0.30], p = 0.00057, two-tailed) and in the online sample (right; ρ = 0.21, 95% CI: [0.10, 0.31], p = 0.00029, two-tailed). Solid lines represent linear fits of the data, and the dashed lines represent 95% confidence interval of the linear fit.
Figure 3.
Figure 3.. Memorable words are retrieved more quickly but lead to more intrusion errors.
(A) Memorability of each responded word is significantly correlated with the response time required to vocalize the word across participants (ρz =−0.06, bootstrapped 95% CI: [−0.09, −0.03], p = 0.0004, two-tailed, n= 27). Each point represents the Spearman correlation (Fisher’s z transformed) observed in each iEEG participant. (B) The average memorability of intruded words across participants in the iEEG sample (0.366, bootstrapped 95% CI: [0.357, 0.373], n= 21) is significantly larger than the median memorability of the entire word pool (0.353; bootstrapped p = 0.0016, two-tailed; complementary one-sample t-test: t(20) = 3.25, p = 0.0040, two-tailed, requivalent = 0.59 [0.21, 0.81]). Each dot indicates average memorability value from a single subject. In both panels, the bar and error bar represent bootstrapped mean and standard error across participants (random effect). Extended Data Fig. 1 summarizes the same data with within-participant variability shown in a forest plot.
Figure 4.
Figure 4.. Neural reinstatement during memory retrieval.
(A) For every temporal window during encoding and retrieval, we construct a feature vector using the pattern of oscillatory power across electrodes. We calculate neural reinstatement as the cosine similarity between every brain state vector. (B) Electrode coverage in the ATL (n = 19) and PTL (n = 18) across participants who met inclusion criteria. (C) and (E) show reinstatement patterns for the ATL and PTL, respectively, for correct and incorrect recall trials time-locked to recall vocalization. Note the different colour scales used for plotting due to different reinstatement levels across brain regions. Significant differences in reinstatement between correct and incorrect trials in these regions were evaluated based on cluster-based permutation tests (see Methods). (D) and (F) show the average neural reinstatement during the temporal region of interest (tROI) in the encoding phase across different retrieval time points for the ATL and PTL, respectively. The response time averaged from participants’ median response times across trials is plotted as a dashed line. Post-hoc comparisons confirmed that the neural reinstatement values averaged across encoding tROIs and the retrieval period from the probe onset to the median response time were significantly higher in the correct, relative to the incorrect, trials in both the ATL (t(18) = 3.39, p = 0.0032, two-tailed, requivalent = 0.62 [0.23, 0.84]) and the PTL (t(17) = 4.23, p = 0.00056, two-tailed, requivalent = 0.72 [0.38, 0.89]).
Figure 5.
Figure 5.. Neural reinstatement is faster for memorable items in the anterior temporal lobe.
(A) Temporal profiles of ATL neural reinstatement during the temporal region of interest (tROI) in the encoding phase across different retrieval time points for correct memorable (red) and forgettable (blue) target words. The peak timepoints of the average reinstatement neural profiles are marked as a dashed vertical line in respective colours and the response time averaged from participants’ median response time across trials is plotted as a black dashed line. The solid lines at 0 indicate cue onset. (B) Fractional area measured as a function of response time (normalized by the average response time of participants) in the ATL with the 50% fractional area latency marked by the dashed horizontal grey line. (C) PTL neural reinstatement profiles for correct memorable (red) and forgettable (blue) target words, similar to (A). (D) Fractional area measured as a function of response time for neural reinstatement profiles in the PTL, similar to (C). All error bars (areas) indicate bootstrapped standard errors across participants across 5000 iterations. Note, measures of fractional area latency and peak latency are complementary to each other. In general, memorable targets tend to be reinstated earlier during the retrieval time window in the ATL (bootstrapped means for 50% fractional area latency: 905 ms vs. 1050 ms, n = 19, bootstrapped 95% CI of latency difference: [−300 ms, −20 ms], p = 0.040, two-tailed; jack-knife peak latency: 765 ms vs. 1264 ms, t(18) = 2.26, p = 0.036, two-tailed, requivalent = 0.47 [0.02, 0.76]).
Figure 6.
Figure 6.. Target word memorability correlates with neural reinstatement in the anterior temporal lobe during early memory retrieval.
(A) An example reinstatement temporal profile normalized by the trial- specific response time. Early and late time windows are respectively defined by the 25% to 50% and the 75% to 100% duration of the trial-specific response time. (B) Trial-level correlation between the neural instatement pattern and target word memorability from an example subject. Each dot represents trial level data, and the lines indicate linear fits of the data. (C) Across participants, the spatial and temporal profile of the correlation between the neural instatement pattern and target word memorability on average is captured by a contrast that predicts the strongest correlation in the ATL during the early time window as compared with other conditions (see Results and Methods for details). Each dot indicates the standardized correlation value from a single subject. Participants’ data along with within-participant variability of the correlation measures can be seen in Extended Data Fig. 2. **Bootstrapped p = 0.0016, one-tailed in a focal contrast analysis (complementary t contrast: t(17) = 2.88, p = 0.0050, one-tailed, requivalent = 0.57 [0.14, 0.82]) with a set of weights, +3, −1, −1, −1, for ATL-early, ATL-late, PTL-early, and PTL-late, respectively.

References

    1. Unsworth N Individual differences in long-term memory. Psychol. Bull 145, 79–139 (2019). - PubMed
    1. Salthouse TA Item analyses of memory differences. J. Clin. Exp. Neuropsychol 39, 326–335 (2017). - PMC - PubMed
    1. Rubin DC Memorability as a measure of processing: A unit analysis of prose and list learning. J. Exp. Psychol. Gen 114, 213–238 (1985). - PubMed
    1. Bainbridge WA, Isola P & Oliva A The intrinsic memorability of face photographs. J. Exp. Psychol. Gen 142, 1323–1334 (2013). - PubMed
    1. Bainbridge WA, Dilks DD & Oliva A Memorability: A stimulus-driven perceptual neural signature distinctive from memory. Neuroimage 149, 141–152 (2017). - PubMed

Publication types