. 2020 Apr;2(4):307-317.
doi: 10.1038/s42255-020-0190-0. Epub 2020 Apr 13.

Exercise rejuvenates quiescent skeletal muscle stem cells in old mice through restoration of Cyclin D1

Affiliations

Exercise rejuvenates quiescent skeletal muscle stem cells in old mice through restoration of Cyclin D1

Jamie O Brett et al. Nat Metab. 2020 Apr.

Abstract

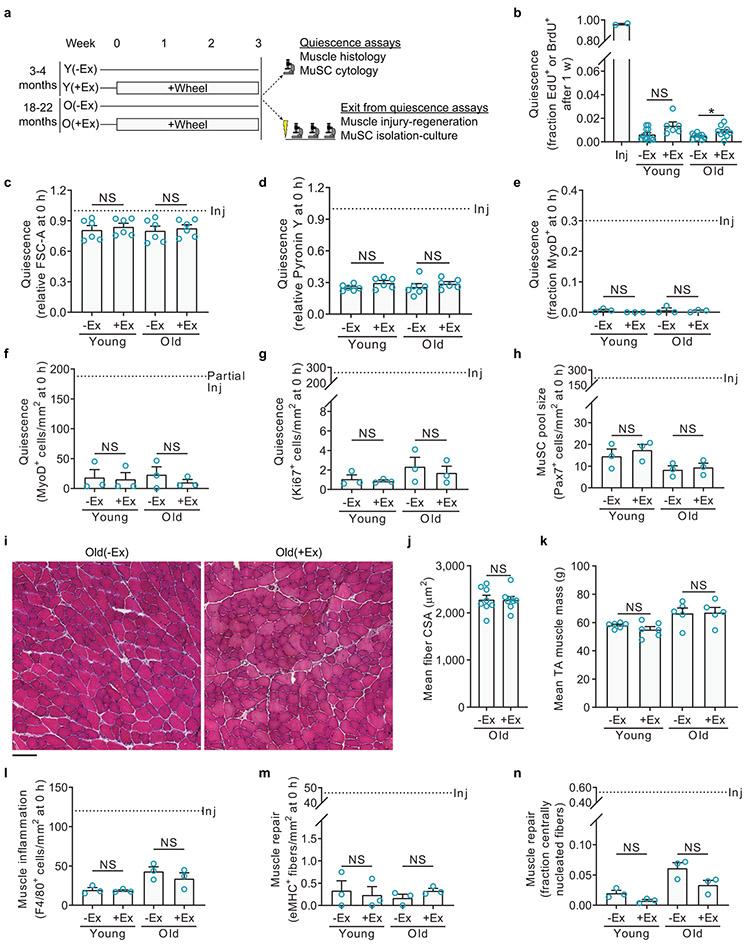
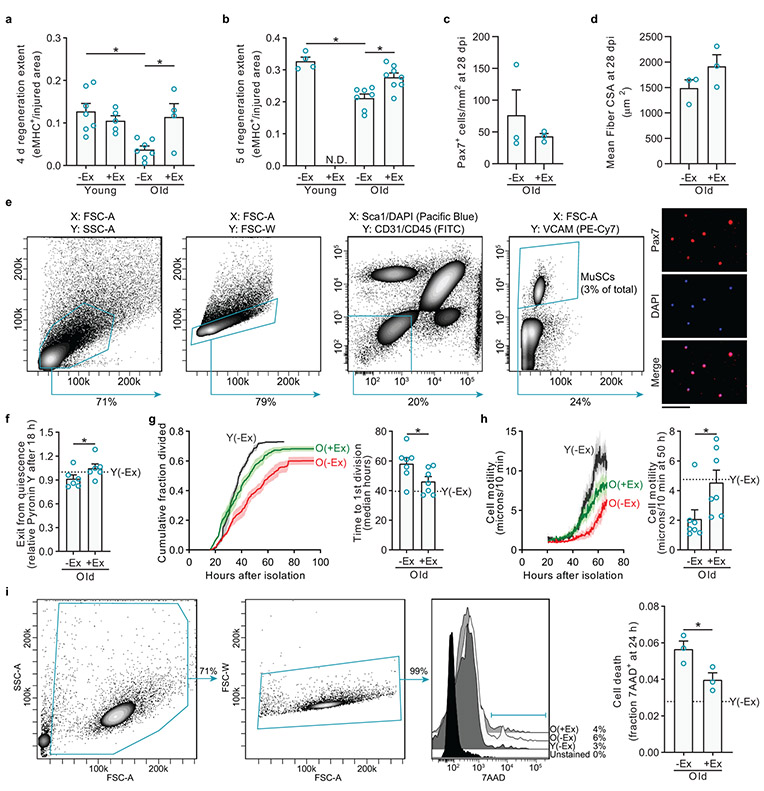
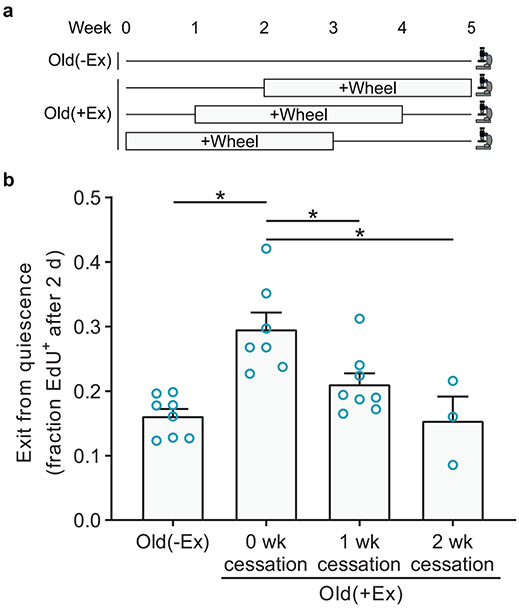
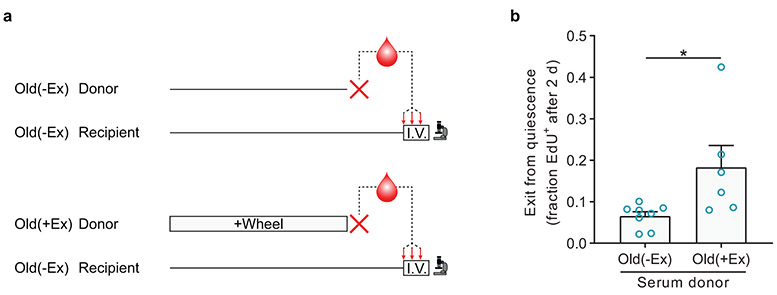
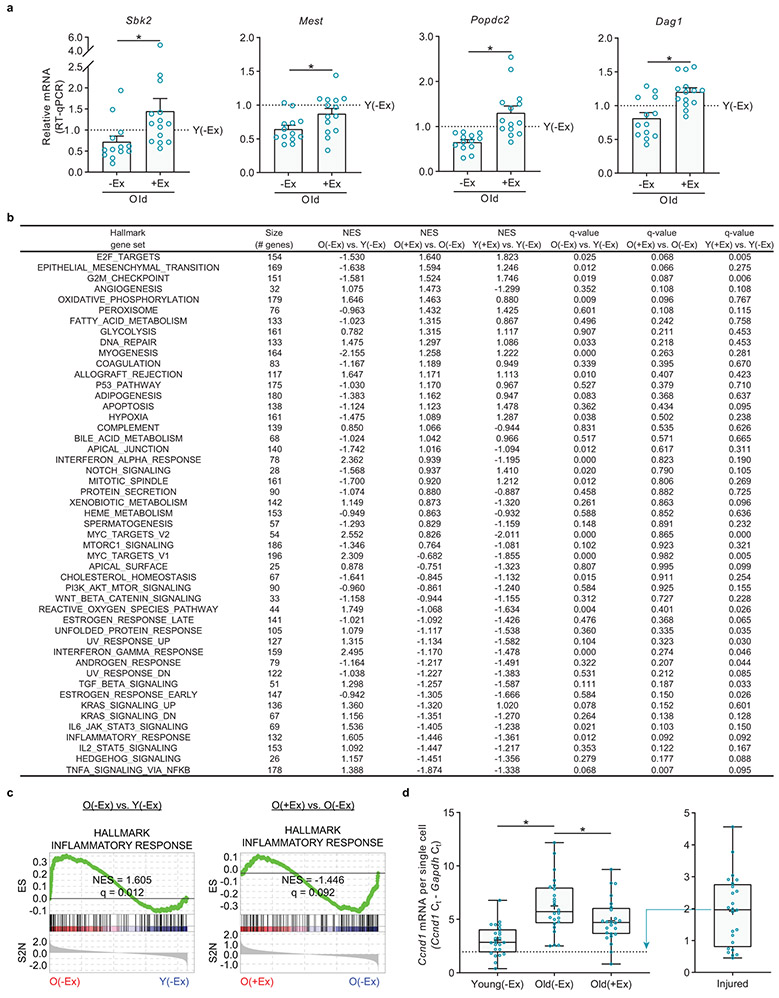
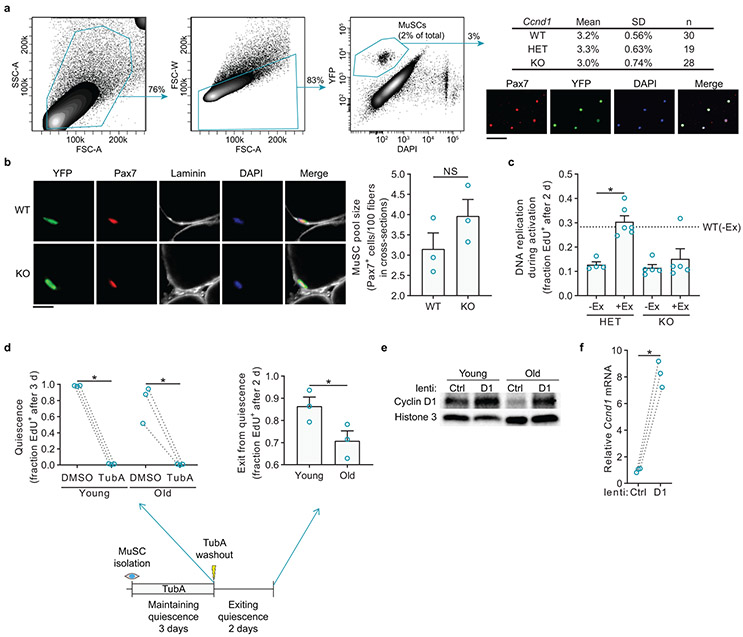
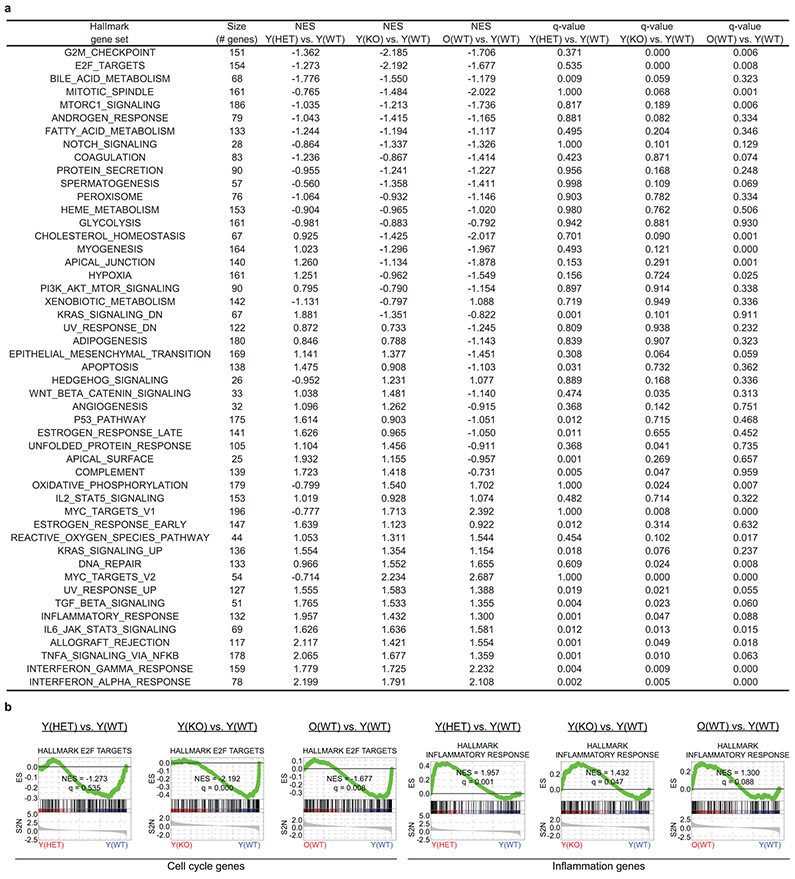
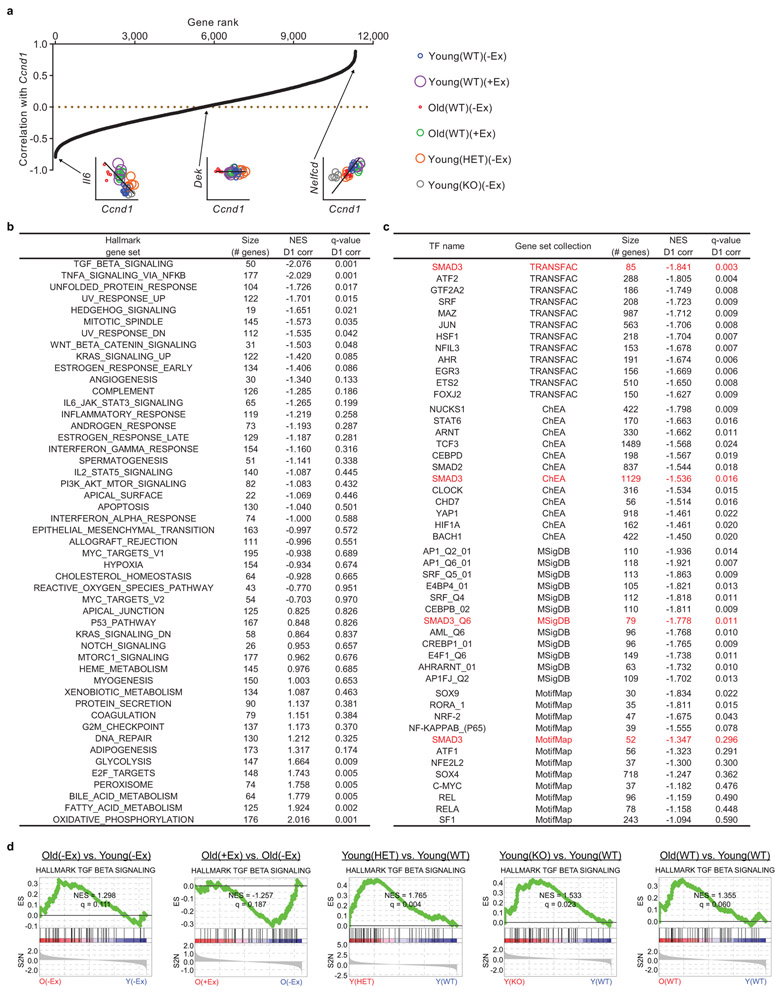
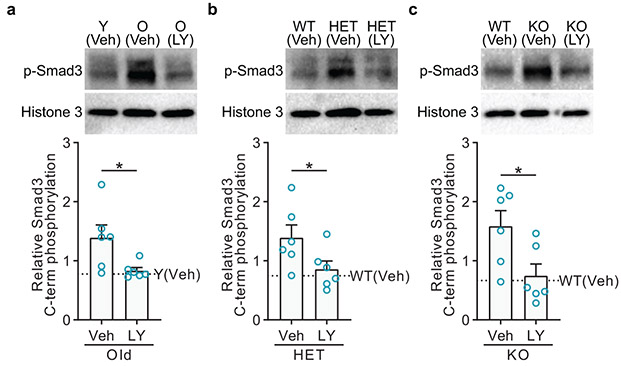
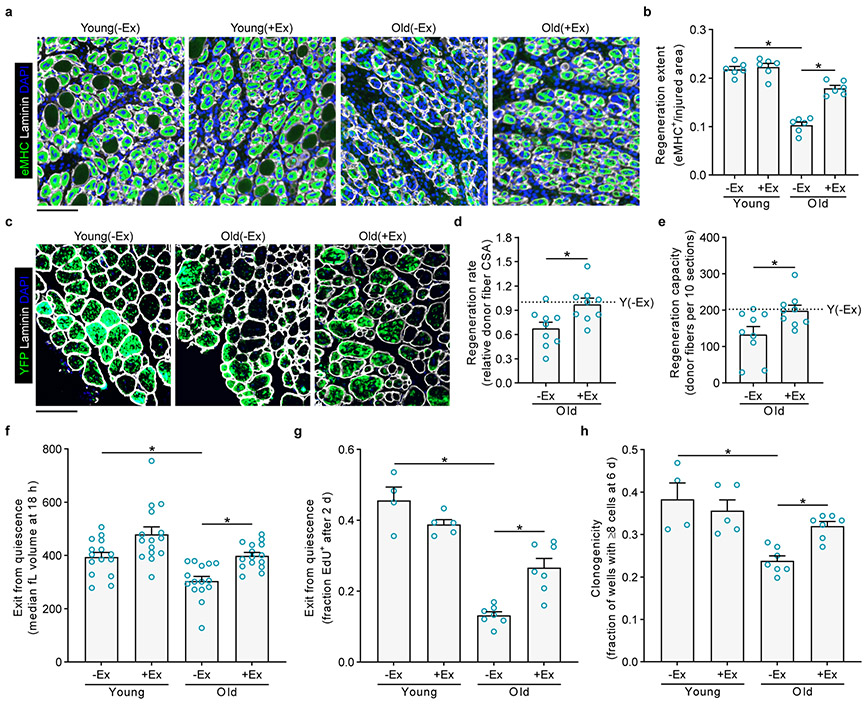
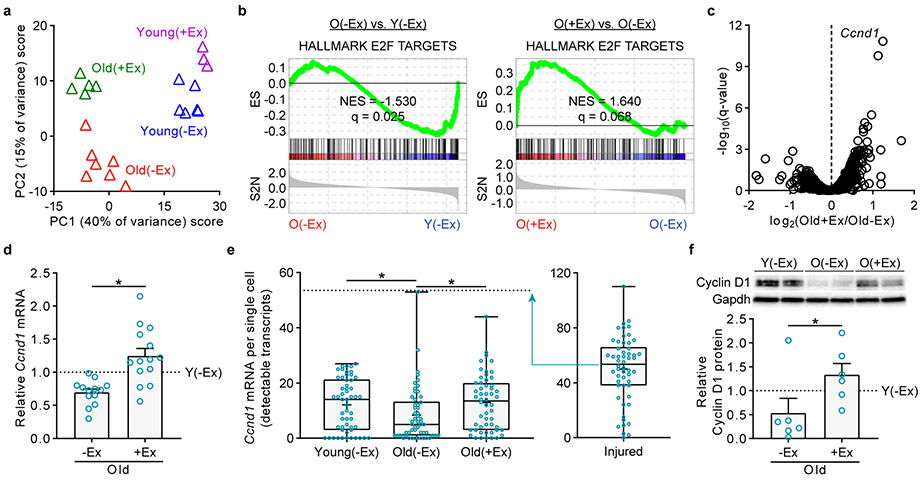
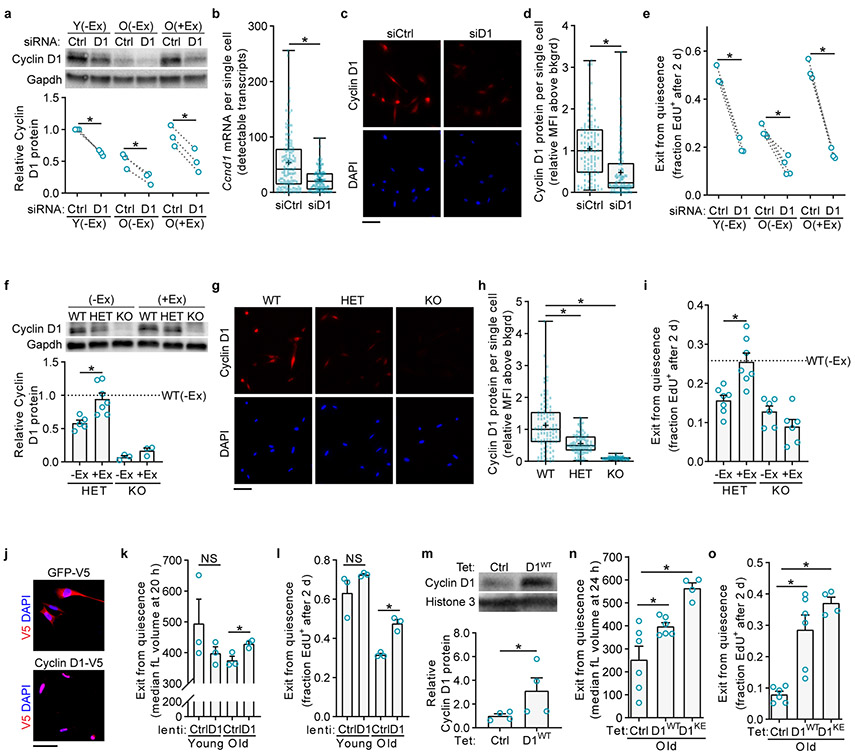
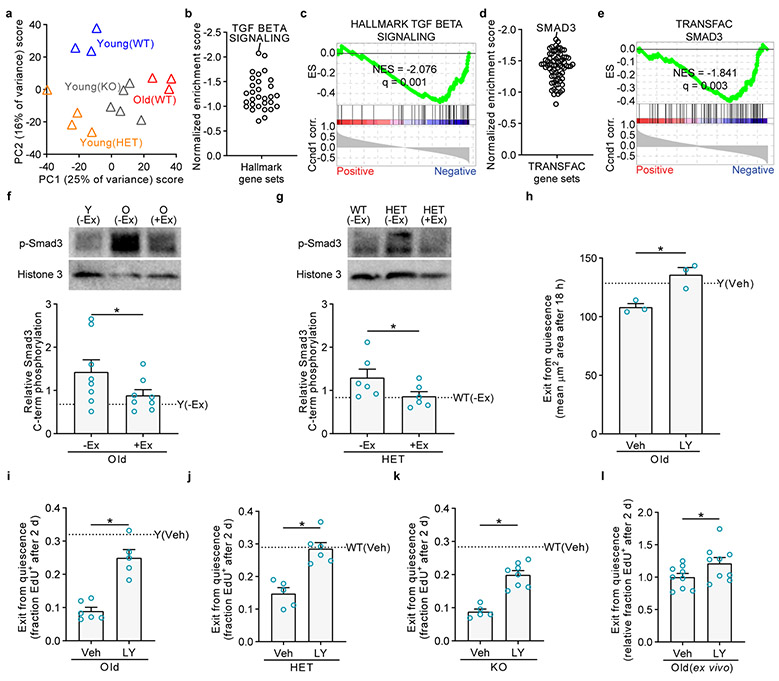
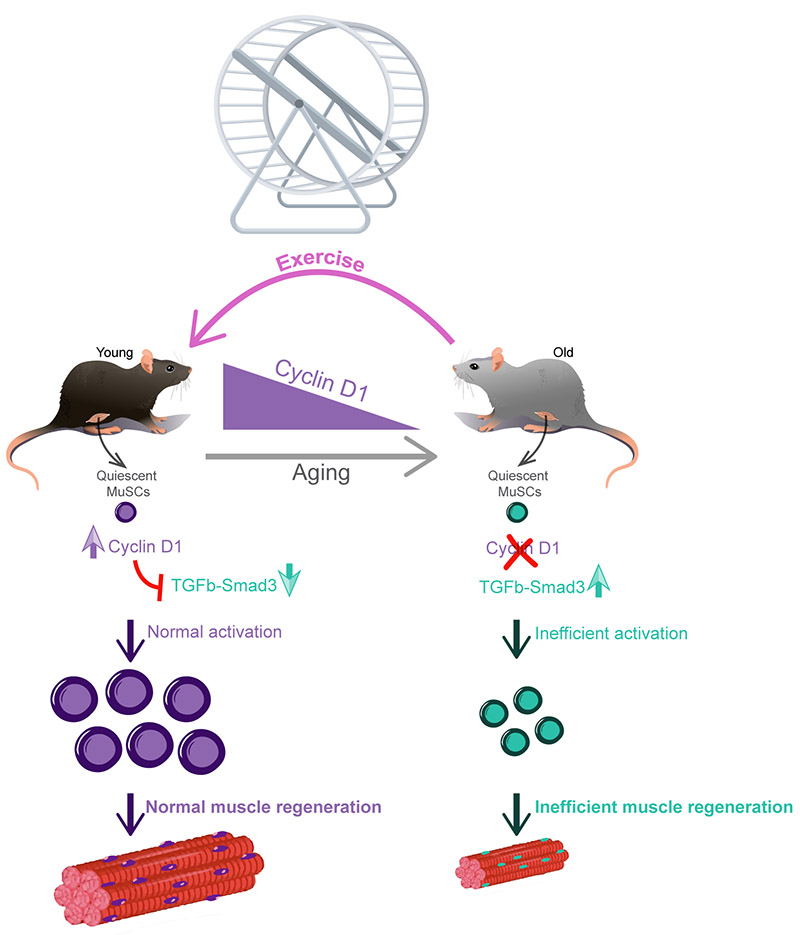
Aging impairs tissue repair. This is pronounced in skeletal muscle, whose regeneration by muscle stem cells (MuSCs) is robust in young adult animals but inefficient in older organisms. Despite this functional decline, old MuSCs are amenable to rejuvenation through strategies that improve the systemic milieu, such as heterochronic parabiosis. One such strategy, exercise, has long been appreciated for its benefits on healthspan, but its effects on aged stem cell function in the context of tissue regeneration are incompletely understood. Here we show that exercise in the form of voluntary wheel running accelerates muscle repair in old animals and improves old MuSC function. Through transcriptional profiling and genetic studies, we discovered that the restoration of old MuSC activation ability hinges on restoration of Cyclin D1, whose expression declines with age in MuSCs. Pharmacologic studies revealed that Cyclin D1 maintains MuSC activation capacity by repressing TGFβ signaling. Taken together, these studies demonstrate that voluntary exercise is a practicable intervention for old MuSC rejuvenation. Furthermore, this work highlights the distinct role of Cyclin D1 in stem cell quiescence.


Figures

Extended Data Fig. 1.
Extended Data Fig. 1.. Effects of voluntary wheel running on muscle.
a, Non-strenuous voluntary exercise by wheel running in mice. Young or old mice are provided access to a freely rotating wheel or to a locked wheel as a control. Three weeks later, muscles are either assayed with MuSCs in their quiescent state, without injury or MuSC isolation, or assayed for MuSC exit from quiescence, induced by experimental injury or MuSC isolation into culture. b, Throughout the final week of locked wheel (−Ex) or free wheel (+Ex) access, thymidine analog (EdU or BrdU) was administered continuously in the drinking water. MuSCs were FACS-isolated and immediately fixed for EdU staining. For comparison, also shown are the results from young mice receiving muscle injury at the time of onset of labeling (n=12 for Y(−Ex), 6 for Y(+Ex), 9 for O(−Ex), 9 for O(+Ex), and 2 for Inj mice). c, FACS-isolated MuSCs were assayed for cell size based on forward scatter in flow cytometry. For comparison, also shown are results from young muscles injured three days prior to analysis. Data were normalized to the mean injured level in each experiment (n=5 for Y(−Ex), 5 for Y(+Ex), 6 for O(−Ex), 6 for O(+Ex), and 3 for Inj mice). d, FACS-isolated MuSCs were assayed for RNA content based on Pyronin Y intensity in flow cytometry. For comparison, also shown are results from young muscles injured three days prior to analysis. Data were normalized to the mean injured level in each experiment (n=5 for Y(−Ex), 5 for Y(+Ex), 6 for O(−Ex), 6 for O(+Ex), and 3 for Inj mice). e, FACS-isolated MuSCs were assayed for MyoD expression based on immunocytochemistry. For comparison, also shown are results from young muscles partially injured three days prior to analysis (n=3 for Y(−Ex), 3 for Y(+Ex), 3 for O(−Ex), 3 for O(+Ex), and 1 for Inj mice). f-h, TA muscles were sectioned and assayed for MyoD-expressing cells (f), Ki67-expressing cells (g), and Pax7-expressing cells (h) by immunohistochemistry. For comparison, also shown are results from young muscles injured seven days prior to analysis (n=3 mice per group). i, TA muscle cross-sections were stained with H&E. Representative images (quantified in (j) are shown). j, The mean CSA of myofibers was quantified (n=8 mice per group). k, For each mouse, left and right TA muscles were isolated and their weights averaged (n=6 for Y(−Ex), 6 for Y(+Ex), 5 for O(−Ex), and 5 for O(+Ex) mice). l-n, TA muscles were sectioned and assayed for macrophages expressing F4/80 (l), regenerating myofibers expressing eMHC (m), and regenerating myofibers with central nuclei (n) by immunohistochemistry. For comparison, also shown are results from muscles injured seven days prior to analysis (n=3 mice per group). Scale bar in a, 100 μm. Data are summarized with mean + s.e.m. NS, not significant; *P<0.05; two-tailed Welch’s t-test in b-h, j-n.
Extended Data Fig 2.
Extended Data Fig 2.. Exercise improves multiple aspects of old MuSC regenerative ability.
a-d, Exercise and muscle injury were performed as in Fig. 1a. After either four days (a), five days (b) or twenty-eight days (c-d), muscles were isolated and stained to examine regeneration. a-b, Muscles were sectioned and assayed for eMHC+ myofibers (a, n=7 for Y(−Ex), 5 for Y(+Ex), 7 for O(−Ex), and 4 for O(+Ex) mice. b, n=4 for Y(−Ex), 7 for O(−Ex), and 8 for O(+Ex) mice. Y(+Ex) at five days was not done (N.D.)). c-d, Twenty-eight days post-injury (dpi), the mean cross-sectional areas (CSA) of myofibers (c) and the number of Pax7-expressing cells (d) were quantified (n=3 mice per group). e, Gating strategy for FACS isolation of MuSCs, following a published protocol,. Purity of isolated MuSCs is >98% as assessed by routine staining for Pax7 of cells fixed one hour after plating. f, FACS-isolated MuSCs were cultured for eighteen hours and then analyzed for RNA content by flow cytometry based on Pyronin Y staining (n=6 mice per group). g, FACS-isolated MuSCs were tracked by time-lapse microscopy to determine time to first division (n=7 for O(−Ex), 7 for O(+Ex), and 5 for Y(−Ex) mice). h, FACS-isolated MuSCs were tracked by time-lapse microscopy to determine the distance migrated by each cell between serial images (n=7 for O(−Ex), 7 for O(+Ex), and 5 for Y(−Ex) mice). i, FACS-isolated MuSCs were cultured for one day and then stained with 7AAD to determine viability by flow cytometry. Shown is the gating strategy for analysis and the quantification of the fraction of dead cells (n=3 mice per condition). Scale bar in e, 50 μm. Data are summarized with mean + s.e.m. *P<0.05; one-tailed Welch’s t-test in a-d, f-i.
Extended Data Fig. 3.
Extended Data Fig. 3.. The exercise-induced improvement in old MuSC activation gradually subsides after exercise cessation.
a, Mice were given no access or free access to a running wheel, followed by wheel removal for zero, one, or two weeks. The onset of exercise was staggered so that MuSC isolation was performed at the same time for all groups. b, FACS-isolated MuSCs were cultured continuously in EdU to assess S-phase progression (n=8 for O(−Ex), 7 for O(+Ex)(0 wk), 8 for O(+Ex)(1 wk), and 3 for O(+Ex)(2 wk) mice). Data are summarized with mean + s.e.m. *P<0.05; two-tailed Welch’s t-test in b.
Extended Data Fig. 4.
Extended Data Fig. 4.. The exercise-induced improvement in old MuSC activation is transferable through serum.
a, Old recipient mice that had never exercised received three consecutive daily tail-vein injections with serum collected from old non-exercising or exercising mice. MuSCs were isolated from recipient mice one day after the last injection. b, FACS-isolated MuSCs were cultured continuously in EdU to assess S-phase progression (n=8 recipient mice for O(−Ex), comprising 4, 3, and 1 recipients for three different serum pools, and n=6 recipient mice for O(+Ex), comprising 3, 2, and 1 recipients for three different serum pools). Data are summarized with mean + s.e.m. *P<0.05; two-tailed Mann-Whitney U-test in b.
Extended Data Fig. 5.
Extended Data Fig. 5.. Transcriptional effects of aging and exercise in quiescent MuSCs.
a, RT-qPCR in MuSCs from mice independent of those used in the RNA-Seq experiment. Ct values were normalized first to the mean of Gapdh, Hprt, and Actb1 and then to the mean Y(−Ex) level in each experiment, with Y(−Ex) shown as a dotted line at relative expression 1.0 for comparison (n=13 for O(−Ex), 14 for O(+Ex), and 13 for Y(−Ex) mice). b, GSEA results for the Hallmark gene sets in comparisons of RNA-Seq profiles for O(−Ex) vs. Y(−Ex), O(+Ex) vs. O(−Ex), and Y(+Ex) vs. Y(−Ex) MuSCs. Gene sets are in descending order based on the O(+Ex) vs. O(−Ex) NES. c, Enrichment plots for the INFLAMMATORY RESPONSE gene set. d, Single-cell RT-qPCR for Ccnd1 in freshly isolated MuSCs. For comparison, also shown are results for young MuSCs isolated three days after injury. The pairs on each chip were O(−Ex) vs. O(+Ex) and Y(−Ex) vs. Injured (n=24 cells from one mouse in each group). Data are summarized with mean and s.e.m. in a, box-and-whisker plots (bottom whisker, min; box bottom, 25th percentile; box middle, median; box top, 75th percentile; top whisker, max; “+”, mean) in d. NES, normalized enrichment score in b, c; ES, running enrichment score; S2N, GSEA Signal2Noise ranking metric in c. *P<0.05; two-tailed Welch’s t-test in a, d.
Extended Data Fig. 6.
Extended Data Fig. 6.. Characterization of Cyclin D1 reduction and expression in MuSCs.
a, Gating strategy for FACS isolation of YFP+ MuSCs after tamoxifen administration to transgenic mice. Shown are MuSC yields in terms of the percentage of size- and doublet-gated cells that are YFP+DAPI; NS, WT vs. HET and WT vs. KO (n values represent individual mice). Purity of isolated MuSCs is >94% or >98% as assessed by routine staining and quantification of YFP or Pax7, respectively, of cells fixed one hour after plating. b, TA muscles were isolated from twelve-month-old mice that had received tamoxifen injections at three months of age. Muscle sections were stained for Pax7 to identify MuSCs, YFP to identify recombined cells, and laminin to delimit muscle fibers and MuSCs from the interstitium. No MuSCs or YFP+ cells were identified in the interstitium, and no YFP+ cells were Pax7. The MuSC pool was quantified by counting Pax7+ cells in sections (n=3 mice per group). c, FACS-isolated MuSCs were cultured continuously in the presence of EdU to assess S-phase progression (n=4 for HET(−Ex), 6 for HET(+Ex), 5 for KO(−Ex), 5 for KO(+Ex), and 6 for WT(−Ex) mice). d, To confirm maintenance of ex vivo quiescence by TubA, MuSCs were kept in culture for three days either in quiescence (with TubA) or during activation (with DMSO vehicle) in the continuous presence of EdU and then fixed for analysis. MuSCs were then released for two days in the presence of EdU by removing TubA. MuSCs were then fixed for analysis of exit from quiescence (n=3 mice per condition). e, MuSCs were infected as in Fig. 3j for three days and then harvested for Western blot. Each lane represents a pool of three to six mice split into the two infection conditions. f, MuSCs infected as in Fig. 3j were harvested for RT-qPCR analysis (n=3 mice per group). Scale bar in a, 50 μm, in b, 10 μm. Data are summarized with mean + s.e.m. NS, not significant; *P<0.05; two-tailed Welch’s t-test in a-c, one-tailed Welch’s t-test in d, one-tailed ratio paired t-test in f.
Extended Data Fig. 7.
Extended Data Fig. 7.. Gene sets altered by Cyclin D1 reduction and by aging in MuSCs.
a, GSEA results for the Hallmark gene sets in comparisons of RNA-Seq profiles for Y(HET) vs. Y(WT), Y(KO) vs. Y(WT), and O(WT) vs. Y(WT) MuSCs. Gene sets are in ascending order based on the mean NES. b, Enrichment plots for gene sets representing cell cycle genes (E2F TARGETS) and inflammation genes (INFLAMMATORY RESPONSE). NES, normalized enrichment score in a, b; ES, running enrichment score; S2N, GSEA Signal2Noise ranking metric in b.
Extended Data Fig. 8.
Extended Data Fig. 8.. TGFβ-Smad3 activity is anti-correlated with Ccnd1 in MuSCs.
a, For each gene in the RNA-Seq datasets, a weighted correlation coefficient against Ccnd1 was calculated across all samples. Shown are examples of negative, zero, and positive correlations, in which expression is plotted in log scale and point size conveys sample weight. b, GSEA results for the Hallmark gene sets using the Ccnd1 correlation coefficient of each gene across all samples. Gene sets are in ascending order based on NES. c, GSEA results for TFT gene sets obtained from the Harmonizome database that are experimentally determined (TRANSFAC and ChEA) and computationally predicted (MSigDB and MotifMap). Shown are the top twelve anticorrelated gene sets based on NES for each gene set collection (total gene sets screened: 72 for TRANSFAC, 74 for ChEA, 140 for MSigDB, and 34 for MotifMap). Smad3 is highlighted in each collection. d, Enrichment plots for the Hallmark gene set TGF BETA SIGNALING in each of the previously mentioned RNA-Seq comparisons. NES, normalized enrichment score in b-d; ES, running enrichment score; S2N, GSEA Signal2Noise ranking metric in d.
Extended Data Fig. 9.
Extended Data Fig. 9.. TGFβ-Smad3 activity in MuSCs with aging, Cyclin D1 deficiency, and pharmacologic modulation.
a-c, Western blots on freshly isolated MuSCs to assess for activating C-terminal phosphorylation of Smad3. Each lane’s phospho-Smad3 level was normalized first to Histone 3 and then to the grand mean of each blot; blots quantified in each figure contained equals numbers of each replicate type. a, MuSCs were from Y(Veh), O(Veh), and O(LY) mice. Shown is a representative blot and quantification of two blots. Each lane represents MuSCs from one mouse (n=6 lanes per group). b, MuSCs were from WT(Veh), HET(Veh), and HET(LY) mice. Shown is a representative blot and quantification of two blots. Each lane represents MuSCs from one mouse (n=6 lanes per group). c, MuSCs were from WT(Veh), KO(Veh), and KO(LY) mice. Shown is a representative blot and quantification of two blots. Each lane represents MuSCs from one mouse (n=6 lanes per group). *P<0.05; one-tailed Mann-Whitney U-test in a-e.
Fig. 1 ∣
Fig. 1 ∣. Exercise improves old muscle repair and MuSC function.
a, Three weeks after exercise or no exercise, mice were transferred to new cages without wheels, and TA muscles were injured. After 4.5 days, muscles were isolated and stained to detect regeneration. b, The injured area occupied by eMHC+ myofibers was quantified (n=6 mice per group). c, Ten thousand freshly isolated YFP+ MuSCs from each donor mouse were transplanted into pre-injured TA muscles of host NOD-SCID mice. Ten days after transplantation, muscles were stained to detect donor-derived (YFP+) myofibers. d, The mean cross-sectional areas (CSA) of YFP+ myofibers were quantified and then normalized to the mean Y(−Ex) level in each experiment (n=9 for O(−Ex), 9 for O(+Ex), and 6 for Y(−Ex) muscles). e, The numbers of YFP+ myofibers in recipient muscles were counted (n=9 for O(−Ex), 9 for O(+Ex), and 6 for Y(−Ex) muscles). f, FACS-isolated MuSCs were cultured, and enlargement was measured with a Coulter counter (n=15 mice per group). g, MuSCs were cultured continuously in EdU to assess S-phase progression (n=4 for Y(−Ex), 5 for Y(+Ex), 7 for O(−Ex), and 7 for O(+Ex) mice). h, Single MuSCs were sorted during FACS isolation into individual wells to assess clonogenic capacity (n=4 for Y(−Ex), 5 for Y(+Ex), 7 for O(−Ex), and 7 for O(+Ex) mice). Scale bars in a, c, 100 μm. Data are summarized with mean + s.e.m. *P<0.05; two-tailed Welch’s t-test in b, d-h.
Fig. 2 ∣
Fig. 2 ∣. Exercise partly restores the old MuSC transcriptome and enhances Cyclin D1 expression.
a, PCA of RNA-Seq profiles of MuSCs from young or old, non-exercised or exercised mice. Each profile represents the MuSCs of an individual mouse. b, GSEA enrichment plots for the E2F TARGETS gene set, representing cell cycle genes. c, Volcano plot of transcripts in the RNA-Seq profiles of MuSCs from old non-exercised or old exercised mice. Ccnd1 is labeled as the transcript most strongly upregulated by exercise. d, RT-qPCR for Ccnd1 in MuSCs from mice independent of those used in the RNA-Seq experiment. Ct values were normalized first to the mean of Gapdh, Hprt, and Actb1 and then to the mean Y(−Ex) level in each experiment (n=13 for O(−Ex), 14 for O(+Ex), and 13 for Y(−Ex) mice). e, Single-molecule RNA-FISH for Ccnd1 in freshly isolated MuSCs. For comparison, also shown are results for Y(Activated) MuSCs isolated from mice three days after injury (n=54 cells in each group, pooled from 3 Y(−Ex), 4 O(+Ex), 4 O(−Ex), and 3 Y(Activated) mice). f, Western blot analysis of Cyclin D1 in MuSCs. Each lane represents a pool of two to three mice. Shown is a representative blot and quantification of two blots (n=6 for O(−Ex), 6 for O(+Ex), and 5 for Y(−Ex) lanes). ES, running enrichment score; NES, normalized enrichment score; S2N, GSEA Signal2Noise ranking metric in b. Data are summarized with mean and s.e.m. in d, f, box-and-whisker plots (bottom whisker, min; box bottom, 25th percentile; box middle, median; box top, 75th percentile; top whisker, max; “+”, mean) in e. *P<0.05; two-tailed Welch’s t-test in d, e; two-tailed Mann-Whitney U-test in f.
Fig. 3 ∣
Fig. 3 ∣. Exercise improves MuSC activation through Cyclin D1.
a, Freshly isolated MuSCs were transfected with non-targeting (Ctrl) or Ccnd1-targeting (D1) siRNA pools. One day later, MuSCs were harvested for Western blot. Shown is a representative blot and quantification of three blots. Each lane represents a pool of two to four mice split into the two siRNA conditions (n=3 lanes per group). b, Ccnd1 single-molecule RNA-FISH on MuSCs transfected as in a and fixed after two days (n=127 cells in each group, pooled from 2 mice split into the two siRNA conditions). c-d, Cyclin D1 immunofluorescence on MuSCs transfected as in a and fixed after two days (n=99 cells per group, pooled from 8 mice split into the two siRNA conditions). e, MuSCs transfected as in a were grown continuously in EdU (n=3 for Y(−Ex), 4 for O(−Ex), and 3 for O(+Ex) mice). f, Western blot of MuSCs from WT, HET, or KO mice, without or with exercise. Shown is a representative blot and quantification of three blots. Each lane represents a pool of one to four mice (n=5 for HET(−Ex), 7 for HET(+Ex), 3 for KO(−Ex), 3 for KO(+Ex), and 12 for WT(−Ex) lanes). g-h, Cyclin D1 immunofluorescence on MuSCs from WT, HET, or KO mice fixed after two days (n=99 cells per group, pooled from 6 WT, 3 HET, and 2 KO mice). i, Lower hindlimb muscles were injured to activate MuSCs in vivo. After 1.5 days, mice received an intraperitoneal injection of EdU. MuSCs from these muscles were isolated twelve hours later for EdU staining (n=7 for HET(−Ex), 7 for HET(+Ex), 6 for KO(−Ex), 6 for KO(+Ex), and 11 for WT(−Ex) mice). j, MuSCs from each mouse were split into the two infection conditions: GFP-V5 (Ctrl) lentiviruses vs. Ccnd1-V5 (D1) lentiviruses. During the infection, MuSCs were held in Tubastatin A (TubA) to maintain quiescence. After three days, MuSCs were fixed and stained for the V5 tag. Analysis of these images showed infection rates of 47 ± 9% (n=3, mean ± SD) for lentiCtrl and 54 ± 3% (n=3, mean ± SD) for lentiD1 infections k, MuSCs from each mouse were infected with Ctrl or D1 lentiviruses immediately upon isolation, and enlargement was measured with a Coulter counter (n=3 mice per group). l, MuSCs infected as in j were activated in the presence of EdU for two days by removing TubA (n=3 mice per group). m, Western blot of MuSCs from TetCtrl and TetD1WT mice. Shown is a representative blot and quantification of two blots. Each lane represents MuSCs from one mouse (n=4 lanes per group). n-o, Exit from quiescence was measured by cell size (n) and S-phase entry (o) (n=6 for TetCtrl, 6 for TetD1WT, and 4 for TetD1KE hindlimbs). Scale bars in c, g, j, 50 μm. Data are summarized with mean and s.e.m. in f, i, m-o, box-and-whisker plots (bottom whisker, min; box bottom, 25th percentile; box middle, median; box top, 75th percentile; top whisker, max; “+”, mean) in b, d, h. NS, not significant; *P<0.05; one-tailed ratio paired t-test in a, one-tailed Welch’s t-test in b, d, h, i, n, o, one-tailed unpaired t-test in k, one-tailed paired t-test between groups connected by dotted lines in e, l, one-tailed Welch’s t-test between O(−Ex)(siCtrl) and O(+Ex)(siD1) in e and between Y(lentiCtrl) and O(lentiCtrl) in l, one-tailed Mann-Whitney U-test in f, m.
Fig. 4 ∣
Fig. 4 ∣. Cyclin D1 represses TGFβ signaling activity in quiescent MuSCs.
a, PCA of RNA-Seq profiles of MuSCs from young WT, HET, or KO mice (with respect to Ccnd1), or old WT mice. Each profile represents the MuSCs of an individual mouse. b, GSEA was performed with the Hallmark gene sets using the Ccnd1 correlation coefficients. Shown are the normalized enrichment score values for the negatively enriched sets. TGFβ signaling is labeled as the top negatively correlated gene set. c, Enrichment plot for the TGFβ signaling gene set. d, GSEA using experimentally determined TFT gene sets in the TRANSFAC/Harmonizome database. Smad3 is labeled as the transcription factor with the top negatively correlated TFT gene set. e, Enrichment plot for the Smad3 TFT gene set. f-g, Western blots on freshly isolated MuSCs to assess for activating C-terminal phosphorylation of Smad3. Each lane’s phospho-Smad3 level was normalized to Histone 3 and then to the grand mean of each blot; blots quantified in each figure contained equals numbers of each replicate type. f, MuSCs were from Y(−Ex), O(−Ex), and O(+Ex) mice. Shown is a representative blot and quantification of three blots. Each lane represents a pool of one to three mice (n=8 lanes per group). g, MuSCs were from WT(−Ex), HET(−Ex), and HET(+Ex) mice. Shown is a representative blot and quantification of two blots. Each lane represents MuSCs from one mouse (n=6 lanes per group). h-k, Mice were treated with TGFβ Receptor 1 inhibitor (LY, LY364947) or vehicle (Veh, DMSO) via intraperitoneal injection daily for five days. h, On the sixth day, FACS-isolated MuSCs were cultured and then fixed to analyze cell enlargement by staining for α-tubulin and quantifying cell area (n=3 for O(DMSO), 3 for O(LY364947), and 1 for Y(DMSO) mice). i-k, On the sixth day, MuSCs were isolated and cultured continuously with EdU to assess S-phase progression. i, n=6 for O(DMSO), 5 for O(LY364947), and 2 for Y(DMSO) mice. j, n=5 for HET(DMSO), 6 for HET(LY364947), and 6 for WT(DMSO) mice. k, n=5 for KO(DMSO), 8 for KO(LY364947), and 4 for WT(DMSO) mice. l, MuSCs isolated from old WT mice were treated with TGFβ Receptor 1 inhibitor (LY, LY364947) or vehicle (Veh, DMSO) for twelve hours. During the treatment, MuSCs were held in Tubastatin A (TubA) to maintain quiescence. MuSCs were then activated in the presence of EdU for two days by removing TubA (n=9 mice per group). ES, running enrichment score; NES, normalized enrichment score in c, e. Data are summarized with mean + s.e.m. *P<0.05; one-tailed unpaired t-test in f-g-l; two-tailed Welch’s t-test in h-k.
Fig. 5 ∣
Fig. 5 ∣. Schematic of old MuSC rejuvenation by exercise.
Aging impairs MuSC activation, which encompasses the first MuSC division after stimulation and includes processes such as cell enlargement and DNA replication. Voluntary wheel running for three weeks in old mice restores MuSC activation ability and muscle regeneration. Mechanistically, this rejuvenation occurs through restoration of the expression of Cyclin D1 in quiescent MuSCs which plays a distinct role of preparing these cells for efficient activation. This function of Cyclin D1 in stem cell readiness for activation involves suppression of the pro-aging TGFβ-Smad3 signaling pathway during the quiescence state. Taken together, this work demonstrates that voluntary exercise is a practicable intervention for old MuSCs rejuvenation.

References

    1. Sherwin C Voluntary wheel running: a review and novel interpretation. Anim. Behav 56, 11–27 (1998). - PubMed
    1. van Praag H, Shubert T, Zhao C & Gage FH Exercise enhances learning and hippocampal neurogenesis in aged mice. J. Neurosci. Off. J. Soc. Neurosci 25, 8680–8685 (2005). - PMC - PubMed
    1. Abreu P, Mendes SVD, Ceccatto VM & Hirabara SM Satellite cell activation induced by aerobic muscle adaptation in response to endurance exercise in humans and rodents. Life Sci. 170, 33–40 (2017). - PubMed
    1. Kurosaka M, Naito H, Ogura Y, Machida S & Katamoto S Satellite cell pool enhancement in rat plantaris muscle by endurance training depends on intensity rather than duration. Acta Physiol. Oxf. Engl 205, 159–166 (2012). - PubMed
    1. Dungan CM et al. Elevated myonuclear density during skeletal muscle hypertrophy in response to training is reversed during detraining. Am. J. Physiol. Cell Physiol 316, C649–C654 (2019). - PMC - PubMed

Publication types