. 2021 Jul 23;36(8):1408-1417.
doi: 10.1093/ndt/gfaa066.

PR3-ANCAs predict relapses in ANCA-associated vasculitis patients after rituximab

Affiliations

PR3-ANCAs predict relapses in ANCA-associated vasculitis patients after rituximab

Laura S van Dam et al. Nephrol Dial Transplant. .

Abstract

Background: The primary challenge of anti-neutrophil cytoplasmic antibody (ANCA)-associated vasculitis (AAV) patient care is the early detection of relapses to prevent organ damage and increase survival. Potential biomarkers for relapses are ANCA and B cells, but their predictive value is a matter of debate. Therefore this study investigated how ANCA and B-cell status related to relapses in AAV patients treated with rituximab (RTX) as remission induction (RI).

Methods: This single-centre cohort study identified 110 ANCA-positive AAV patients treated with RTX between 2006 and 2018. Serial ANCA, CD19+ B-cell status and relapses were assessed >2 years.

Results: Patients (31/110) relapsed within 2 years after RTX RI treatment. Patients who achieved and maintained PR3-ANCA negativity (n = 29) had few relapses (3%), while persistent proteinase 3 (PR3)-ANCA positivity (n = 49) and reappearance of PR3-ANCAs (n = 10) associated significantly with more relapses (37%, P = 0.002 and 50%, P = 0.002). Patients with incomplete B-cell depletion (n = 11) had significantly more relapses (54%) as compared with patients with B-cell depletion [n = 76 (26%), P = 0.02]. Also, patients with repopulation of B cells (n = 58) had significantly more relapses (41%) as compared with patients without B-cell repopulation [n = 27 (15%), P = 0.03]. Overall, the absence of PR3- or myeloperoxidase (MPO)-ANCA positivity was highly predictive for remaining relapse-free. In PR3-ANCA-positive patients, 96% of the relapses occurred with persistent or reappearance of PR3-ANCAs and 81% with B-cell repopulation. In MPO-ANCA-positive patients, all relapses were restricted to patients with persistent MPO-ANCAs and B-cell repopulation.

Conclusions: Upon RI treatment with RTX in AAV patients, ANCA and B-cell status were predictive of the majority of relapses and specifically their absence strongly predicted a relapse-free status. Therefore the implementation of ANCA and B-cell monitoring could guide therapeutic decision-making to prevent relapses in AAV patients treated with RTX.

Keywords: ANCA; biomarkers; crescentic glomerulonephritis; immunomonitoring; rituximab; vasculitis.


Figures

FIGURE 1
FIGURE 1
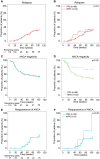
Relapses and ANCA monitoring after RI treatment with RTX. (A) Time to relapse (red lines) after RI therapy with RTX in AAV patients (n = 110) depicted as Kaplan–Meier plots. (B) Stratified analyses of time to relapse for PR3- (n = 88) versus MPO-ANCA-positive (n = 22) patients (red lines). (C) Time to ANCA negativity after RI therapy with RTX depicted as Kaplan–Meier plots. (D) Stratified analyses of time to ANCA negativity for PR3- versus MPO-ANCA-positive patients. (E) Kaplan–Meier plots of time to reappearance of ANCA (n = 47, blue lines) after RI therapy with RTX. (F) Stratified analyses of time to reappearance of ANCA for PR3- versus MPO-ANCA-positive patients who achieved ANCA negativity. The footnote indicates the number of the remaining patients in each arm with available data.
FIGURE 2
FIGURE 2
PR3-ANCA status associated with relapses after RTX. (A) Kaplan–Meier plots of relapses after RI therapy with RTX in PR3-ANCA-positive patients who achieved and maintained PR3 negativity (green lines, n = 29), patients who remained PR3-ANCA positive (blue lines, n = 49) or patients who initially achieved PR3 negativity but experienced reappearance of PR3-ANCA positivity (red lines, n = 10). (B) Kaplan–Meier plots of relapses after RI therapy with RTX in MPO-ANCA-positive patients who achieved and maintained MPO-ANCA negativity (green lines, n = 2), patients who remained MPO-ANCA positive (blue lines, n = 17) and patients who initially achieved MPO-ANCA negativity but experienced reappearance of MPO-ANCA positivity (red lines, n = 3). To test statistical differences between the groups, a log-rank test was performed.
FIGURE 3
FIGURE 3
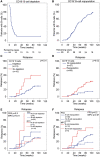
CD19+ B-cell status associated with relapses after RTX. (A) Kaplan–Meier plots of time to B-cell depletion in AAV patients after RTX as RI (n = 84). (B) Kaplan–Meier plots of time to B-cell repopulation within 2 years after RTX as RI in AAV patients (n = 85). (C) Kaplan–Meier plot of time to relapse in patients who had no CD19+ B-cell depletion (<1 × 106/L; (n = 10, red lines) after RTX compared with patients with CD19+ B-cell depletion (n = 74) (blue lines). (D) Kaplan–Meier plot of time to relapse in patients who had CD19+ B-cell repopulation (>1 × 106/L; n = 58, red line) after RTX compared with patients without CD19+ B-cell repopulation (n = 27, blue line). (E) Stratified analyses of time to relapse in PR3-ANCA-positive (blue lines) versus MPO-ANCA-positive patients (red lines) without B-cell depletion (solid) or with B-cell depletion (dashed) depicted as Kaplan–Meier curves. (F) Stratified analyses of relapses in PR3-ANCA-positive (blue lines) versus MPO-ANCA-positive patients (red lines) with (solid) or without (dashed) B-cell repopulation depicted as Kaplan–Meier curves. To test statistical differences between the groups, the log-rank test was used to assess time-to-event data. The footnote indicates the number of the remaining patients in each arm with available data.
FIGURE 4
FIGURE 4
Combined ANCA and B-cell status predicted relapses after RTX. (A) Kaplan–Meier plots of time to relapse in PR3-ANCA-positive patients after RI treatment with RTX comparing patients who achieved PR3-ANCA negativity or not in combination with or without the presence of CD19+ B cells. Six subgroups of patients were identified: achieving PR3-ANCA negativity without B-cell repopulation (green, n = 12), achieving PR3-ANCA negativity with B-cell repopulation (blue, n = 14), reappearance of PR3-ANCA positivity after achieving PR3-ANCA negativity without B-cell repopulation (pink, n = 1), reappearance of PR3-ANCA positivity after achieving PR3-ANCA negativity with B-cell repopulation (red, n = 8), persistent PR3-ANCA positivity without B-cell repopulation (orange, n = 14) and persistent PR3-ANCA positivity with B-cell repopulation (yellow, n = 25). (B) Kaplan–Meier plots of time to relapse in MPO-ANCA-positive patients after RI treatment with RTX comparing three subgroups of patients: reappearance of MPO-ANCA positivity after achieving MPO-ANCA negativity without B-cell repopulation (n = 2, pink), persistent MPO-ANCA positivity without B-cell repopulation (n = 2, orange) and persistent MPO-ANCA positivity with B-cell repopulation (n = 12, yellow). To test statistical differences between the groups, a log-rank test was performed.

References

    1. Jennette JC, Wilkman AS, Falk RJ.. Anti-neutrophil cytoplasmic autoantibody-associated glomerulonephritis and vasculitis. Am J Pathol 1989; 135: 921–930 - PMC - PubMed
    1. Jennette JC, Falk RJ.. Pathogenesis of antineutrophil cytoplasmic autoantibody-mediated disease. Nat Rev Rheumatol 2014; 10: 463–473 - PubMed
    1. Yates M, Watts RA, Bajema IM. et al.. EULAR/ERA-EDTA recommendations for the management of ANCA-associated vasculitis. Ann Rheum Dis 2016; 75: 1583–1594 - PubMed
    1. Jones RB, Tervaert JW, Hauser T. et al.. Rituximab versus cyclophosphamide in ANCA-associated renal vasculitis. N Engl J Med 2010; 363: 211–220 - PubMed
    1. Stone JH, Merkel PA, Spiera R. et al.. Rituximab versus cyclophosphamide for ANCA-associated vasculitis. N Engl J Med 2010; 363: 221–232 - PMC - PubMed

Publication types