. 2021 Jan;48(1):302-310.
doi: 10.1007/s00259-020-04942-4. Epub 2020 Jun 29.

Defining a Centiloid scale threshold predicting long-term progression to dementia in patients attending the memory clinic: an [18F] flutemetamol amyloid PET study

Affiliations

Defining a Centiloid scale threshold predicting long-term progression to dementia in patients attending the memory clinic: an [18F] flutemetamol amyloid PET study

Bernard J Hanseeuw et al. Eur J Nucl Med Mol Imaging. 2021 Jan.

Abstract

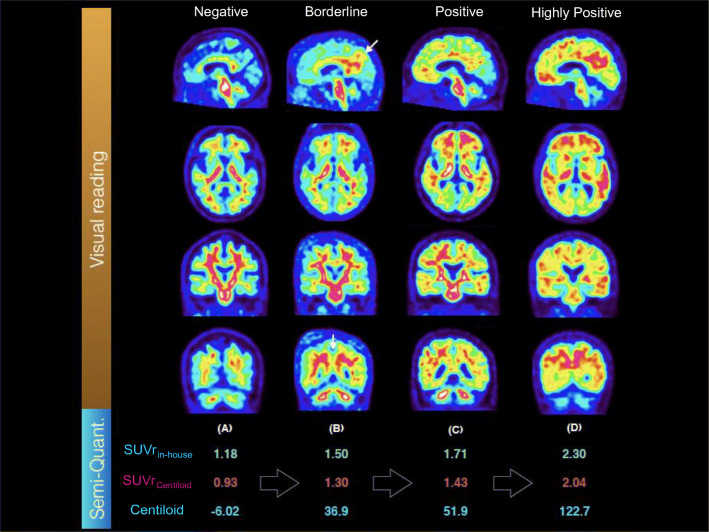
Purpose: To evaluate cerebral amyloid-β(Aβ) pathology in older adults with cognitive complaints, visual assessment of PET images is approved as the routine method for image interpretation. In research studies however, Aβ-PET semi-quantitative measures are associated with greater risk of progression to dementia; but until recently, these measures lacked standardization. Therefore, the Centiloid scale, providing standardized Aβ-PET semi-quantitation, was recently validated. We aimed to determine the predictive values of visual assessments and Centiloids in non-demented patients, using long-term progression to dementia as our standard of truth.

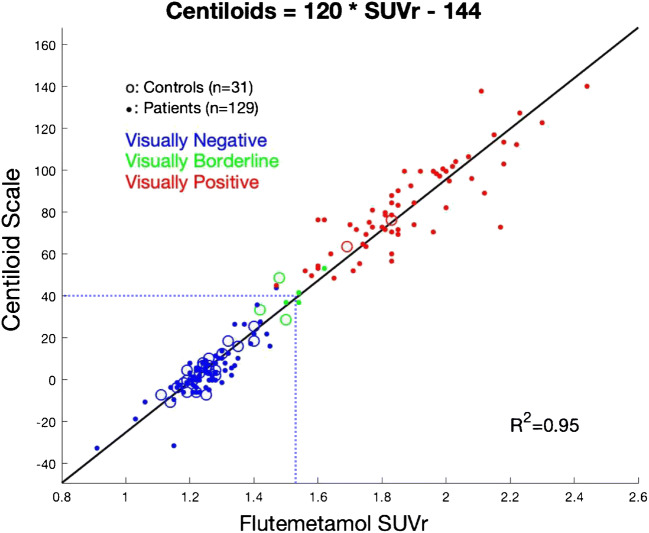
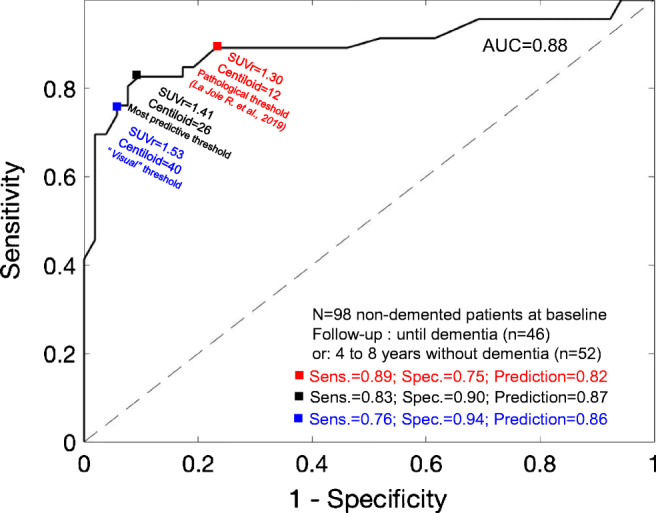
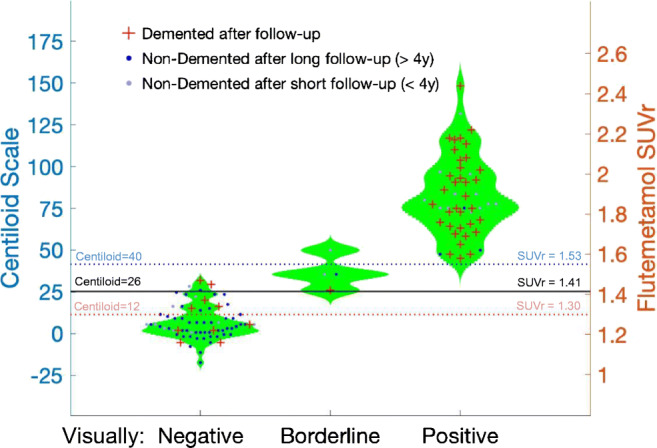
Methods: One hundred sixty non-demented participants (age, 54-86) were enrolled in a monocentric [18F] flutemetamol Aβ-PET study. Flutemetamol images were interpreted visually following the manufacturers recommendations. SUVr values were converted to the Centiloid scale using the GAAIN guidelines. Ninety-eight persons were followed until dementia diagnosis or were clinically stable for a median of 6 years (min = 4.0; max = 8.0). Twenty-five patients with short follow-up (median = 2.0 years; min = 0.8; max = 3.9) and 37 patients with no follow-up were excluded. We computed ROC curves predicting subsequent dementia using baseline PET data and calculated negative (NPV) and positive (PPV) predictive values.

Results: In the 98 participants with long follow-up, Centiloid = 26 provided the highest overall predictive value = 87% (NPV = 85%, PPV = 88%). Visual assessment corresponded to Centiloid = 40, which predicted dementia with an overall predictive value = 86% (NPV = 81%, PPV = 92%). Inclusion of the 25 patients who only had a 2-year follow-up decreased the PPV = 67% (NPV = 88%), reflecting the many positive cases that did not progress to dementia after short follow-ups.

Conclusion: A Centiloid threshold = 26 optimally predicts progression to dementia 6 years after PET. Visual assessment provides similar predictive value, with higher specificity and lower sensitivity.

Trial registration: Eudra-CT number: 2011-001756-12.

Keywords: AD dementia; Amyloid PET; Centiloids; Diagnostic accuracy; Mild cognitive impairment.


Conflict of interest statement

The firm GE Healthcare supplied the [18F] Flutemetamol tracer for acquiring the PET images analyzed in this manuscript. Profs. Hanseeuw, Ivanoiu, and Lhommel disclose receiving consultant fees from GE Healthcare during the course of the project. The amount of the fees received is below 2500€. Dr. G. Farrar and C. Buckley are employees of GE Healthcare. V. Malotaux, Drs. Dricot, Quenon, Sznajer, Cerman, and Woodard report no conflicts of interest.

Figures

Fig. 1
Fig. 1
Illustrative PET images with visual (top) and semi-quantitative assessments (bottom). Four cases have been selected illustrating a a negative, b a borderline, c a positive, and d a highly positive PET reading. Visually borderline cases are overall negative with positivity visible in the posterior cingulate region. Because PET results were disclosed to patients, we did not feel confident to classify these scans as positive before having follow-up. Positive and highly positive cases were treated similarly
Fig. 2
Fig. 2
Scatterplot demonstrating the linear relationship between PET data expressed using our in-house [18F]-flutemetamol SUVr and the same PET data expressed in the Centiloid scale. Visual threshold corresponded to Centiloid = 40 (SUVr = 1.53), indicated by the blue dotted line. The direct conversion of SUVrCentiloid to Centiloid values was Centiloid = 116.0 × SUVrCentiloid − 113.9. The conversion of our in-house SUVr (using cerebellar gray as the reference region) to Centiloid values was: Centiloid = 120.2 × SUVrin-house − 144.5
Fig. 3
Fig. 3
Receiver operating characteristic (ROC) curves using baseline [18F]-flutemetamol PET data to predict dementia progression after a median six-year follow-up. The most predictive threshold was observed at Centiloid = 26 (black square). Visual threshold (blue square) and a threshold based on pathological literature (red square) are also provided
Fig. 4
Fig. 4
Violin plots presenting PET quantitative data according to visual readings, clinical outcomes after follow-up, and follow-up duration
Fig. 5
Fig. 5
Baseline Aβ-PET predicts subsequent change in PET data, driven by individuals with positive quantitation at baseline. Left: fast accumulation (> 5 Centiloids per year) was only observed in participants with Centiloid ≥ 26 at baseline. Note that no patients had a baseline Centiloid between 20 and 25. All participants but one (borderline) had a visually negative baseline PET, although four participants (designated with ×) had positive quantitation (Centiloid between 27.6 and 43.9). Right: illustrative PET images of a participant who demonstrated increased Aβ-PET signal during follow-up

Similar articles

Cited by

References

    1. Klunk WE, et al. Imaging brain amyloid in Alzheimer’s disease with Pittsburgh Compound-B. Ann Neurol. 2004;55(3):306–319. doi: 10.1002/ana.20009. - DOI - PubMed
    1. Mintun MA, et al. [11C]PIB in a nondemented population: potential antecedent marker of Alzheimer disease. Neurology. 2006;67(3):446–452. doi: 10.1212/01.wnl.0000228230.26044.a4. - DOI - PubMed
    1. Lim YY, et al. Abeta and cognitive change: examining the preclinical and prodromal stages of Alzheimer’s disease. Alzheimers Dement. 2014;10(6):743–751. doi: 10.1016/j.jalz.2013.11.005. - DOI - PubMed
    1. Donohue MC, et al. Association between elevated brain amyloid and subsequent cognitive decline among cognitively normal persons. JAMA. 2017;317(22):2305–2316. doi: 10.1001/jama.2017.6669. - DOI - PMC - PubMed
    1. Wolk DA, et al. Use of flutemetamol F 18-labeled positron emission tomography and other biomarkers to assess risk of clinical progression in patients with amnestic mild cognitive impairment. JAMA Neurol. 2018;75(9):1114–1123. doi: 10.1001/jamaneurol.2018.0894. - DOI - PMC - PubMed

Publication types